. 2023 Aug 20;15(16):4183.
doi: 10.3390/cancers15164183.

Integrative Evaluation of the Clinical Significance Underlying Protein Arginine Methyltransferases in Hepatocellular Carcinoma

Affiliations

Integrative Evaluation of the Clinical Significance Underlying Protein Arginine Methyltransferases in Hepatocellular Carcinoma

Yikun Jiang et al. Cancers (Basel). .

Abstract

HCC is a major contributor to cancer-related mortality worldwide. Curative treatments are available for a minority of patients diagnosed at early stages; however, only a few multikinase inhibitors are available and are marginally effective in advanced cases, highlighting the need for novel therapeutic targets. One potential target is the protein arginine methyltransferase, which catalyzes various forms of arginine methylation and is often overexpressed in various cancers. However, the diverse expression patterns and clinical values of PRMTs in HCC remain unclear. In the present study, we evaluated the transcriptional expression of PRMTs in HCC cohorts using publicly available datasets. Our results revealed a significant association between PRMTs and prognosis in HCC patients with diverse clinical characteristics and backgrounds. This highlights the promising potential of PRMTs as prognostic biomarkers in patients with HCC. In particular, single-cell RNA (scRNA) sequencing analysis coupled with another human cohort study highlighted the pivotal role of PRMT1 in HCC progression, particularly in the context of Tex. Translating these findings into specific therapeutic decisions may address the unmet therapeutic needs of patients with HCC.

Keywords: T cell exhaustion; hepatocellular carcinoma; prognostic marker; protein arginine methyltransferase; protein methylation; tissue microarray.


Conflict of interest statement

The authors declare that the research was conducted in the absence of commercial or financial relationships that could be construed as potential conflicts of interest.

Figures
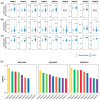
Figure 1
Figure 1
Expression levels of the protein arginine methyltransferase (PRMT) family members in normal liver and hepatocellular carcinoma (HCC) cells indicating the diagnostic potential of PRMTs in HCC. (AC) Box and whisker plots showing the expression levels of all detected PRMTs in normal and HCC samples of three independent cohorts ((A). GSE14520, normal = 241, HCC = 247; (B). GSE25097, normal = 249, HCC = 268; (C). GSE36376, normal = 193, HCC = 240). The horizontal line crossing each box designates the median, while the top and bottom edges represent the first (25%) and third quartiles (75%), respectively. The dots indicate the expression value of each subject. Shapiro–Wilk test to determine the normality and Wilcoxon Rank-Sum test to compare the two groups (normal liver vs. HCC) were performed. * p < 0.05, *** p < 0.001, **** p < 0.0001. (D) The values of Area Under the Receiver Operating Characteristic Curve (AUROC) scores indicate diagnostic potential of PRMTs, implying their association with HCC.
Figure 2
Figure 2
Relationship between the expression levels of PRMTs and the clinicopathological features in The Cancer Genome Atlas (TCGA) patients with liver hepatocellular carcinoma (LIHC). Boxplot showing the expression levels of PRMTs in each stage (Stage I = 170, II = 86, and III + IV = 88) in TCGA LIHC, representing the prognostic potential of PRMTs in HCC. The horizontal line crossing each box designates the median, while the top and bottom edges represent the first (25%) and third quartiles (75%), respectively. The grey dots indicate the expression value of each subject. Shapiro–Wilk test to determine the normality and Kruskal–Wallis test to compare the three groups (Stage I, II and III+IV) were performed. * p < 0.05, ** p < 0.01.
Figure 3
Figure 3
Correlation between PRMT expression and overall outcomes in HCC patients. Kaplan–Meier curves show the correlation between hepatic PRMT expression and overall survival. The R package, multipleROC, divided into two groups (i.e., high vs. low PRMT expression) according to the optimal gene expression level of each PRMT. The R packages, survminer and survival, estimated the survival probability.
Figure 4
Figure 4
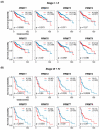
Prognostic significance of PRMTs in patients with different stages of HCC. (A,B) Survival probabilities (Kaplan–Meier curves) in different stages (Stages I + II and III + IV) of HCC show the association between hepatic PRMT expression and overall survival. The R package, multipleROC, divided into two groups (i.e., high vs. low PRMT expression) according to the optimal gene expression level of each PRMT. The R packages, survminer and survival, estimated the survival probability.
Figure 5
Figure 5
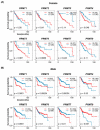
Gender-specific correlations of PRMTs in human HCC. (A,B) Survival probabilities (Kaplan–Meier curves) in the female (A) and male (B) patients with HCC show the gender-specific association between hepatic PRMT expression and overall survival. The R package, multipleROC, divided into two groups (i.e., high vs low PRMT expression) according to the optimal gene expression level of each PRMT. The R packages, survminer and survival, estimated the survival probability.
Figure 6
Figure 6
Ethnicity-specific correlations of PRMTs in human HCC. (A,B) Forest plot showing the hazard ratio and statistical significance for overall survival in Asian (A) and Caucasian cohorts (B), based on high versus low expression of PRMTs in HCC. The comparison indicated the race-specific association between hepatic PRMT expression and overall survival. The R package, multipleROC, divided into two groups (i.e., high vs. low PRMT expression) according to the optimal gene expression level of each PRMT. * p < 0.05, ** p < 0.01, *** p < 0.001.
Figure 7
Figure 7
PRMT expression and immune checkpoint correlations in CD8+ cells of HCC patients. (A) UMAP-based Trajectory Analysis elucidating the developmental trajectory of CD8+ T cells in peripheral blood and HCC samples. (B) UMAP visualization identifying the differential expression patterns of PRMT family genes across distinct cell types. (C,D) Cell type-specific UMAPs representing the transcriptional profiles of genes in naïve (C) and exhausted (D) condition.
Figure 8
Figure 8
Prognostic significance of PRMT1 and PRMT1-positive T cell exhaustion (Tex) in HCC patients. (A) Representative multiplex immunofluorescent staining to show the expression patterns of PRMT1 (Green) in HCC and normal tissues, as well as in Tex with PD-1+ (Red) and CD8+ (Yellow) co-expression. (B,C) The expression patterns (positive rate and expression intensity) of PRMT1 (B) and PRMT1-positive Tex (PRMT1-Tex) (C) are statistically higher in HCC compared to normal tissues. (D,E) Patients are divided into two groups for further comparisons by the positive rates of PRMT1 in HCC (D) or in Tex of HCC (E), as high expression (Hi) as top 25% and low expression (Lo) as bottom 75%. (F) Survival probabilities (Kaplan–Meier curves) show the correlation between PRMT1 (or PRMT1-Tex) expression and overall survival. (G) Survival probabilities in the male patients with HCC show the association between PRMT1 (or PRMT1-Tex) expression and overall survival. (H,I) Survival probabilities in Stage I + II (H) and Stage III + IV (I) of HCC show the association between PRMT1 (or PRMT1-Tex) expression and overall survival. The R package, multipleROC, divided into two groups (i.e., Hi vs. Lo) according to the optimal gene expression level of PRMT1 (or PRMT1-Tex). The R packages, survminer and survival, estimated the survival probability. All results related to HCC patients and their clinical records in this figure were performed on and obtained from liver HCC microarray.
Figure 8
Figure 8
Prognostic significance of PRMT1 and PRMT1-positive T cell exhaustion (Tex) in HCC patients. (A) Representative multiplex immunofluorescent staining to show the expression patterns of PRMT1 (Green) in HCC and normal tissues, as well as in Tex with PD-1+ (Red) and CD8+ (Yellow) co-expression. (B,C) The expression patterns (positive rate and expression intensity) of PRMT1 (B) and PRMT1-positive Tex (PRMT1-Tex) (C) are statistically higher in HCC compared to normal tissues. (D,E) Patients are divided into two groups for further comparisons by the positive rates of PRMT1 in HCC (D) or in Tex of HCC (E), as high expression (Hi) as top 25% and low expression (Lo) as bottom 75%. (F) Survival probabilities (Kaplan–Meier curves) show the correlation between PRMT1 (or PRMT1-Tex) expression and overall survival. (G) Survival probabilities in the male patients with HCC show the association between PRMT1 (or PRMT1-Tex) expression and overall survival. (H,I) Survival probabilities in Stage I + II (H) and Stage III + IV (I) of HCC show the association between PRMT1 (or PRMT1-Tex) expression and overall survival. The R package, multipleROC, divided into two groups (i.e., Hi vs. Lo) according to the optimal gene expression level of PRMT1 (or PRMT1-Tex). The R packages, survminer and survival, estimated the survival probability. All results related to HCC patients and their clinical records in this figure were performed on and obtained from liver HCC microarray.

Similar articles

Cited by

References

    1. Sung H., Ferlay J., Siegel R.L., Laversanne M., Soerjomataram I., Jemal A., Bray F. Global cancer statistics 2020: GLOBOCAN estimates of incidence and mortality worldwide for 36 cancers in 185 countries. CA-Cancer J. Clin. 2021;71:209–249. doi: 10.3322/caac.21660. - DOI - PubMed
    1. Goh L.Y., Leow A.H.R., Goh K.L. Observations on the epidemiology of gastrointestinal and liver cancers in the Asia-Pacific region. J. Digest Dis. 2014;15:463–468. doi: 10.1111/1751-2980.12164. - DOI - PubMed
    1. Shao X.Y., Dong J., Zhang H., Wu Y.S., Zheng L. Systematic Analyses of the Role of the Reader Protein of N (6)-Methyladenosine RNA Methylation, YTH Domain Family 2, in Liver Hepatocellular Carcinoma. Front. Mol. Biosci. 2020;7:577460. doi: 10.3389/fmolb.2020.577460. - DOI - PMC - PubMed
    1. Orcutt S.T., Anaya D.A. Liver Resection and Surgical Strategies for Management of Primary Liver Cancer. Cancer Control. 2018;25:1073274817744621. doi: 10.1177/1073274817744621. - DOI - PMC - PubMed
    1. Llovet J.M., Burroughs A., Bruix J. Hepatocellular carcinoma. Lancet. 2003;362:1907–1917. doi: 10.1016/S0140-6736(03)14964-1. - DOI - PubMed

LinkOut - more resources