

Chemical Constituents, Antioxidant, and α-Glucosidase Inhibitory Activities of Different Fermented Gynostemma Pentaphyllum Leaves and Untargeted Metabolomic Measurement of the Metabolite Variation
- PMID: 37627500
- PMCID: PMC10451285
- DOI: 10.3390/antiox12081505
Chemical Constituents, Antioxidant, and α-Glucosidase Inhibitory Activities of Different Fermented Gynostemma Pentaphyllum Leaves and Untargeted Metabolomic Measurement of the Metabolite Variation
Abstract
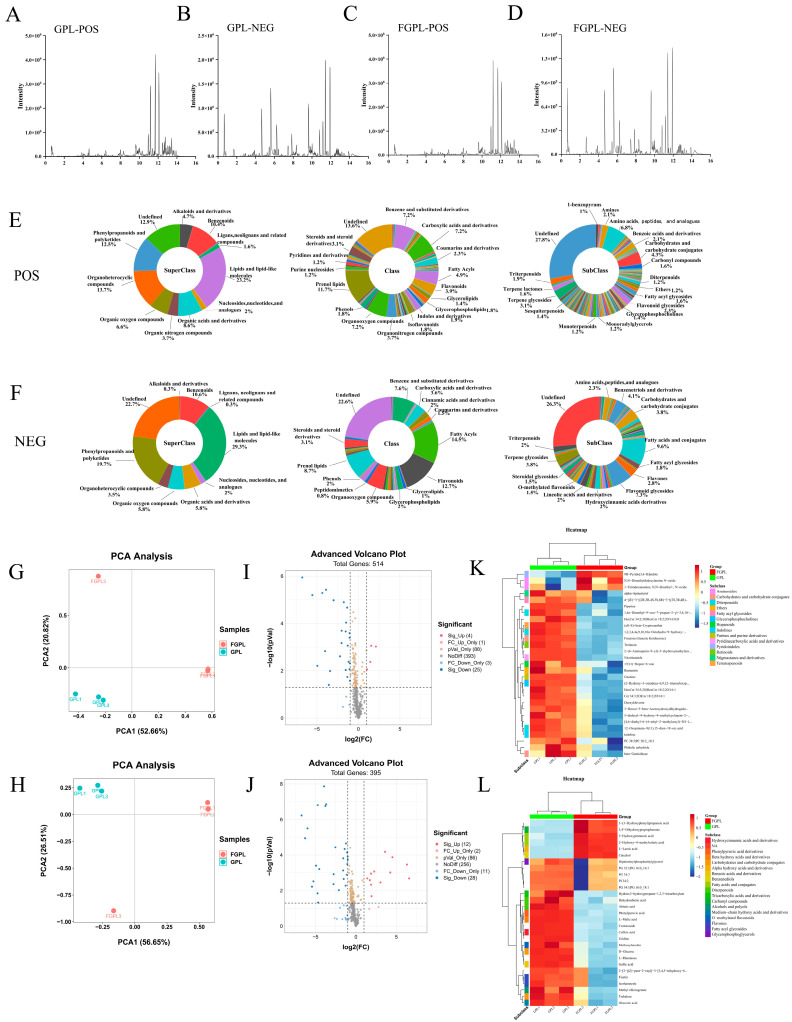
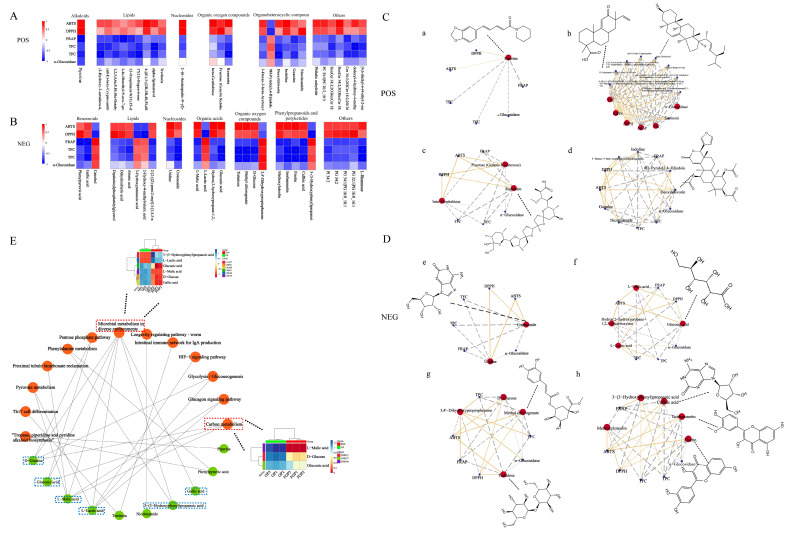
To assess the effects of microbial fermentation on Gynostemma pentaphyllum leaves (GPL), four probiotics were used to ferment GPL (FGPL) for 7 days. At different stages of fermentation, changes in the active components and biological activities of FGPL were determined. The findings suggest that short-term fermentation with probiotics can enhance both the content and bioactivity of active components in GPL. However, prolonged fermentation may lead to a decline in these aspects. Among them, the best effect was observed with SWFU D16 fermentation for 2 days. This significantly improved the total phenolic and total flavonoid content, antioxidant capacity, and inhibitory ability against α-glucosidase activity with an increase of 28%, 114.82%, 7.42%, and 31.8%, respectively. The high-performance liquid chromatography (HPLC) analysis results also supported this trend. Untargeted metabolomics analysis revealed metabolite changes between GPL and FGPL and the key metabolites associated with these functional activities. These key metabolites are mainly organic acids, flavonoids, carbohydrates, terpenoids, and other substances. KEGG analysis demonstrated that microbial metabolism in diverse environments and carbon metabolism were the most significantly enriched pathways. Among them, 3-(3-hydroxyphenyl) propanoic acid, d-glucose, gallic acid, gluconic acid, l-lactic acid, and l-malic acid were mostly involved in the microbial metabolism of diverse environmental pathways. In contrast, D-glucose, gluconic acid, and l-malic acid were mainly related to the carbon metabolism pathway. This study revealed the positive effect of probiotic fermentation on GPL and its potential metabolism mechanism, which could provide supporting data for further research.
Keywords: Gynostemma pentaphyllum leaves; antioxidant capacity; metabolomics; probiotic fermentation; α-glucosidase inhibitory activity.
Conflict of interest statement
The authors declare no conflict of interest.
Figures


Similar articles
-
From Function to Metabolome: Metabolomic Analysis Reveals the Effect of Probiotic Fermentation on the Chemical Compositions and Biological Activities of Perilla frutescens Leaves.Front Nutr. 2022 Jul 11;9:933193. doi: 10.3389/fnut.2022.933193. eCollection 2022. Front Nutr. 2022. PMID: 35898707 Free PMC article.
-
The influence of probiotic fermentation on the active compounds and bioactivities of walnut flowers.J Food Biochem. 2022 Apr;46(4):e13887. doi: 10.1111/jfbc.13887. Epub 2021 Aug 2. J Food Biochem. 2022. PMID: 34338334
-
Integrative metabolomic and transcriptomic analyses reveals the accumulation patterns of key metabolites associated with flavonoids and terpenoids of Gynostemma pentaphyllum (Thunb.) Makino.Sci Rep. 2024 Apr 15;14(1):8644. doi: 10.1038/s41598-024-57716-5. Sci Rep. 2024. PMID: 38622163 Free PMC article.
-
UPLC-TOF/MS-based metabolomics reveals the chemical changes and in vitro biological effects in fermentation of white ginseng by four probiotics.Front Microbiol. 2022 Nov 24;13:1022200. doi: 10.3389/fmicb.2022.1022200. eCollection 2022. Front Microbiol. 2022. PMID: 36504795 Free PMC article.
-
Metabolite profiling, antioxidant and α-glucosidase inhibitory activities of buckwheat processed by solid-state fermentation with Eurotium cristatum YL-1.Food Res Int. 2021 May;143:110262. doi: 10.1016/j.foodres.2021.110262. Epub 2021 Mar 5. Food Res Int. 2021. PMID: 33992363
Cited by
-
Lactiplantibacillus plantarum LZU-J-Q21 enhanced the functional metabolic profile and bioactivity of Cistanche deserticola.Food Chem X. 2024 Oct 30;24:101941. doi: 10.1016/j.fochx.2024.101941. eCollection 2024 Dec 30. Food Chem X. 2024. PMID: 39568517 Free PMC article.
-
The antioxidant activity and metabolomic analysis of the supernatant of Streptococcus alactolyticus strain FGM.Sci Rep. 2024 Apr 10;14(1):8413. doi: 10.1038/s41598-024-58933-8. Sci Rep. 2024. PMID: 38600137 Free PMC article.
References
Grants and funding
LinkOut - more resources
Full Text Sources
