. 2023 Aug 10;12(8):1592.
doi: 10.3390/antiox12081592.

NAC Pre-Administration Prevents Cardiac Mitochondrial Bioenergetics, Dynamics, Biogenesis, and Redox Alteration in Folic Acid-AKI-Induced Cardio-Renal Syndrome Type 3

Affiliations

NAC Pre-Administration Prevents Cardiac Mitochondrial Bioenergetics, Dynamics, Biogenesis, and Redox Alteration in Folic Acid-AKI-Induced Cardio-Renal Syndrome Type 3

Belén Cuevas-López et al. Antioxidants (Basel). .

Abstract

The incidence of kidney disease is increasing worldwide. Acute kidney injury (AKI) can strongly favor cardio-renal syndrome (CRS) type 3 development. However, the mechanism involved in CRS development is not entirely understood. In this sense, mitochondrial impairment in both organs has become a central axis in CRS physiopathology. This study aimed to elucidate the molecular mechanisms associated with cardiac mitochondrial impairment and its role in CRS development in the folic acid-induced AKI (FA-AKI) model. Our results showed that 48 h after FA-AKI, the administration of N-acetyl-cysteine (NAC), a mitochondrial glutathione regulator, prevented the early increase in inflammatory and cell death markers and oxidative stress in the heart. This was associated with the ability of NAC to protect heart mitochondrial bioenergetics, principally oxidative phosphorylation (OXPHOS) and membrane potential, through complex I activity and the preservation of glutathione balance, thus preventing mitochondrial dynamics shifting to fission and the decreases in mitochondrial biogenesis and mass. Our data show, for the first time, that mitochondrial bioenergetics impairment plays a critical role in the mechanism that leads to heart damage. Furthermore, NAC heart mitochondrial preservation during an AKI event can be a valuable strategy to prevent CRS type 3 development.

Keywords: NAC and mitochondria; biogenesis; cardio-renal syndrome type 3; folic acid-induced cardio-renal damage; mitochondrial ROS production; mitochondrial dynamic.


Conflict of interest statement

The authors report no conflict of interest.

Figures

Figure 1
Figure 1
Evaluation of renal damage markers: (A) Creatinine and (B) blood urea nitrogen (BUN) evaluated in plasma; the analysis was conducted on day 7 of evolution (48 h after the last FA administration) using commercial kits. The results are expressed in milligrams per deciliter (mg/dL). Evaluation of liver damage markers: (C) aspartate aminotransferase (AST) and (D) alanine aminotransferase (ALT) in plasma; the analysis was conducted on day 7 of evolution using commercial kits, and the results are expressed in units of the corresponding assays per liter (U/L). Evaluation in plasma of proinflammatory cytokines by Western blot and its densitometry: (E) interleukin one beta (IL-1β) and (F) interleukin six (IL-6). Ponceau S Staining of the corresponding membranes was used as a control charger. Data are mean ± SEM, n = 5–6. ** p < 0.01, *** p < 0.001. FA = Folic Acid, NAC = N-acetyl-cysteine.
Figure 2
Figure 2
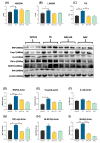
Heart damage markers. (A) HW/BW and (B) LW/BW ratios, (C) creatine kinase (CK) activity in the heart. Data are mean ± SEM, n = 5–6. Western blot representative images and their densitometries of proteins: (D) BNP, (E) Trop C, (F) IL-6, (G) TNF-α, (H) NRLP3 and (I) BAX in heart homogenates. β-Actin was used as loading controls. Data are mean ± SEM, n = 3. * p < 0.05, ** p < 0.01 and *** p < 0.001. BNP = brain natriuretic peptide, BW = body weight, HW = heart weight, LW = lung weight, Trop C = troponin C, IL-6 = Interleukin 6, TNF-α = tumor necrosis factor-alpha, NLRP3 = NLR family pyrin domain containing 3, BAX = Bcl-2-associated X, FA = Folic acid, NAC = N-acetyl-cysteine.
Figure 3
Figure 3
Representative micrographs of heart histology and TNF-alfa and BAX immunohistochemistry. (A) Normal heart histology of a rat from the control vehicle group. (B) FA-treated animal show groups of death cardiomyocytes with condensed nucleus and fragmented hyaline cytoplasm (arrows) and some interstitial lymphocytes (white asterisk). (C) NAC + FA treatment reduced tissue damage. (D) The control animal does not show TNF-alpha immunoreactivity. (E) In contrast, strong TNF-alpha immunoreactivity is seen in the cytoplasm of some myocardial and inflammatory cells; it is particularly intense in the endothelium of small blood vessels (arrows). (F) Rat treated with FA + NAC showed decreased TNF-alpha immunoreactivity; only the endothelium showed immunoreactivity. (G) The control rat does not show BAX immunoreactivity. (H) Numerous cardiomyocytes show BAX immunoreactivity in animals treated with FA. (I) Occasional myocytes show scare immunostaining to BAX in a rat from the NAC + FA group. Quantification of TNF-alpha (J) and BAX (K) immunoreactivity in the heart. The images used for quantification correspond to a size of area x field of 314,679.481 μm. Data are mean ± SEM, n = 7. ** p < 0.01, *** p < 0.001. BAX = Bcl-2 Associated X-protein, FA = Folic Acid, NAC = N-acetyl-cysteine, TNF-alpha = tumor necrosis factor alfa (All micrographs 400× magnification).
Figure 4
Figure 4
Representative images in 2D and echocardiography (Echo). (Top image): Representative two-dimensional echocardiographic images of the parasternal long-axis view in each group. (Bottom image): Corresponding M-mode at the mid-ventricular level from two-dimensional images. It is possible to measure the end-systolic (yellow double-headed arrow) and end-diastolic (red double-headed arrow) diameters of the left ventricle (LV), the thickness of the interventricular septum (IVS), and posterior wall (PW), as well as to calculate the heart rate using the distance between two consecutive systoles (S, white double-headed arrow). FA = folic acid; NAC = N-acetyl-cysteine.
Figure 5
Figure 5
Heart mitochondrial bioenergetics. (A) Levels of the Krebs cycle intermediates 2-oxoglutarate and succinate and activity of 2-oxoglutarate dehydrogenase (2-OGDH) in heart homogenates. (B) The activity of respiratory complexes in isolated mitochondria from the heart: Complex I (CI), Complex II (CII), Complex III (CIII), Complex IV (CIV). (C) ATP synthase activity using PMG = pyruvate, malate, and glutamate and S + R = succinate plus rotenone as a substrate. Data are mean ± SEM, n = 5–6. * p < 0.05, ** p < 0.01, *** p < 0.001. FA = folic acid, NAC = N-acetyl-cysteine.
Figure 6
Figure 6
Heart mitochondrial membrane potential. Changes in mitochondrial membrane potential (ΔΨm) evaluated in isolated heart mitochondria using safranine O as a probe, AUF = arbitrary unit of florescence, PMG = pyruvate, malate, and glutamate, S + R = succinate + rotenone. S3 = state 3, S4o = state 4 induced by oligomycin. FA = folic acid, NAC = N-acetyl-cysteine. Data are mean ± SEM, n = 5–6. * p < 0.05, ** p < 0.01.
Figure 7
Figure 7
Oxidative stress. (A) Rate of mitochondrial hydrogen peroxide (H2O2) production. S2 = State 2, S3 = State 3, S4 = State 4. (B) Activity of antioxidant enzymes in heart homogenates: catalase, SOD = superoxide dismutase, GPx = glutathione peroxidase, and GST = glutathione S-transferase. Data are mean ± SEM, n = 5–6. (C) MDA and 4HNE lipoperoxidation markers evaluated by Western blot (mean ± SEM, n = 3) and by spectrophotometric technique (mean ± SEM, n = 5–6) in heart homogenates. MDA = malondialdehyde, 4HNE = 4-hydroxynonenal. β-Actin was used as a control charger. FA = folic acid, NAC = N-acetyl-cysteine. * p < 0.05, ** p < 0.01, *** p < 0.001.
Figure 8
Figure 8
Mitochondrial stress markers. Activity of (A) citrate synthase (Cit Syn), (B) aconitase (Aco), (C) Aco/Cit Syn ratio, and (D) cardiolipin levels in isolated heart mitochondria. Levels of (E) GSH = glutathione, (F) glutathione disulfide (GSSG), (G) GSH plus GSSG, (H) GSH/GSSG ratio, (I) removal S-glutathionylation activity of the glutaredoxin 2 (GRX) and (J) total S-glutathionylation levels evaluated by Western blot and their densitometry in isolated mitochondria fraction. FA = folic acid, NAC = N-acetyl-cysteine. Data are mean ± SEM, n = 5–6. * p < 0.05 and ** p < 0.01.
Figure 9
Figure 9
Mitochondrial dynamics. Western proteins in the heart isolated mitochondrial and their densitometries of fission protein (A) DRP1 and (B) fusion proteins MFN2. VDAC1 was used as a loading control. Data are mean ± SEM, n = 3. ** p < 0.01. Counting by electron microscopy: (C) total Mitochondrial number and (D) small mitochondria with ovoid or circular morphology per image in cardiomyocyte, as well as (E) fragmentation rate (small/total mitochondria). The electron microscopy images used for counting correspond to a size field of 100 μm. Data are mean ± SEM, n = 7. * p < 0.05, ** p < 0.01, *** p < 0.001. DRP1 immunohistochemistry in heart: (F) Control animal shows scarce DRP1 immunoreactivity. (G) Higher DRP1 immunoreactivity is seen in the cytoplasm of some myocardial cells of the FA group. (H) Rat treated with FA + NAC showed a decrease in DRP1 immunoreactivity in cardiac cells. DRP1 = dynamin-related protein 1, VDAC1 = voltage-dependent anion selective channel 1, MFN2 = mitofusin 2. FA = folic acid, NAC = N-acetyl-cysteine.
Figure 10
Figure 10
Representative electron microscopy micrographs of the different experimental groups. (A) Normal ultrastructural morphology of myocardial cell from control vehicle rat. (B) Myocardial cells that show myofilaments disarray and numerous round (fission) mitochondria from FA-treated animals, the inset show double membrane cytoplasmic vacuoles that correspond to autophagosomes. (C) Myocardial cell rat from FA plus NAC animal show long (fusion) mitochondria. Counting of: (D) number of autophagosomes and (E) double membrane vacuoles attached to mitochondria (mitophagic) bodies per image; the electron microscopy images used for counting correspond to a size field of 100 μm. Data are mean ± SEM, n = 7. * p < 0.05, *** p < 0.001. FA = folic acid, NAC = N-acetyl-cysteine.
Figure 11
Figure 11
Mitochondrial biogenesis and mass markers. Western blot representative images and their densitometries of mitochondrial biogenesis protein: (A) SIRT1, (B) SIRT3, (C) PGC-1α, (D) NRF1, (E) NRF2, and (F) PPARγ. As well as mitochondrial proteins: (G) CPT1α, (H) ATP5A1, and (I) VDAC in heart homogenates. SIRT1 = sirtuin 1, SIRT3 = sirtuin 3, PGC-1α = peroxisome proliferator-activated receptor-gamma coactivator, NRF1 = nuclear respiratory factor 1, NRF2 = nuclear respiratory factor 2, PPARγ = peroxisome proliferator-activated receptor gamma, CPT1 = carnitine palmitoyltransferase 1A, ATP5A1 = ATP synthase subunit 5 A. Voltage-dependent anion channel (VDAC) and β-Actin were used as loading controls. FA = folic acid, NAC = N-acetyl-cysteine. Data are mean ± SEM, n = 3. * p < 0.05, ** p < 0.01, *** p < 0.001.
Figure 12
Figure 12
Mitophagy and autophagy markers. Western blot representative images and their densitometries of mitophagy: (A) PINK1, (B) PARKIN, and (C) BNIP3 in heart-isolated mitochondria. Counting corresponds to a size field of 100 μm. Data are mean ± SEM, n = 7. * p < 0.05, ** p < 0.01. BNIP3 immunohistochemistry in heart: (D) Control animal does not show BNIP3 immunoreactivity. (E) BNIP3 immunoreactivity can be seen in some myocardial cells of the FA group (black arrows). (F) FA + NAC rats do not show BNIP3 immunoreactivity in cardiac cells. (G) The p62 autophagy protein in heart homogenates. VDAC1 and β-Actin were used as a loading control. PINK1 = PTEN induced kinase 1, BNIP3 = BCL2 interacting protein 3, VDAC = voltage-dependent anion channel 1. FA = folic acid, NAC = N-acetyl-cysteine. Data are mean ± SEM, n = 3. * p < 0.05 and ** p < 0.01.
Figure 13
Figure 13
Integrative scheme. After its administration, FA induces AKI, favoring inflammatory and cell death processes in kidney segments like the proximal tubule. This triggers the release to the bloodstream of cardio-renal connectors, which can reach the heart cells. Thus, cardio-renal connector interaction with cardiac cells induces mitochondrial impairment by GSH and GSH + GSSH depletion in this organelle and CI and CII activity reduction, triggering a drop in ATP production and ΔΨm. Additionally, the complexes alteration in the mitochondrial heart triggers a H2O2 production increase, resulting in mitochondrial oxidative stress and a reduction in cardiolipin levels, which together with ΔΨm loss induce mitochondrial impairment in mitophagy flux, favoring mitochondrial damage accumulation and cell death induction. Likewise, mitochondrial ROS reduce SIRT1/3 levels inducing a reduction in mitochondrial biogenesis factors and decreasing mitochondrial proteins CPT1, ATP5A, and VDAC. Together, these alterations favor the energetic metabolic reprogramming in the heart. On the other hand, mitochondrial bioenergetic alterations and oxidative stress enhance the heart’s proinflammatory processes and cell death, ultimately leading to the CRS type 3 development in this model. In contrast, NAC pre-administration prevents inflammatory and cell death processes in kidney and cardio-renal connectors increase. NAC also prevents heart mitochondrial bioenergetics alliterations, preserving ATP and ΔΨm by CI activity and glutathione balance preservation, thus preventing the mitochondrial dynamics shift to fission and decreasing biogenesis and mitochondrial mass in the heart. By mitochondrial preservation, NAC administration prevented inflammatory and cell death markers in the heart and cardiac oxidative stress, thus preventing CRS type 3 development in FA-AKI. Aco = aconitase; AKI = acute kidney injury; ATP = adenosine triphosphate; ATP5A1 = ATP synthase subunit 5 A; BNP = brain natriuretic peptide; BUN = blood urea nitrogen; CI = Complex I; CII = Complex II; Cit Syn = citrate Synthase; CPT1 = carnitine palmitoyltransferase 1A, CK = creatine kinase; CRS = cardio-renal syndrome; FA = folic acid; GSH = reduced glutathione; GSSG = glutathione disulfide; H2O2 = hydrogen peroxide; NAC = N-acetyl-cysteine; NRF1 = nuclear respiratory factor 1; NRF2 = nuclear respiratory factor 2; OXPHOS = oxidative phosphorylation; PGC-1α = peroxisome proliferator-activated receptor-gamma coactivator; PPARγ = peroxisome proliferator-activated receptor gamma; ROS = reactive oxygen species; SIRT1 = sirtuin 1; SIRT3 = sirtuin 3; TNF-α = tumor necrosis factor-alpha; Trop C = troponin C; VDAC = voltage-dependent anion channel; ΔΨm = mitochondrial membrane potential.

Similar articles

Cited by

References

    1. Hoste E.A.J., Kellum J.A., Selby N.M., Zarbock A., Palevsky P.M., Bagshaw S.M., Goldstein S.L., Cerdá J., Chawla L.S. Global Epidemiology and Outcomes of Acute Kidney Injury. Nat. Rev. Nephrol. 2018;14:607–625. doi: 10.1038/s41581-018-0052-0. - DOI - PubMed
    1. Ronco C., Bellomo R., Kellum J.A. Acute Kidney Injury. Lancet. 2019;394:1949–1964. doi: 10.1016/S0140-6736(19)32563-2. - DOI - PubMed
    1. Kellum J.A., Romagnani P., Ashuntantang G., Ronco C., Zarbock A., Anders H.J. Acute Kidney Injury. Nat. Rev. Dis. Prim. 2021;7:52. doi: 10.1038/s41572-021-00284-z. - DOI - PubMed
    1. Fogo A.B., Cohen A.H., Colvin R.B., Jennette J.C., Alpers C.E. Fundamentals of Renal Pathology. 1st ed. Springer; Berlin/Heidelberg, German: 2014.
    1. Shafi T., Coresh J. Chronic Kidney Disease: Definition, Epidemiology, Cost, and Outcomes. In: Himmelfarb J., Sayegh M.H., editors. Chronic Kidney Disease, Dialysis, and Transplantation. Elsevier Inc.; Amsterdam, The Netherlands: 2010. pp. 3–21.

LinkOut - more resources