. 2023 Aug 15;12(8):1616.
doi: 10.3390/antiox12081616.

Peroxiredoxins Play an Important Role in the Regulation of Immunity and Aging in Drosophila

Affiliations

Peroxiredoxins Play an Important Role in the Regulation of Immunity and Aging in Drosophila

Olena Odnokoz et al. Antioxidants (Basel). .

Abstract

Aberrant immune responses and chronic inflammation can impose significant health risks and promote premature aging. Pro-inflammatory responses are largely mediated via reactive oxygen species (ROS) and reduction-oxidation reactions. A pivotal role in maintaining cellular redox homeostasis and the proper control of redox-sensitive signaling belongs to a family of antioxidant and redox-regulating thiol-related peroxidases designated as peroxiredoxins (Prx). Our recent studies in Drosophila have shown that Prxs play a critical role in aging and immunity. We identified two important 'hubs', the endoplasmic reticulum (ER) and mitochondria, where extracellular and intracellular stress signals are transformed into pro-inflammatory responses that are modulated by the activity of the Prxs residing in these cellular organelles. Here, we found that mitochondrial Prx activity in the intestinal epithelium is required to prevent the development of intestinal barrier dysfunction, which can drive systemic inflammation and premature aging. Using a redox-negative mutant, we demonstrated that Prx acts in a redox-dependent manner in regulating the age-related immune response. The hyperactive immune response observed in flies under-expressing mitochondrial Prxs is due to a response to abiotic signals but not to changes in the bacterial content. This hyperactive response, but not reduced lifespan phenotype, can be rescued by the ER-localized Prx.

Keywords: Drosophila; aging; endoplasmic reticulum; immunity; mitochondria; peroxiredoxin; reactive oxygen species; redox state.


Conflict of interest statement

The authors declare that the research was conducted in the absence of any commercial or financial relationship that could be construed as potential conflict of interest.

Figures

Figure 1
Figure 1
The effect of under-expression of mitochondrial dPrxs in the fat body (A) and in the midgut (B) on the life span of flies. dPrx3 was under-expressed in the dprx5 null background using the inducible S106-pSwitch-GAL4 (fat body) and NP1-GAL4 (midgut) drivers. For comparison, dPrx3 was under-expressed globally with the Da-Gal4 driver (DM, red dotted lines). (A) To activate the gene switch-inducible driver, S106 DM flies were fed food containing RU486 (experimental, fat-body DM), while control flies were fed food with ethanol (control), as described in Section 2. (B) DM—Double mutant under-expressing dPrx3 globally with Da-GAL4 driver; NP1 DM—double mutant under-expressing dPrx3 in the midgut; Control—NP1-GAL4 driver. Approximately 100–125 flies were used for each fly line in the experiment. Shown are representative data of two independent biological experiments, and similar results were obtained in a replicate experiment. A summary of the data is presented in Table 2. The fly lines and genotypes of the flies are described in detail in Table 1.
Figure 1
Figure 1
The effect of under-expression of mitochondrial dPrxs in the fat body (A) and in the midgut (B) on the life span of flies. dPrx3 was under-expressed in the dprx5 null background using the inducible S106-pSwitch-GAL4 (fat body) and NP1-GAL4 (midgut) drivers. For comparison, dPrx3 was under-expressed globally with the Da-Gal4 driver (DM, red dotted lines). (A) To activate the gene switch-inducible driver, S106 DM flies were fed food containing RU486 (experimental, fat-body DM), while control flies were fed food with ethanol (control), as described in Section 2. (B) DM—Double mutant under-expressing dPrx3 globally with Da-GAL4 driver; NP1 DM—double mutant under-expressing dPrx3 in the midgut; Control—NP1-GAL4 driver. Approximately 100–125 flies were used for each fly line in the experiment. Shown are representative data of two independent biological experiments, and similar results were obtained in a replicate experiment. A summary of the data is presented in Table 2. The fly lines and genotypes of the flies are described in detail in Table 1.
Figure 2
Figure 2
Effects of global under-expression of mitochondrial dPrxs on survivorship and development of the ‘smurf’ phenotype. The measurements were performed in the control, DM, and single (dprx3 and dprx5) mutant female (left) and male (right) flies (n = 125 for each group of flies). A number of flies with the ‘smurf’ phenotype were counted after feeding the flies with food containing the blue dye added to food. The percentage of dead and ‘smurf’ flies were normalized to the percent of life span for comparison between mutant and control flies. Statistically significant difference (p < 0.05) was observed between percent of DM total dead flies (DM, % dead) and DM dead flies that developed the ‘smurf’ phenotype (DM, % smurf). Differences between dead and ‘smurf’ flies in single dPrx mutants and control were not significant. Shown are representative data of two independent biological replicates. The results of biological replicate experiment are shown in Figure S4. The names of fly lines and genotypes of flies are described in Table 1.
Figure 3
Figure 3
Effects of under-expression of mitochondrial dPrxs in the midgut on survivorship and development of the ‘smurf’ phenotype. The measurements were performed in the NP1 DM and NP1 control female (A,C) and male (B,D) flies (n = 125). A number of flies with the ‘smurf’ phenotype were counted after feeding the flies with food containing the blue dye added to food. Percentage of the dead and ‘smurf’ flies is shown on the y axis as a function of physiological aging (% of life span, x axis). Shown are representative data of two independent biological replicates. Approximately 100–125 flies were used for each fly line. The results of the biological replicate experiment are shown in Figure S5. Percentage of dead and ‘smurf’ flies were scaled to chronological age (A,B) and normalized to percent of life span or physiological age (C,D). There was no statistically significant difference between dead and ‘smurf’ flies (p > 0.05). The names of fly lines and genotypes of flies are described in Table 1.
Figure 4
Figure 4
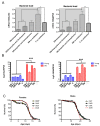
Effects of antibiotics on bacterial load (A), expression of AMPs (B), and life span (C) of the DM flies. Flies were maintained on regular food or food supplemented with tetracycline (T), a combination of ampicillin and chloramphenicol (AC), or a combination of doxycycline and gentamicin (DG). (A) Genomic DNA was isolated from 12-day-old DM and control (C) flies, and total bacterial load was determined using universal 16S rRNA primers. Results are means ± SEM of three replicates performed with two independent cohorts of flies (total n = 6). Results for DM flies with and without antibiotics are highlighted in gray. Asterisks denote statistically significant differences obtained in qPCR analysis (* p < 0.05; ** p < 0.005). (B) RNA was isolated from DM flies of two ages, 5–6 days (physiologically young) and 14–15 days (physiologically old, about 10% of fly death), and from 14-day old control flies (+/Da, dprx5, C), considered physiologically young. Results are means ± SEM of three replicates performed with two independent cohorts of flies (total n = 6). The two-way ANOVA test showed significant differences between physiologically young and old age (*** p < 0.0001). (C) Shown are data from one experiment with approximately 100–125 flies for each line. The results of the biological replicate from an independent cohort are shown in Figure S6. Statistical data are shown in Table S1. The DMs were kept on the standard food (DMR) and food supplemented with tetracycline (DMT), a combination of ampicillin and chloramphenicol (DMA), or a combination of doxycycline and gentamicin (DMD). The log-rank test did not show significant differences between fly groups.
Figure 5
Figure 5
AMP expression in young (10 days), middle-aged (30 days), and old (50 days) flies. AMPs tested were attacins (AttA, AttC, and AttD); defensin (Def); Diptericin (Dipt); drosocin (Dro); and cecropin C (CecC). Level of AMPs in driver control flies, dprx5 mutants (dprx5); and in flies expressing the dPrx5 transgene (Da > dPrx5) or its RN form (Da > RN) in the endogenous gene null background. Signals for each AMP were standardized against signals obtained for rp49 housekeeping gene and plotted on y axis. Results are means ± SEM of three replicates performed with two independent cohorts of flies (total n = 6). Asterisks denote statistically significant differences obtained in RT-PCR analysis between AMP levels in flies overexpressing wild type dPrx5 transgene and flies overexpressing the redox-negative form of dPrx5, dprx5 mutants, and control (* p < 0.05).
Figure 6
Figure 6
The role of ER and mitochondrial components in age-dependent induction of the immune-related genes. (A) Survivorship curves for females (left) and males (right). Shown are data from one experiment with approximately 100–125 flies for each line. The results of a biological replicate from an independent cohort are shown in Figure S7B. Statistically significant differences (p < 0.05) between survivorship curves were determined by the log-rank test (Table 3). (B) RT-PCR analysis of AMP expression in dPrx double and triple mutants at different ages. The age-dependent changes in Diptericin (left) and AttAB (right) expression levels. The genotypes of flies are described in Table 1. All groups of flies were collected at different ages, as indicated in Table S2. Results are means ± SEM of two replicates performed with three independent cohorts of female flies (total n = 6). The statistically significant differences in age-specific changes in the levels of Dipt and AttAB between the DM, TM, and corresponding controls were determined by analysis of the slopes of corresponding regression lines (Table 4). (C) RT-PCR analysis of Diptericin expression in dPrx male mutants at different ages. Left: changes in mRNA levels in the double dprx3,dprx5 mutant (DM), dprx4,dprx3,dprx5 triple mutant (TM), and Da driver control; right: changes are scaled to physiological aging displayed as % of life span. Shown are representative data from one experiment with male flies (n = 3).
Figure 6
Figure 6
The role of ER and mitochondrial components in age-dependent induction of the immune-related genes. (A) Survivorship curves for females (left) and males (right). Shown are data from one experiment with approximately 100–125 flies for each line. The results of a biological replicate from an independent cohort are shown in Figure S7B. Statistically significant differences (p < 0.05) between survivorship curves were determined by the log-rank test (Table 3). (B) RT-PCR analysis of AMP expression in dPrx double and triple mutants at different ages. The age-dependent changes in Diptericin (left) and AttAB (right) expression levels. The genotypes of flies are described in Table 1. All groups of flies were collected at different ages, as indicated in Table S2. Results are means ± SEM of two replicates performed with three independent cohorts of female flies (total n = 6). The statistically significant differences in age-specific changes in the levels of Dipt and AttAB between the DM, TM, and corresponding controls were determined by analysis of the slopes of corresponding regression lines (Table 4). (C) RT-PCR analysis of Diptericin expression in dPrx male mutants at different ages. Left: changes in mRNA levels in the double dprx3,dprx5 mutant (DM), dprx4,dprx3,dprx5 triple mutant (TM), and Da driver control; right: changes are scaled to physiological aging displayed as % of life span. Shown are representative data from one experiment with male flies (n = 3).

Similar articles

Cited by

References

    1. Hearps A.C., Martin G.E., Angelovich T.A., Cheng W.J., Maisa A., Landay A.L., Jaworowski A., Crowe S.M. Aging is associated with chronic innate immune activation and dysregulation of monocyte phenotype and function. Aging Cell. 2012;11:867–875. doi: 10.1111/j.1474-9726.2012.00851.x. - DOI - PubMed
    1. Le Saux S., Weyand C.M., Goronzy J.J. Mechanisms of immunosenescence: Lessons from models of accelerated immune aging. Ann. N. Y Acad. Sci. 2012;1247:69–82. doi: 10.1111/j.1749-6632.2011.06297.x. - DOI - PMC - PubMed
    1. Zanini G., Selleri V., Lopez Domenech S., Malerba M., Nasi M., Mattioli A.V., Pinti M. Mitochondrial DNA as inflammatory DAMP: A warning of an aging immune system? Biochem. Soc. Trans. 2023;51:735–745. doi: 10.1042/BST20221010. - DOI - PubMed
    1. Asri R.M., Salim E., Nainu F., Hori A., Kuraishi T. Sterile induction of innate immunity in Drosophila melanogaster. Front. Biosci. 2019;24:1390–1400. doi: 10.2741/4786. - DOI - PubMed
    1. Shaukat Z., Liu D.W., Gregory S. Sterile Inflammation in Drosophila. Mediat. Inflamm. 2015;2015:369286. doi: 10.1155/2015/369286. - DOI - PMC - PubMed

LinkOut - more resources