. 2023 Aug 19;12(8):1639.
doi: 10.3390/antiox12081639.

Integrated Multi-Omics Analysis for Inferring Molecular Players in Inclusion Body Myositis

Affiliations

Integrated Multi-Omics Analysis for Inferring Molecular Players in Inclusion Body Myositis

Judith Cantó-Santos et al. Antioxidants (Basel). .

Abstract

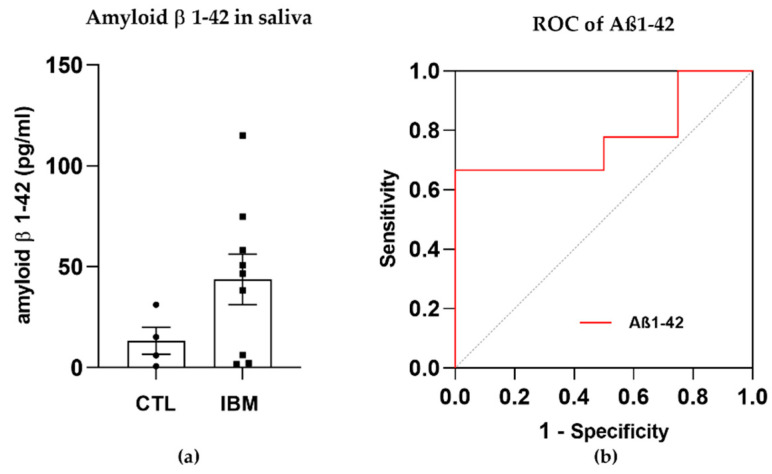
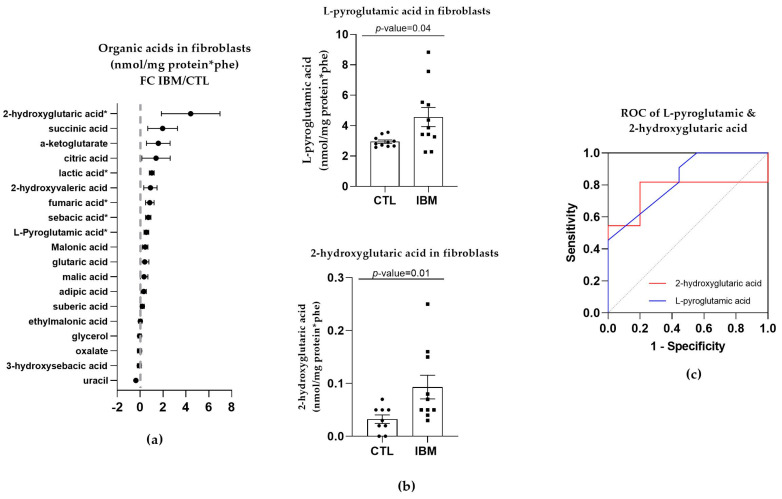
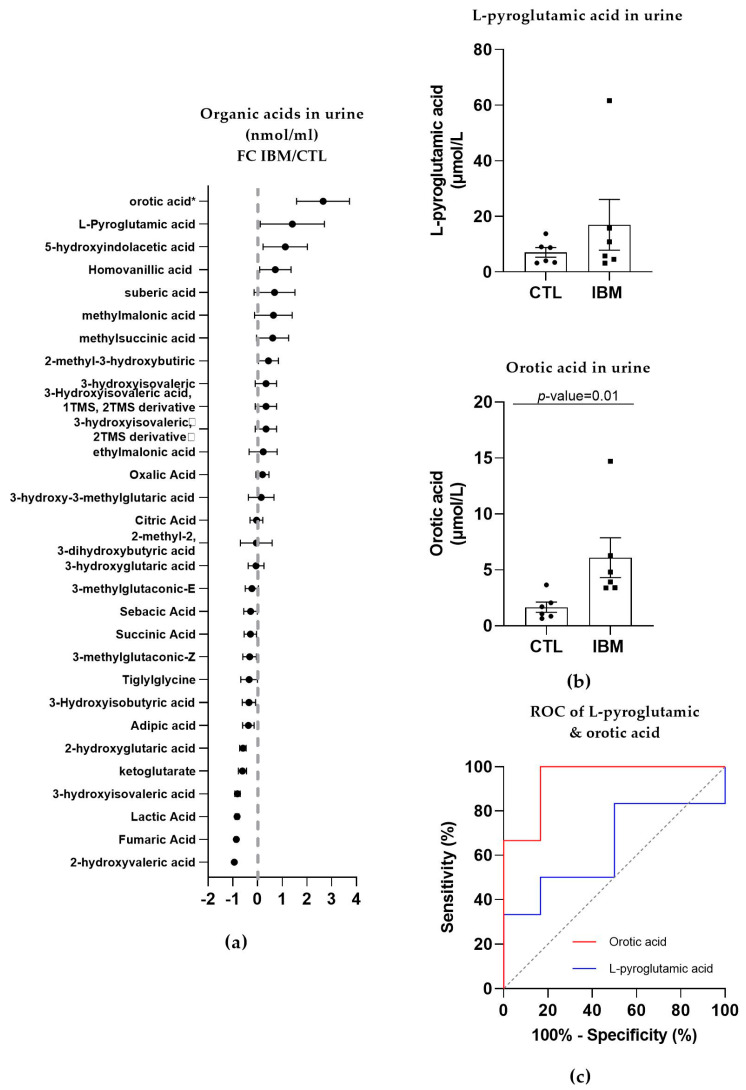
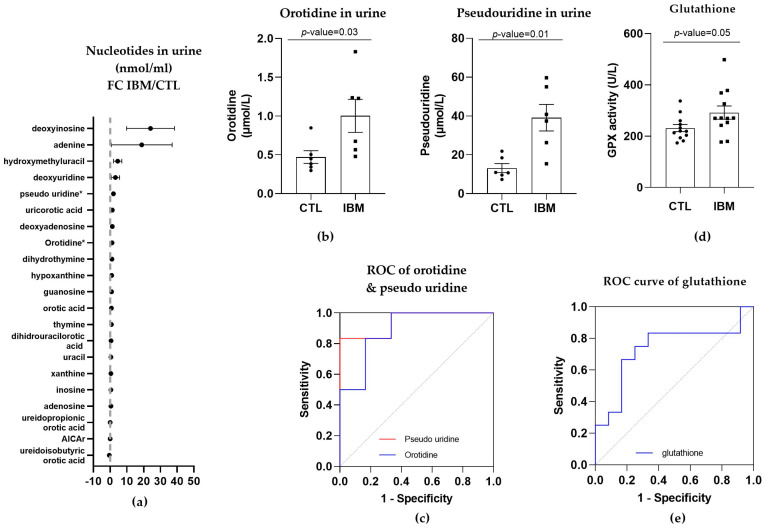
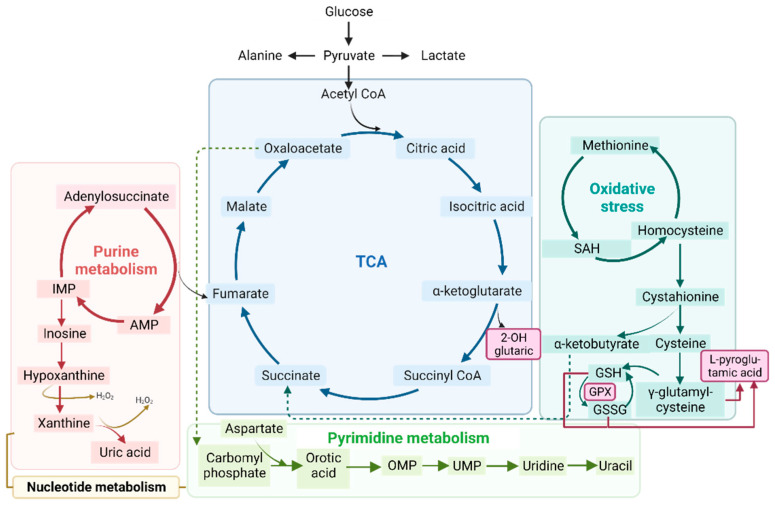
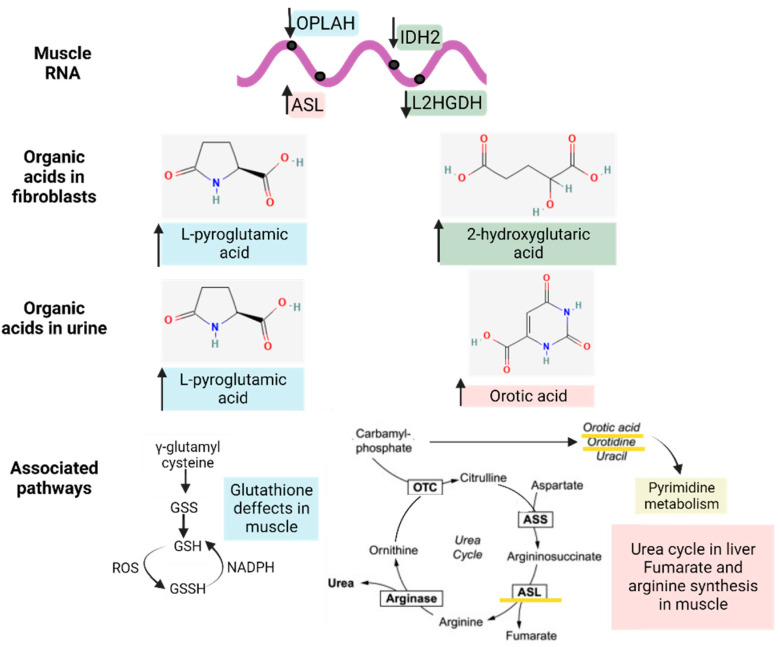
Inclusion body myositis (IBM) is an acquired inflammatory myopathy affecting proximal and distal muscles that leads to weakness in patients over 50. It is diagnosed based on clinical and histological findings in muscle related to inflammation, degeneration, and mitochondria. In relation to IBM, a shortage of validated disease models and a lack of biomarkers and effective treatments constitute an unmet medical need. To overcome these hurdles, we performed an omics analysis of multiple samples from IBM patients (saliva, fibroblasts, urine, plasma, and muscle) to gain insight into the pathophysiology of IBM. Degeneration was evident due to the presence of amyloid β peptide 1-42 (Aβ1-42) in the saliva of the analyzed IBM patients. The presence of metabolic disarrangements in IBM was indicated by an imbalanced organic acid profile in fibroblasts and urine. Specifically, abnormal levels of L-pyroglutamic and orotic acid were supported by the abnormal expression of related metabolites in plasma and urine (glutathione and pyrimidines) and the aberrant expression of upstream gene regulators (L2HGDH, IDH2, OPLAH, and ASL) in muscle. Combined levels of L-pyroglutamic and orotic acid displayed an outstanding biomarker signature in urine with 100% sensitivity and specificity. The confirmation of systemic metabolic disarrangements in IBM and the identification of novel biomarkers reported herein unveil novel insights that require validation in larger cohorts.

Keywords: biomarker; inclusion body myositis (IBM); metabolism; nucleotides; organic acids.


Conflict of interest statement

The authors declare no conflict of interest. The funders had no role in the design of the study; in the collection, analyses, or interpretation of data; in the writing of the manuscript, or in the decision to publish the results.

Figures

Figure 1
Figure 1
Amyloid β peptide 1–42 (Aβ1–42) in saliva samples. (a) Bar graphs of the concentration of Aβ1–42 in inclusion body myositis (IBM) vs. control (CTL) samples. (b) Receiver operating characteristic (ROC) curve and area under the ROC curve (AUC) of Aβ1–42 (AUC = 0.78 ± 0.13. p-value = 0.12), yielding sensitivity and specificity scores of 66.70% and 50.00%, respectively. Higher Aβ1–42 concentrations and high AUC scores in the IBM group suggested that this peptide could aid in discriminating between cohorts.
Figure 2
Figure 2
Organic acid profiles in inclusion body myositis (IBM) vs. control (CTL) fibroblasts (n = 11 vs. 10). (a) Fold change (FC) of the concentration of organic acids in IBM vs. CTL fibroblasts (* p-value < 0.05). (b) Bar graph of L-pyroglutamic and 2-hydroxyvaleric acids (p-value < 0.05). (c) Receiver operating characteristic (ROC) curve and area under the ROC curve (AUC) of L-pyroglutamic (AUC = 0.79 ± 0.12. p-value = 0.03) and 2-hydroxyvaleric acids (AUC = 0.84 ± 0.09. p-value = 0.01). Their sensitivity and specificity values are 72.7% and 80% for L-pyroglutamic acid and 72.70% and 77.80% for 2-hydroxy glutaric acid. All the organic acids presented increased concentrations in the IBM vs. CTL fibroblasts, among which L-pyroglutamic and 2-hydroxy glutaric acids were the most remarkable, with the former being associated with glutathione synthesis and the latter with the TCA cycle.
Figure 3
Figure 3
Organic acid profiles in the urine of inclusion body myositis (IBM) vs. control (CTL) samples (n = 6/group). (a) Fold change (FC) of the concentration of organic acids in the urine of lBM vs. CTLs. (b) Bar graphs of L-pyroglutamic and orotic acids (p-value < 0.05). (c) Receiver operating characteristic (ROC) curve and area under the ROC curve (AUC) of L-pyroglutamic (AUC = 0.64 ± 0.17. p-value = 0.42) and orotic acids (AUC = 0.94 ± 0.07. p-value = 0.01). Their sensitivity and specificity values are 50.0% and 83.3% for L-pyroglutamic acid and 100.0% and 83.3% for orotic acid, but these values changed to 100% sensitivity and specificity when both acids were tested together. The presence of altered organic acids in urine corroborated the imbalanced organic acid profile in fibroblasts and highlights L-pyroglutamic and orotic acid as potential fluid biomarkers.
Figure 4
Figure 4
Nucleotides in urine and glutathione in plasma of inclusion body myositis (IBM) vs. control (CTL) samples (n = 6/group). (a) Fold change (FC) of the concentration of nucleotides in urine of IBM patients vs. CTLs. (b) Bar graphs of orotidine and pseudo-uridine (p-value < 0.05). (c) Receiver operating characteristic (ROC) curve and area under the ROC curve (AUC) of orotidine (AUC = 0.89 ± 0.10. p-value = 0.02) and pseudo-uridine (AUC = 0.94 ± 0.07. p-value = 0.01). Their sensitivity and specificity values are 66.7% and 83.3% for orotidine and 83.3% for both in pseudo-uridine. (d) Glutathione peroxidase (GPX) activity in IBM vs. CTL plasma samples (p-value = 0.05). (e) Receiver Operating Characteristic (ROC) curve and area under the ROC curve (AUC) of GPX (AUC = 0.74 ± 0.11, p-value = 0.05), with 66.7% sensitivity and 75.0% specificity. Almost all nucleotides were present in higher concentrations in the urine isolated from the IBM patients, with orotidine and pseudo-uridine being statistically significant, thereby corroborating the altered orotic acid biosynthesis previously observed. GPX activity was also higher in the IBM patients, suggesting increased glutathione redox system activity associated with oxidative stress.
Figure 5
Figure 5
Schematic representation of the tricarboxylic acid cycle (TCA) (in blue), purine (in red) and pyrimidine (in green) metabolism (both part of nucleotide metabolism), and oxidative stress (in turquoise). All of these processes are related to the metabolic profile examined in the organic acid, nucleotide, and RNA seq analyses. Abbreviations: IMP: inosine monophosphate; AMP: adenosine monophosphate; OMP: orotate monophosphate; UMP: uridine 5’-monophosphate; SAH: S-adenosylhomocysteine; GSH: glutathione; GSSG: glutathione disulfide; GPX: glutathione peroxidase.
Figure 6
Figure 6
Metabolic pathways in the muscle RNA-seq of inclusion body myositis (IBM) patients vs. controls (CTLs). Each pathway is represented with a different color with the genes unique to that pathway (domes) and the interactions of genes across pathways (chords). Wider domes and chords represent a higher number of genes. Among them, carbohydrate metabolism and metals and cofactors, with 56.8% and 52.8% of DEGs involved, were the most affected metabolic pathways (Table S2). Overall, these data support the notion of functional metabolic deregulation at the gene expression level and confirm the relevance of metabolic deregulation in relation to this disease.
Figure 7
Figure 7
Interactome of the metabolic differentially expressed genes (DEGs) in muscle related to the significantly altered organic acid patterns (in fibroblasts and urine) and their associated pathways. The arrows next to the genes and metabolites refer to their increased or decreased expression in IBM samples. The different colors (blue, green, and pink) indicate the upstream (genes) and downstream (organic acids and nucleotides) effectors of each pathway.

References

    1. Nagy S., Khan A., Machado P.M., Houlden H. Inclusion Body Myositis: From Genetics to Clinical Trials. J. Neurol. 2023;270:1787–1797. doi: 10.1007/s00415-022-11459-3. - DOI - PMC - PubMed
    1. Callan A., Capkun G., Vasanthaprasad V., Freitas R., Needham M. A Systematic Review and Meta-Analysis of Prevalence Studies of Sporadic Inclusion Body Myositis. J. Neuromuscul. Dis. 2017;4:127–137. doi: 10.3233/JND-160198. - DOI - PubMed
    1. Greenberg S.A. Inclusion Body Myositis: Clinical Features and Pathogenesis. Nat. Rev. Rheumatol. 2019;15:257–272. doi: 10.1038/s41584-019-0186-x. - DOI - PubMed
    1. Naddaf E., Shelly S., Mandrekar J., Chamberlain A.M., Hoffman E.M., Ernste F.C., Liewluck T. Survival and Associated Comorbidities in Inclusion Body Myositis. Rheumatology. 2022;61:2016–2024. doi: 10.1093/rheumatology/keab716. - DOI - PMC - PubMed
    1. Buzkova J., Nikkanen J., Ahola S., Hakonen A.H., Sevastianova K., Hovinen T., Yki-Järvinen H., Pietiläinen K.H., Lönnqvist T., Velagapudi V., et al. Metabolomes of Mitochondrial Diseases and Inclusion Body Myositis Patients: Treatment Targets and Biomarkers. EMBO Mol. Med. 2018;10:9091. doi: 10.15252/emmm.201809091. - DOI - PMC - PubMed

LinkOut - more resources