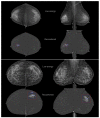
AI-Based Cancer Detection Model for Contrast-Enhanced Mammography
- PMID: 37627859
- PMCID: PMC10451612
- DOI: 10.3390/bioengineering10080974
AI-Based Cancer Detection Model for Contrast-Enhanced Mammography
Abstract
Background: The recent development of deep neural network models for the analysis of breast images has been a breakthrough in computer-aided diagnostics (CAD). Contrast-enhanced mammography (CEM) is a recent mammography modality providing anatomical and functional imaging of the breast. Despite the clinical benefits it could bring, only a few research studies have been conducted around deep-learning (DL) based CAD for CEM, especially because the access to large databases is still limited. This study presents the development and evaluation of a CEM-CAD for enhancing lesion detection and breast classification.
Materials & methods: A deep learning enhanced cancer detection model based on a YOLO architecture has been optimized and trained on a large CEM dataset of 1673 patients (7443 images) with biopsy-proven lesions from various hospitals and acquisition systems. The evaluation was conducted using metrics derived from the free receiver operating characteristic (FROC) for the lesion detection and the receiver operating characteristic (ROC) to evaluate the overall breast classification performance. The performances were evaluated for different types of image input and for each patient background parenchymal enhancement (BPE) level.
Results: The optimized model achieved an area under the curve (AUROC) of 0.964 for breast classification. Using both low-energy and recombined image as inputs for the DL model shows greater performance than using only the recombined image. For the lesion detection, the model was able to detect 90% of all cancers with a false positive (non-cancer) rate of 0.128 per image. This study demonstrates a high impact of BPE on classification and detection performance.
Conclusion: The developed CEM CAD outperforms previously published papers and its performance is comparable to radiologist-reported classification and detection capability.
Keywords: breast cancer; cancer detection; computer aided detection; contrast-enhanced mammography; deep learning.
Conflict of interest statement
The authors declare no conflict of interest.
Figures


References
-
- Zhou S., Greenspan H., Shen D. Deep Learning for Medical Image Analysis. Academic Press; Cambridge, MA, USA: 2017.
LinkOut - more resources
Full Text Sources
Miscellaneous

