

Study of the Relationship between Pulmonary Artery Pressure and Heart Valve Vibration Sound Based on Mock Loop
- PMID: 37627870
- PMCID: PMC10451642
- DOI: 10.3390/bioengineering10080985
Study of the Relationship between Pulmonary Artery Pressure and Heart Valve Vibration Sound Based on Mock Loop
Abstract
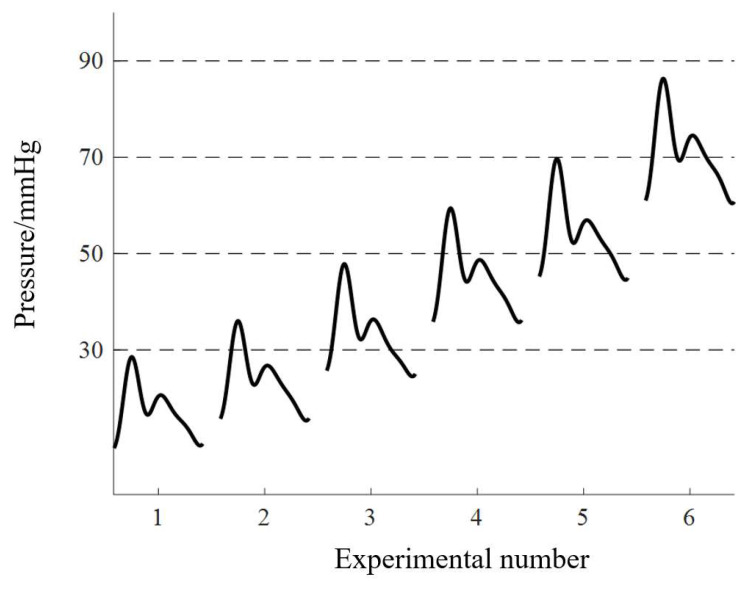
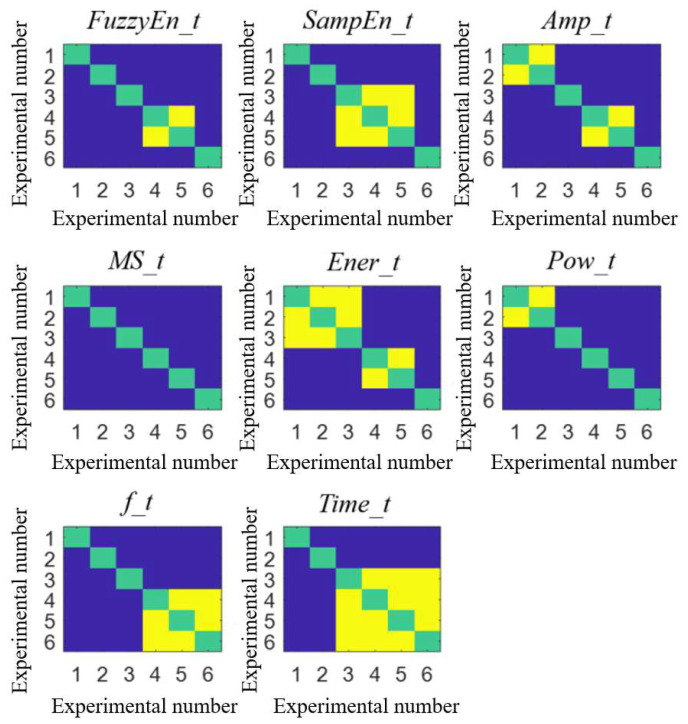
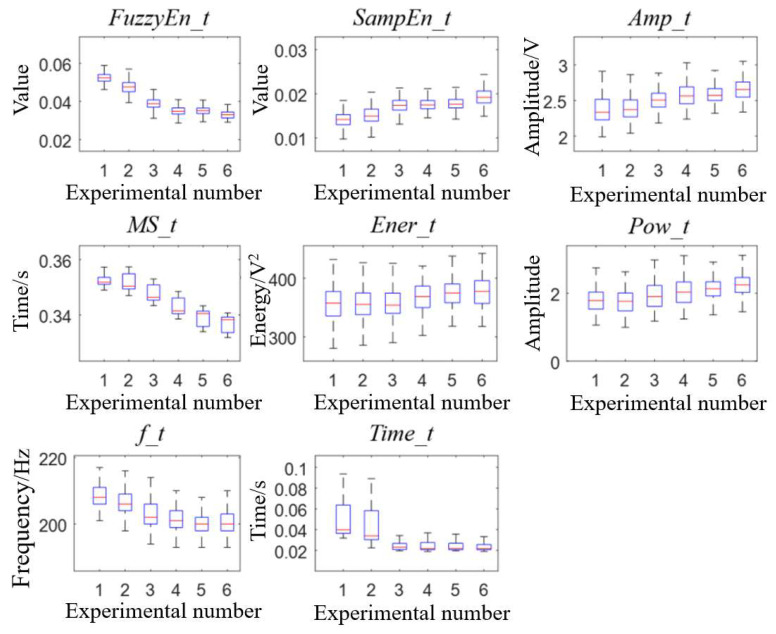
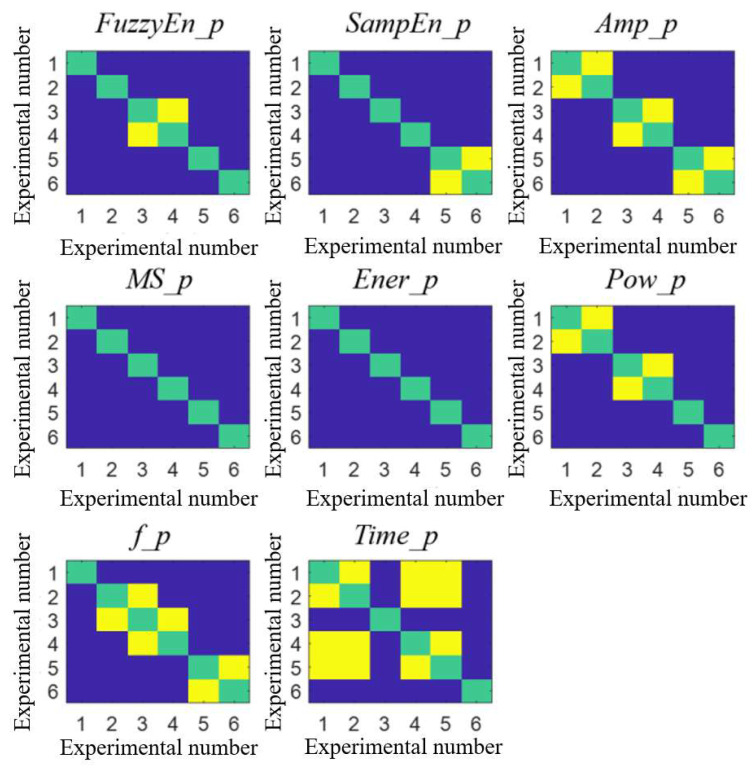
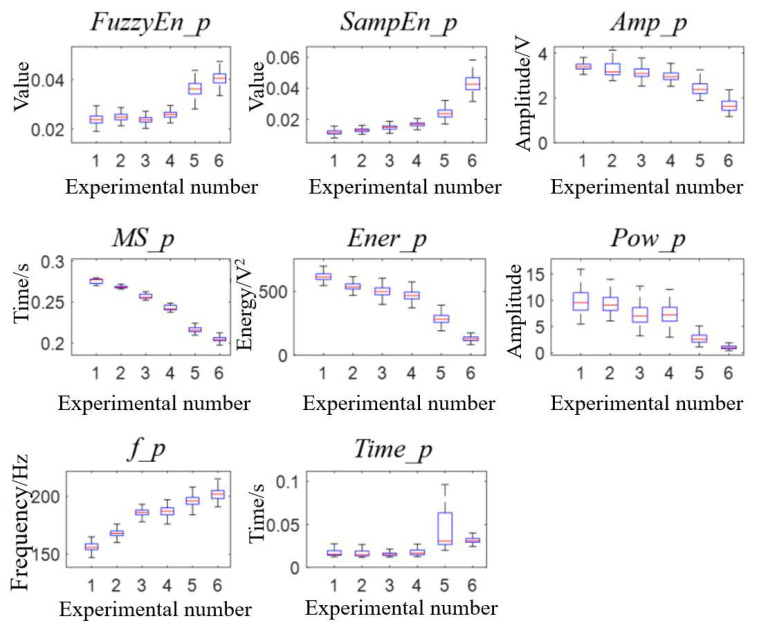
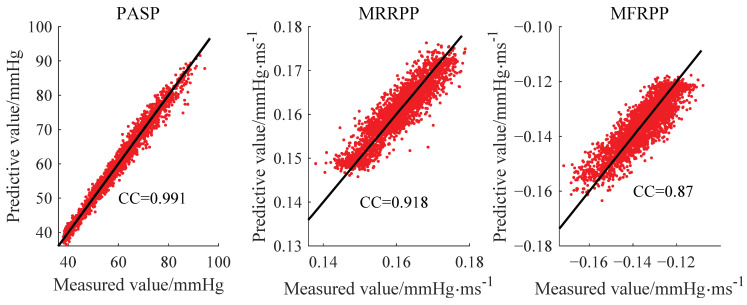
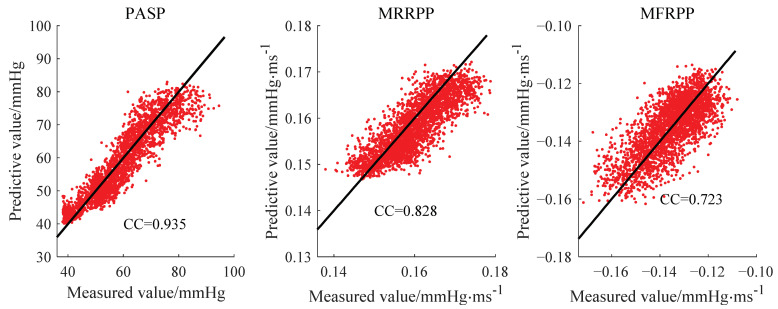
The vibration of the heart valves' closure is an important component of the heart sound and contains important information about the mechanical activity of a heart. Stenosis of the distal pulmonary artery can lead to pulmonary hypertension (PH). Therefore, in this paper, the relationship between the vibration sound of heart valves and the pulmonary artery blood pressure was investigated to contribute to the noninvasive detection of PH. In this paper, a lumped parameter circuit platform of pulmonary circulation was first set to guide the establishment of a mock loop of circulation. By adjusting the distal vascular resistance of the pulmonary artery, six different pulmonary arterial pressure states were achieved. In the experiment, pulmonary artery blood pressure, right ventricular blood pressure, and the vibration sound of the pulmonary valve and tricuspid valve were measured synchronously. Features of the time domain and frequency domain of two valves' vibration sound were extracted. By conducting a significance analysis of the inter-group features, it was found that the amplitude, energy and frequency features of vibration sounds changed significantly. Finally, the continuously varied pulmonary arterial blood pressure and valves' vibration sound were obtained by continuously adjusting the resistance of the distal pulmonary artery. A backward propagation neural network and deep learning model were used, respectively, to estimate the features of pulmonary arterial blood pressure, pulmonary artery systolic blood pressure, the maximum rising rate of pulmonary artery blood pressure and the maximum falling rate of pulmonary artery blood pressure by the vibration sound of the pulmonary and tricuspid valves. The results showed that the pulmonary artery pressure parameters can be well estimated by valve vibration sounds.
Keywords: backward propagation neural network; heart valve vibration sound; mock loop circulation; pulmonary artery pressure; pulmonary hypertension.
Conflict of interest statement
The authors declare no potential conflict of interest with respect to the research, authorship and/or publication of this article.
Figures
Similar articles
-
Model-based analysis of effects of systolic blood pressure on frequency characteristics of the second heart sound.Conf Proc IEEE Eng Med Biol Soc. 2006;2006:2888-91. doi: 10.1109/IEMBS.2006.259859. Conf Proc IEEE Eng Med Biol Soc. 2006. PMID: 17946534
-
Complete right bundle-branch block: echophonocardiographic study of first heart sound and right ventricular contraction times.Br Heart J. 1979 Jun;41(6):637-46. doi: 10.1136/hrt.41.6.637. Br Heart J. 1979. PMID: 465238 Free PMC article.
-
A new method for quantitative evaluation of perceived sounds from mechanical heart valve prostheses.Proc Inst Mech Eng H. 2000;214(1):121-8. doi: 10.1243/0954411001535291. Proc Inst Mech Eng H. 2000. PMID: 10718056 Clinical Trial.
-
Etiology of pure tricuspid regurgitation.Cardiovasc Clin. 1987;17(2):53-95. Cardiovasc Clin. 1987. PMID: 3536106 Review.
-
The First Heart Sound.In: Walker HK, Hall WD, Hurst JW, editors. Clinical Methods: The History, Physical, and Laboratory Examinations. 3rd edition. Boston: Butterworths; 1990. Chapter 22. In: Walker HK, Hall WD, Hurst JW, editors. Clinical Methods: The History, Physical, and Laboratory Examinations. 3rd edition. Boston: Butterworths; 1990. Chapter 22. PMID: 21250175 Free Books & Documents. Review.
Cited by
-
Deep Learning in Heart Sound Analysis: From Techniques to Clinical Applications.Health Data Sci. 2024 Oct 9;4:0182. doi: 10.34133/hds.0182. eCollection 2024. Health Data Sci. 2024. PMID: 39387057 Free PMC article. Review.
References
-
- Kayikcioglu M., Kultursay H. Seven years of experience in patients with pulmonary arterial hypertension in Ege University Hospital: Diagnostic approach of a single center. Anatol. J. Cardiol. 2008;8:279–285. - PubMed
-
- Chan W., Woldeyohannes M., Colman R., Arand P., Michaels A.D., Parker J.D., Granton J.T., Mark S. Haemodynamic and structural correlates of the first and second heart sounds in pulmonary arterial hypertension: An acoustic cardiography cohort study. BMJ Open. 2013;3:e002660. doi: 10.1136/bmjopen-2013-002660. - DOI - PMC - PubMed
Grants and funding
LinkOut - more resources
Full Text Sources
