. 2023 Jul 31;14(8):1567.
doi: 10.3390/genes14081567.

Amplicon-Based Microbiome Profiling: From Second- to Third-Generation Sequencing for Higher Taxonomic Resolution

Affiliations

Amplicon-Based Microbiome Profiling: From Second- to Third-Generation Sequencing for Higher Taxonomic Resolution

Elisabetta Notario et al. Genes (Basel). .

Abstract

The 16S rRNA amplicon-based sequencing approach represents the most common and cost-effective strategy with great potential for microbiome profiling. The use of second-generation sequencing (NGS) technologies has led to protocols based on the amplification of one or a few hypervariable regions, impacting the outcome of the analysis. Nowadays, comparative studies are necessary to assess different amplicon-based approaches, including the full-locus sequencing currently feasible thanks to third-generation sequencing (TGS) technologies. This study compared three different methods to achieve the deepest microbiome taxonomic characterization: (a) the single-region approach, (b) the multiplex approach, covering several regions of the target gene/region, both based on NGS short reads, and (c) the full-length approach, which analyzes the whole length of the target gene thanks to TGS long reads. Analyses carried out on benchmark microbiome samples, with a known taxonomic composition, highlighted a different classification performance, strongly associated with the type of hypervariable regions and the coverage of the target gene. Indeed, the full-length approach showed the greatest discriminating power, up to species level, also on complex real samples. This study supports the transition from NGS to TGS for the study of the microbiome, even if experimental and bioinformatic improvements are still necessary.

Keywords: 16S rRNA amplicon-based sequencing; metagenomics; microbiome; mock analysis; next-generation sequencing; third-generation sequencing.


Conflict of interest statement

N.T. is employed as a scientist by Postbiotica S.r.l. M.R. is one of the founders of Postbiotica S.r.l. M.R. is chief scientific officer of Postbiotica. The authors declare no conflict of interest.

Figures
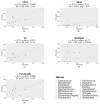
Figure 1
Figure 1
Correlation between the expected and observed 16S rRNA relative abundances (%) at the genus level for each sequencing approach. Correlation for (a) the V3V4 region; (b) the V5V6 region; (c) the V4 region; (d) the multiplex approach; (e) the full-length approach. For each method, the adjusted R2, linear model coefficient (coef.), Pearson correlation coefficient (r), and p-value are shown.
Figure 2
Figure 2
Correlation between the expected and observed 16S rRNA relative abundances (%) at the species level for each sequencing approach. (a) Correlation for the V3V4 region; (b) correlation for the V5V6 region; (c) correlation for the V4 region; (d) correlation for the multiplex approach; (e) correlation for the full-length approach. For each method, the adjusted R2, linear model coefficient (coef.), Pearson correlation coefficient (r), and p-value are shown.
Figure 3
Figure 3
Rarefaction curves of sequencing data. The figure shows the rarefaction curves of (a) V3V4 sequencing data with a threshold of 100,000 sequences; (b) multiplex sequencing data with a threshold of 52,000 sequences; (c) full-length sequencing data with a threshold of 7427 sequences. In brown are shown the rarefaction curves of feces samples, whereas in blue are shown the rarefaction curves of intestinal content samples.
Figure 4
Figure 4
Box plot of α diversity indices calculated for each sequencing method. (a) α diversity measured using the inverse Simpson index. (b) α diversity measured using Pielou’s evenness index. α diversity scores were calculated by using rarefied ASV counts for each approach. Box plots and points represent the overall data distribution and single samples, respectively. Yellow: full-length approach; violet: multiplex approach; water-green: V3V4 approach. The group means comparison was performed by using the paired Student’s t-test (“**”: p-value < 0.01; “***”: p-value < 0.001; “****”: p-value < 0.0001).
Figure 5
Figure 5
Box plot of α diversity indices calculated for each sequencing method at genus-level counts. (a) α diversity measured using the inverse Simpson index. (b) α diversity measured using Pielou’s evenness index. α diversity scores were calculated by using rarefied genus-level counts for each approach. Box plots and points represent the overall data distribution and samples, respectively. Yellow: full-length approach; violet: multiplex approach; water-green: V3V4 approach. The group means comparison was performed by using the paired Student’s t-test (“ns”: p-value > 0.05; “***”: p-value < 0.001; “****”: p-value < 0.0001).
Figure 6
Figure 6
PCoA plot for taxonomic-level data. The figure shows the β diversity at different taxonomic levels, from phylum (a) to family (b), genus (c), and species (d) levels (Aitchison distance, using CLR-transformed sample abundances). Point colors represent the three sequencing method sets: the full-length approach in yellow; the multiplex approach in violet; the V3V4 approach in water-green, respectively.
Figure 7
Figure 7
Venn diagrams using filtered taxa with relative abundance ≥ 1%. Circular colors represent the three sequencing method sets: the full-length approach in yellow; the multiplex approach in violet; the V3V4 approach in water-green, respectively. Shared taxa are represented as overlapping circles with merged colors.
Figure 8
Figure 8
Donut charts of the taxonomic assignments at different taxonomic levels. For each sequencing method, single-region (V3V4), multiplex (MPX), and full-length (FL), the taxonomic assignments and the average relative abundances at phylum, family, genus, and species levels are plotted. Taxa with relative abundances < 1% are collapsed into “Others”.
Figure 9
Figure 9
The differential abundance analysis at phylum and species levels of each sequencing method. Statistically significant differences are considered for log fold change (lfc) > |1| and adjusted p-value < 0.001. The pairwise comparison is performed between V3V4 vs full-length; V3V4 vs multiplex; full-length vs multiplex. The lfc value may be positive or negative if the taxa increase or decrease in the first group, respectively, compared to the second one.

References

    1. Berg G., Rybakova D., Fischer D., Cernava T., Vergès M.-C.C., Charles T., Chen X., Cocolin L., Eversole K., Corral G.H., et al. Microbiome Definition Re-Visited: Old Concepts and New Challenges. Microbiome. 2020;8:103. doi: 10.1186/s40168-020-00875-0. - DOI - PMC - PubMed
    1. Malard F., Dore J., Gaugler B., Mohty M. Introduction to Host Microbiome Symbiosis in Health and Disease. Mucosal. Immunol. 2021;14:547–554. doi: 10.1038/s41385-020-00365-4. - DOI - PMC - PubMed
    1. Durack J., Lynch S.V. The Gut Microbiome: Relationships with Disease and Opportunities for Therapy. J. Exp. Med. 2019;216:20–40. doi: 10.1084/jem.20180448. - DOI - PMC - PubMed
    1. Thomas A.M., Segata N. Multiple Levels of the Unknown in Microbiome Research. BMC Biol. 2019;17:48. doi: 10.1186/s12915-019-0667-z. - DOI - PMC - PubMed
    1. Pérez-Cobas A.E., Gomez-Valero L., Buchrieser C. Metagenomic Approaches in Microbial Ecology: An Update on Whole-Genome and Marker Gene Sequencing Analyses. Microb. Genom. 2020;6 doi: 10.1099/mgen.0.000409. - DOI - PMC - PubMed

Publication types

Substances

LinkOut - more resources