. 2023 Aug 17;14(8):1638.
doi: 10.3390/genes14081638.

Exploring the Binding Affinity of the ARR2 GARP DNA Binding Domain via Comparative Methods

Affiliations

Exploring the Binding Affinity of the ARR2 GARP DNA Binding Domain via Comparative Methods

Janine Rieger et al. Genes (Basel). .

Abstract

Plants have evolved signaling mechanisms such as the multi-step phosphorelay (MSP) to respond to different internal and external stimuli. MSP responses often result in gene transcription regulation that is modulated through transcription factors such as B-type Arabidopsis response regulator (ARR) proteins. Among these proteins, ARR2 is a key component that is expressed ubiquitously and is involved in many aspects of plant development. Although it has been noted that B-type ARRs bind to their cognate genes through a DNA-binding domain termed the GARP domain, little is known about the structure and function of this type of DNA-binding domain; thus, how ARRs bind to DNA at a structural level is still poorly understood. In order to understand how the MSP functions in planta, it is crucial to unravel both the kinetics as well as the structural identity of the components involved in such interactions. For this reason, this work focusses on resolving how the GARP domain of ARR2 (GARP2) binds to the promoter region of ARR5, one of its native target genes in cytokinin signaling. We have established that GARP2 specifically binds to the ARR5 promoter with three different bi-molecular interaction systems-qDPI-ELISA, FCS, and MST-and we also determined the KD of this interaction. In addition, structural modeling of the GARP2 domain confirms that GARP2 entails a HTH motif, and that protein-DNA interaction most likely occurs via the α3-helix and the N-terminal arm of this domain since mutations in this region hinder ARR2's ability to activate transcription.

Keywords: ARR2; DPI-ELISA; FCS; GARP; MST; reporter gene; structural modeling; transcription factor.


Conflict of interest statement

The authors declare no conflict of interest.

Figures

Figure 1
Figure 1
Schematic of the GARP2 domain and DNA target sites used in this work. (A) Scheme of the ARR2 protein and its three major domains: receiver domain (light blue); acidic domain (lime); GARP domain (purple); and P/Q domain (grey). The JPred secondary structural prediction for the entire ARR2 protein is shown with an enlarged view of the GARP2 domain showing a β-sheet (pink) and three α-helices (blue). Putative GARP2 NLS is underlined. (B) Scheme of the GARP2–eGFP and His–MBP–GARP2 fusion proteins generated in this work: GARP2 (purple); 8xHis Tag (red); eGFP (green); and MBP (brown) (C) Transient expression of GARP2–eGFP (G2) in tobacco leaves as descri bed in Veerabagu et al. [53] (D) Transactivation assay of ARR5p::LUCm3 promoter fragments (see E) with ARR2 as effector after cytokinin (red) or mock (blue) treatments. The grey bar represents the flash measurement prior to cytokinin addition. The black arrow marks the time point of hormone application. Light emission is given as relative LUC activity (RLU). The lighter area around the curves represents the standard error calculated from four technical replicates. (E) Schematic of the ARR5 promoter region (5′→3′) containing putative B-type ARR CRM recognition sites (A/G)GAT(T/C) (blue bars) and ECRM motifs AAGAT(T/C)TT (orange bars); top bars have sense and bottom bars have antisense orientation. The region chosen for in vitro analyses is circled and its sequence given to the right: wild-type sequence (wtOligo) and the mutated sequence (mutOligo). The various ARR5 promoter fragments used in D are shown as blue arrows.
Figure 2
Figure 2
GARP2–GFP binds to DNA in a sequence-specific manner, as shown by qDPI-ELISA. (A) SDS-PAGE gel stained with Coomassie Brilliant-blue (left) and immunoblot using a GFP-specific antibody (right) of crude extracts from bacteria expressing GARP2–eGFP and eGFP proteins after IPTG induction. mock: control, i.e., non-transformed bacteria. (B) Native gel of GFP and GARP2–GFP illuminated with UV light to detect GFP fluorescence. (C) GFP emission of GARP2–GFP and GFP loaded to the 384-well plate before washing. (D) GFP emission of GARP2–GFP and GFP loaded to the 384-well plate after the first wash. no oligo = without oligo. Error bars depict the standard deviation of three technical replicates. Dilution factors: 0 (non-diluted), 2, and 4. After performing one-way ANOVA, significance classes were determined using Fischer’s least significant difference test, α = 0.01. Groups not connected by the same letter are significantly different.
Figure 3
Figure 3
His–MBP–GARP2 binds to DNA in a sequence-specific manner as shown via fluorescence correlation spectroscopy assays. (A) Representative Coomassie-stained protein gel of purified His–MBP–GARP2 and His–MBP compared to BSA standards. His–MBP–GARP2 and His–MBP bands that are expected to be around 57 and 40 kDa, respectively. (B) Autocorrelation curves of the alexa647-labeled wtOligo (50 nM) in the presence or absence of purified unlabeled His–MBP–GARP2 protein (G2; 6 µM). (C) Autocorrelation curves of the alexa647-labeled mutOligo (50 nM) in the presence or absence of purified unlabeled His–MBP–GARP2 protein (G2; 6 µM). (D) Diffusion coefficient of target labeled oligos in the presence of different concentrations of purified unlabeled His–MBP–GARP2 protein (G2) (0, 0.066, 0.66, 2, and 6 µM). Significance was determined via one-way ANOVA, α = 0.05. *** ≥ 0.01; **** ≥ 0.001. At 2 µM G2 concentration, p ≥ 0.0065 and at 6 µM, p ≥ 0.0002. (E) Normalized (wtOligo alone as the value 1) diffusion values for wtOligo (wt) and mutOligo (mut) upon addition of His–MBP–GARP2 (G2) protein (6 µM), un-labeled wtOigo (UL-wt), or His–MBP (MBP; 6 µM). Alexa 647-labeled oligos were used at 50 nM and unlabeled wtOligo was 500 nM. Technical replicates n = 3; +/− standard deviation. Significance classes were determined via the Tukey–Kramer HSD test, α = 0.05; groups not connected by the same letter are significantly different. (E) Normalized (wtOligo alone as the value 1) diffusion values for wtOligo (wt) and mutOligo (mut) upon addition of His-MBP-GARP2 (G2) protein (6 µM), un-labeled wtOigo (UL-wt) or His-MBP (MBP; 6 µM). Alexa 647-labelled oligos were used at 50 nM and unlabeled wtOligo was 500 nM. Technical replicates n = 3; +/− standard deviation.
Figure 4
Figure 4
The delimitation of the four MST analysis zones used in this work. MST traces where FSubject (hot fluorescence) and FReference (cold fluorescence) shown as pink and blue shaded zones, respectively according to Scheuermann 2016 [5] with time points are marked for the four different MST zones. The T-jump region comprises Subject 2 to Reference 1 (Region 2/1). The Thermophoresis, Subject 4 (light pink zone) to Reference 3. * Subject 4 includes multiple intervals (41, 42, 43,…, 410) that start at second 9 and end at second 35, i.e., region 41/3 starts at Reference 3 and ends at Subject 41 (second 9 to 10); similarly, region 3–410, comprises Reference 3 to Subject 410 (second 34 to 35). The inverse T-jump (Inv. T-jump) is Subject 6 to Reference 5. The back diffusion region examines the regions Subject 8 to Reference 7. (A) Exemplary representation of fluorescence trace profiles over time shown in rainbow colors with the different Reference and Subject time points. (B) Region limits for the four MST zones and their definitions in seconds for the different Reference and Subject time points.
Figure 5
Figure 5
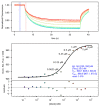
His–MBP–GARP2 interacts with DNA in a sequence-specific manner as shown by MST Interaction assays. Binding Curves of His–MBP–GARP2 (G2) or His–MBP (MBP) proteins to either wild-type (wtOligo) or mutated (mutOligo) CRM sites in a fragment of the ARR5 promoter. The change in thermophoresis caused by the titration of the ligand (WT or mut Oligos) is expressed as the change in the normalized fluorescence (ΔFn). ΔFn is defined as FSUB/FREF ×1000 with FREF the average Reference fluorescence value and FSUB the average Subject fluorescence. n = 3 with ± standard deviation. The bottom panel depicts the residuals between the data and the fit line. (A) T-jump region; (B) Thermophoresis region 410/3; (C) Inv. T-jump region; (D) Back diffusion region. Binding curves were fitted according to a one-to-one binding model using the PALMIST 1.4.4 software. Both His–MBP–GARP2 and His–MBP proteins were fluorescently labeled with RED-tris-NTA dye.
Figure 6
Figure 6
MST Dissociation constants KD (nM) derived from MST binding curves for His–MBP–GARP2 and His–MBP interaction to DNA. KD values are calculated from binding curves derived from different Regions of the thermophoretic time traces of His–MBP–GARP2 (GARP2) and His–MBP (MBP). These Regions include the T-jump region (Region 1–2); Thermophoresis regions (Regions 3–41 to 410); Inv. T-jump region (Region 5–6); and back diffusion region (Region 7–8). The 10 KD values corresponding to the 10 different Thermophoresis regions (Regions 3–41 to 410) are in order; the first KD value corresponds to Region 3–41 and the last KD value to Region 3–410. KD values were calculated according to a one-to-one binding model using the PALMIST 1.4.4 software. The data represent the different KD values with their corresponding upper and lower bounds calculated with the error surface projection (ESP) method (0.683 confidence level). Those KD that lack an interval value are unbound (see Table 1). The wild-type oligo (wt) comprises a fragment of the ARR5 promoter region containing four (A/G)GAT(T/C) binding sites. The mutated oligo (mut) has these four binding sites mutated.
Figure 7
Figure 7
Structural modeling of ARR2 DNA-binding GARP domain. (A) The GARP domain of ARR2 (ARR2) structurally aligned to the crystal structure of ENG (1hdd.pdb_chainC_s002) and NMR structure of ARR10 GARP domain (1irz.pdb_chainA_s001). α-helices (α1, α2 and α3) are shown as squiggles and strict β-turns are shown as TT. Red box with white characters indicates strict identity. Red characters signify similarity in group; blue-framed characters signify similarity across groups. See ESPript [74] for more information. (B) Schematic model of ARR10 GARP domain (PDB id: 1IRZ) (blue) mapped onto ENG (PDB id: 1HDD) (red) interacting with DNA. (C) Schematic model of ARR10 GARP domain (PDB id: 1IRZ) (blue) and the modeled structure of ARR2 GARP domain (green), both mapped onto ENG (PDB id: 1HDD) (red) interacting with DNA. Amino acids the α3-helix and the N-terminal arm of ARR10 GARP domain shown in stick model when forming contact with DNA as described by Hosada and co-workers [33]. (D) Sequence alignment of the ARR2 and ARR10 GARP domains to ENG with emphasis on the DNA contact residues (#) predicted by our modeling for GARP2 (blue), GARP10, and ENG (top lines, green) compared to GARP10 contact residues of Hosoda et al. [33], Molecular Structure of the GARP Family of Plant Myb-Related DNA Binding Motifs of the Arabidopsis Response Regulators, The Plant Cell, 2002, 14, 9, pp.2022, adapted by permission of Oxford University Press; (lower lines, gold) derived from intermolecular NOEs (*) and NMR chemical shift perturbations (+), as well ENG contact residues given by Kissinger and co-workers [38] (lower lines, gold) derived from the crystallization of the ENG–DNA complex (*). Putative NLS for GARP2 is underlined.
Figure 8
Figure 8
Mutations of the GARP domain in putative sites that directly contact DNA results in a reduction of ARR2 transcriptional activation ability. (A) Transactivation assay of the A-fragment of the ARR5 promoter fused to Luciferase (ARR5p::LUCm3) with ARR2, ARR2D80N, ARR2D80E, ARR2mG2, ARR2D80NmG2, ARR2D80EmG2 as effectors after cytokinin (red) or mock (blue) treatments. The grey bar represents the flash measurement prior to cytokinin addition. The black arrow marks the time point of hormone application. Light emission is given as relative LUC activity (RLU). The lighter area around the curves represents the standard error calculated from four technical replicates. (B) Immunoblot using a HA-specific antibody of crude extracts from protoplasts expressing ARR2 and ARR2 mutant proteins and Ponceau staining. H2O: control—water-transfected protoplasts.
Figure 9
Figure 9
MST trace and binding curves to calculate RED-tris-NTA dye concentration for His-labeling. Scheme of the MST trace (upper panel) and binding curve (lower panel) of 25 nM RED-tris-NTA dye bound to different concentrations of His–MBP–GARP2 protein, correspondingly labeled and color tagged in both panels.

Similar articles

References

    1. Du X., Li Y., Xia Y.L., Ai S.M., Liang J., Sang P., Ji X.L., Liu S.Q. Insights into Protein-Ligand Interactions: Mechanisms, Models, and Methods. Int. J. Mol. Sci. 2016;17:144. doi: 10.3390/ijms17020144. - DOI - PMC - PubMed
    1. Janin J. Protein-protein recognition. Prog. Biophys. Mol. Biol. 1995;64:145–166. doi: 10.1016/S0079-6107(96)00001-6. - DOI - PubMed
    1. Kastritis P.L., Bonvin A.M. On the binding affinity of macromolecular interactions: Daring to ask why proteins interact. J. R. Soc. Interface. 2013;10:20120835. doi: 10.1098/rsif.2012.0835. - DOI - PMC - PubMed
    1. Vuignier K., Schappler J., Veuthey J.L., Carrupt P.A., Martel S. Drug-protein binding: A critical review of analytical tools. Anal. Bioanal. Chem. 2010;398:53–66. doi: 10.1007/s00216-010-3737-1. - DOI - PubMed
    1. Scheuermann T.H., Padrick S.B., Gardner K.H., Brautigam C.A. On the acquisition and analysis of microscale thermophoresis data. Anal. Biochem. 2016;496:79–93. doi: 10.1016/j.ab.2015.12.013. - DOI - PMC - PubMed

Publication types