. 2023 Aug 11;24(16):12684.
doi: 10.3390/ijms241612684.

Expression Profiling along the Murine Intestine: Different Mucosal Protection Systems and Alterations in Tff1-Deficient Animals

Affiliations

Expression Profiling along the Murine Intestine: Different Mucosal Protection Systems and Alterations in Tff1-Deficient Animals

Franz Salm et al. Int J Mol Sci. .

Abstract

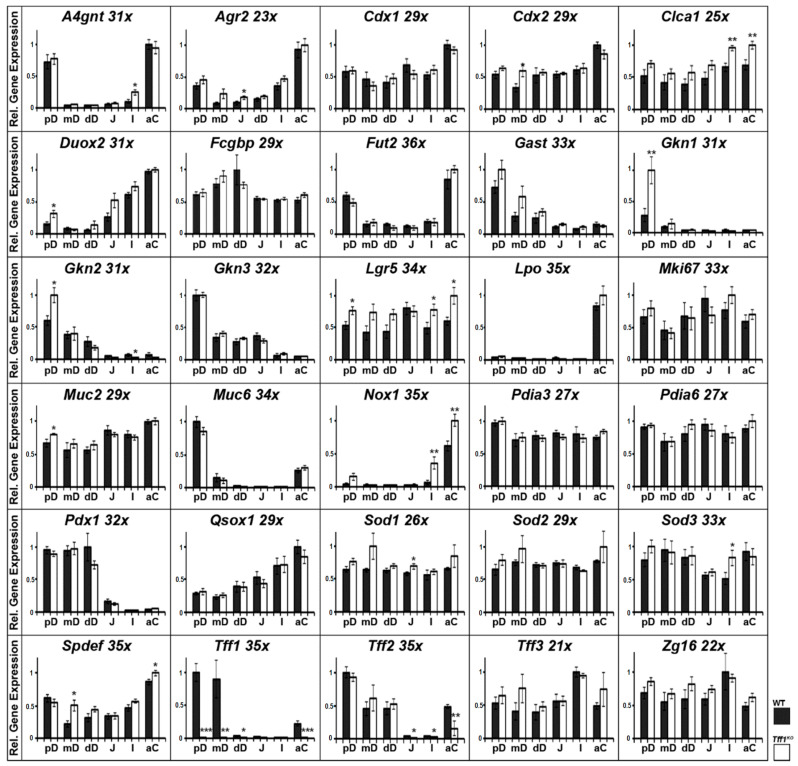
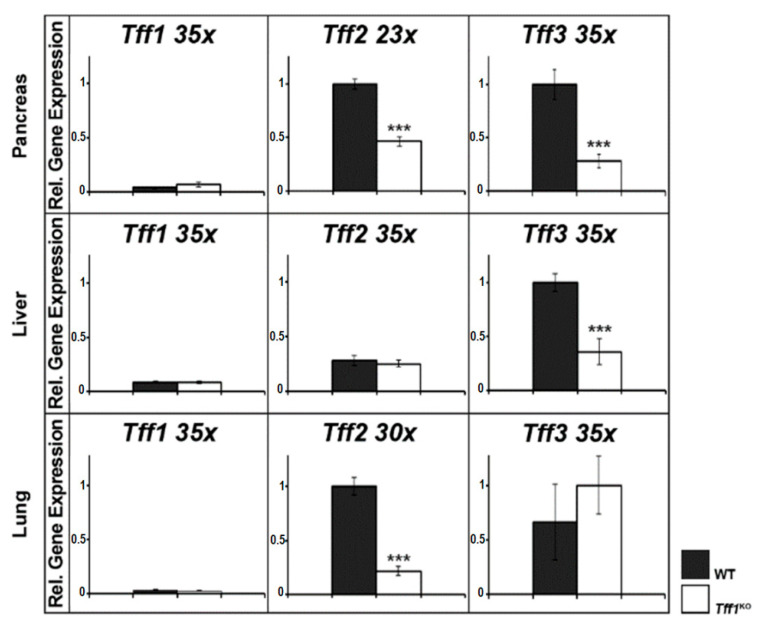
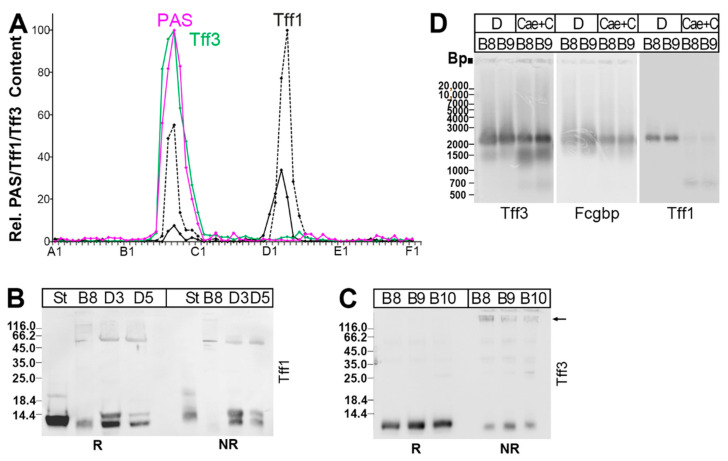
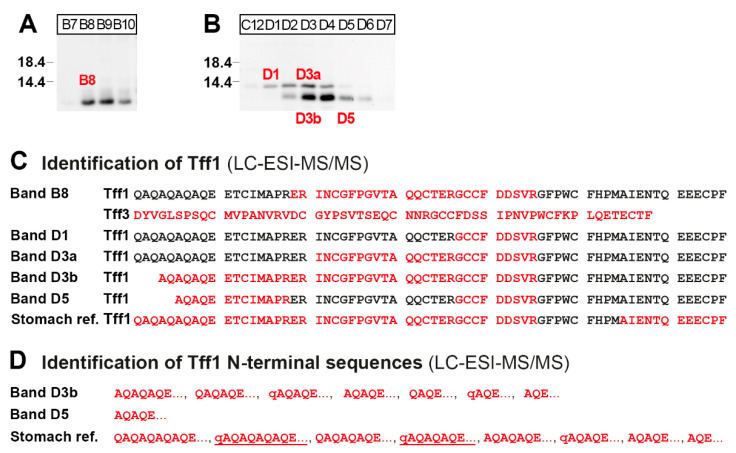
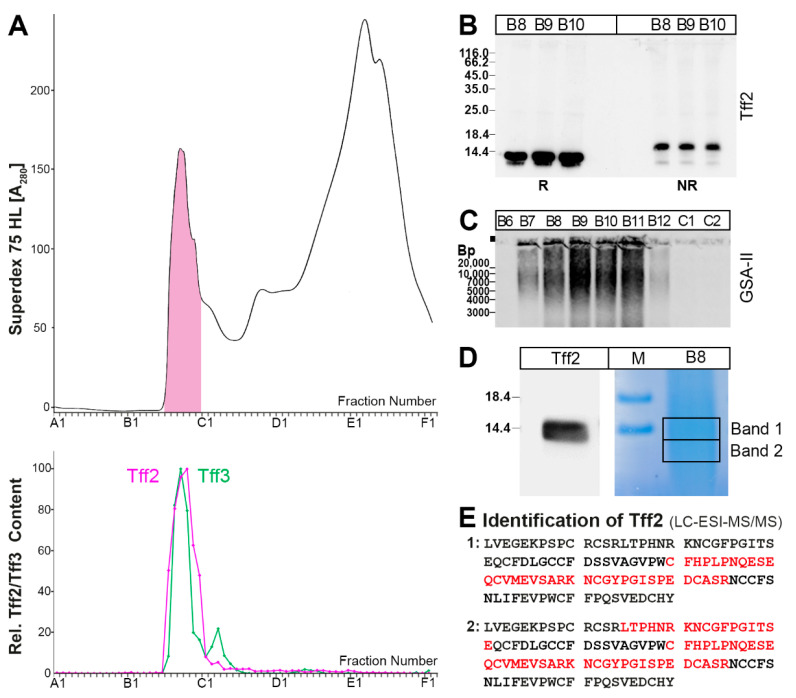
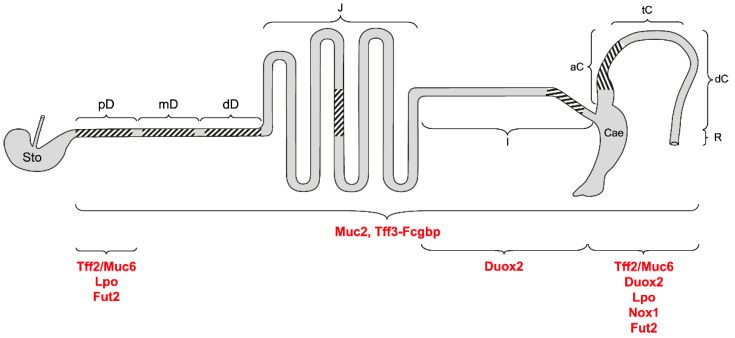
Tff1 is a typical gastric peptide secreted together with the mucin, Muc5ac. Tff1-deficient (Tff1KO) mice are well known for their prominent gastric phenotype and represent a recognized model for antral tumorigenesis. Notably, intestinal abnormalities have also been reported in the past in these animals. Here, we have compared the expression of selected genes in Tff1KO mice and their corresponding wild-type littermates (RT-PCR analyses), focusing on different mucosal protection systems along the murine intestine. As hallmarks, genes were identified with maximum expression in the proximal colon and/or the duodenum: Agr2, Muc6/A4gnt/Tff2, Tff1, Fut2, Gkn2, Gkn3, Duox2/Lpo, Nox1. This is indicative of different protection systems such as Tff2/Muc6, Tff1-Fcgbp, gastrokines, fucosylation, and reactive oxygen species (ROS) in the proximal colon and/or duodenum. Few significant transcriptional changes were observed in the intestine of Tff1KO mice when compared with wild-type littermates, Clca1 (Gob5), Gkn1, Gkn2, Nox1, Tff2. We also analyzed the expression of Tff1, Tff2, and Tff3 in the pancreas, liver, and lung of Tff1KO and wild-type animals, indicating a cross-regulation of Tff gene expression. Furthermore, on the protein level, heteromeric Tff1-Fcgbp and various monomeric Tff1 forms were identified in the duodenum and a high-molecular-mass Tff2/Muc6 complex was identified in the proximal colon (FPLC, proteomics).

Keywords: Brunner gland; Fcgbp; Muc6; TFF; colon cancer; goblet cell; innate immunity; mucin; reactive oxygen species; trefoil factor.


Conflict of interest statement

The authors declare no conflict of interest.

Figures

Figure 1
Figure 1
Semi-quantitative RT-PCR analyses. A4gnt, Agr2, Cdx1, Cdx2, Clca1, Duox2, Fcgbp, Fut2, Gast, Gkn1, Gkn2, Gkn3, Mki67, Lgr5, Lpo, Muc2, Muc6, Nox1, Pdia3, Pdia6, Pdx1, Qsox1, Sod1, Sod2, Sod3, Spdef, Tff1, Tff2, Tff3, and Zg16 expression in different parts of the murine intestine, i.e., proximal, medial, and distal parts of the duodenum (pD, mD, dD), middle section of the jejunum (J), distal ileum (I), and proximal/ascending colon (aC). Extracts of 10 female wild-type (WT, black bars) and 10 female Tff1KO mice (white bars) were investigated. The number of amplification cycles is given after each gene. The relative gene expression levels were normalized against β-actin (Actb, 23x or 24x). Significances are indicated by asterisks (*, p ≤ 0.05; **, p ≤ 0.01; ***, p ≤ 0.001).
Figure 2
Figure 2
Semi-quantitative RT-PCR analyses (murine pancreas, liver, and lung). Tff1, Tff2, and Tff3 expression was monitored in extracts of 10 female wild-type (WT, black bars) and 10 female Tff1KO mice (white bars). The number of amplification cycles is given after each gene. The relative gene expression levels were normalized against β-actin (Actb; pancreas 27x, liver 24x, lung 21x). Significances are indicated by asterisks (***, p ≤ 0.001).
Figure 3
Figure 3
Analysis of a murine duodenal extract (complete duodena from four animals). The elution profile after SEC on a Superdex 75 HL column as well as the distribution of Tff2 have been reported previously [22]. (A) Distribution of the relative Tff1 (black) and Tff3 contents (green) as determined via Western blot analysis under reducing conditions and semi-quantitative analysis of monomeric band intensities. For Tff1, a regular band (black drawn line) and a somewhat shortened band (black dashed line) were analyzed separately. For comparison, the fractions were analyzed for their mucin content using the PAS reaction (pink); (B) 15% SDS-PAGE under reducing (R) and non-reducing (NR) conditions (post-in-gel reduction), respectively, and Western blot analysis of the high-molecular-mass fraction B8 and the low-molecular-mass fractions D3 and D5 concerning Tff1. As a control, fraction D1 from a murine stomach extract (St; [22]) was analyzed. (C) Analysis of the high-molecular-mass fractions B8–B10 concerning Tff3; (D) 1% AgGE and Western blot analysis of the high-molecular-mass fractions B8 and B9 concerning Tff3, Fcgbp, and Tff1, respectively (D, duodenal extract; Cae+C, extract from caecum plus total colon). Relative standard: DNA ladder (base pairs).
Figure 4
Figure 4
Proteome analysis of the high- and low-molecular-mass forms of Tff1 in a duodenal extract (fractions B8, and D1, D3, and D5 from Figure 3). (A,B) SDS-PAGE under reducing conditions of the high-molecular mass fractions B7–B10 (A) and the low-molecular-mass fractions C12–D7 (B) and Western blot analysis concerning Tff1. Fractions B8, D1, D3, and D5 were then separated via preparative reducing of SDS-PAGE, and after Coomassie staining, bands termed B8, D1, D3a, D3b, and D5 were excised (marked in red). (C) Results of the proteome analyses after tryptic in-gel digestion of bands B8, D1, D3a, D3b, and D5. Identified regions in Tff1 are shown in red. In B8, Tff3 was also identified. The results of the Tff1 reference (from a stomach extract) are also shown. The longest N-terminal sequences identified are shown. (D) Identification of heterogeneous Tff1 N-terminal sequences in bands D3b and the stomach reference (q indicates a pyro-Glu residue). The predominant sequences are underlined.
Figure 5
Figure 5
Analysis of a murine caecum plus total colon extract (single individual). (A) Elution profile after SEC on a Superdex 75 HL column as determined via absorbance at 280 nm (PAS-positive mucin fractions: pink). Underneath: distribution of the relative Tff2 (red) and Tff3 contents (green) as determined via Western blot analysis under reducing conditions and semi-quantitative analysis of the monomeric band intensities; (B) 15% SDS-PAGE under reducing (R) and non-reducing (NR) conditions (post-in-gel reduction), respectively, and Western blot analysis of the high-molecular-mass fractions B8–B10 concerning Tff2; (C) 1% AgGE and Western blot analysis of the fractions B6–C2 concerning Muc6 (lectin GSA-II). Relative standard: DNA ladder (base pairs). (D) SDS-PAGE under reducing conditions of fraction B8. Shown is a Western blot analysis concerning Tff2 and in parallel, Coomassie staining. Bands 1 and 2 were excised for proteome analysis. (E) Results of the proteome analysis after tryptic in-gel digestion of bands 1 and 2. Identified regions in Tff2 are shown in red.
Figure 6
Figure 6
Schematic structure of the murine intestine and its different mucosal protection systems. Shown are stomach (Sto); proximal (pD), medial (mD), and distal parts of the duodenum (dD); jejunum (J); ileum (I); caecum (Cae); ascending/proximal (aC), transverse/medial (tC), and descending/distal colon (dC); rectum (R). The regions investigated in this study via RT-PCR are hatched. The predominant localization of the different intestinal protection systems is indicated.

Similar articles

Cited by

References

    1. Clevers H., Batlle E. SnapShot: The intestinal crypt. Cell. 2013;152:1198–1198.e2. doi: 10.1016/j.cell.2013.02.030. - DOI - PubMed
    1. Clevers H. The intestinal crypt, a prototype stem cell compartment. Cell. 2013;154:274–284. doi: 10.1016/j.cell.2013.07.004. - DOI - PubMed
    1. Ley R.E., Hamady M., Lozupone C., Turnbaugh P.J., Ramey R.R., Bircher J.S., Schlegel M.L., Tucker T.A., Schrenzel M.D., Knight R., et al. Evolution of mammals and their gut microbes. Science. 2008;320:1647–1651. doi: 10.1126/science.1155725. - DOI - PMC - PubMed
    1. Garrett W.S., Gordon J.I., Glimcher L.H. Homeostasis and inflammation in the intestine. Cell. 2010;140:859–870. doi: 10.1016/j.cell.2010.01.023. - DOI - PMC - PubMed
    1. Ermund A., Schütte A., Johansson M.E.V., Gustafsson J.K., Hansson G.C. Studies of mucus in mouse stomach, small intestine, and colon. I. Gastrointestinal mucus layers have different properties depending on location as well as over the Peyer’s patches. Am. J. Physiol. Gastrointest. Liver Physiol. 2013;305:G341–G347. doi: 10.1152/ajpgi.00046.2013. - DOI - PMC - PubMed