. 2023 Aug 17;24(16):12897.
doi: 10.3390/ijms241612897.

Regulation of Smooth Muscle Cell Proliferation by Mitochondrial Ca2+ in Type 2 Diabetes

Affiliations

Regulation of Smooth Muscle Cell Proliferation by Mitochondrial Ca2+ in Type 2 Diabetes

Olha M Koval et al. Int J Mol Sci. .

Abstract

Type 2 diabetes (T2D) is associated with increased risk of atherosclerotic vascular disease due to excessive vascular smooth muscle cell (VSMC) proliferation. Here, we investigated the role of mitochondrial dysfunction and Ca2+ levels in VSMC proliferation in T2D. VSMCs were isolated from normoglycemic and T2D-like mice induced by diet. The effects of mitochondrial Ca2+ uptake were studied using mice with selectively inhibited mitochondrial Ca2+/calmodulin-dependent kinase II (mtCaMKII) in VSMCs. Mitochondrial transition pore (mPTP) was blocked using ER-000444793. VSMCs from T2D compared to normoglycemic mice exhibited increased proliferation and baseline cytosolic Ca2+ levels ([Ca2+]cyto). T2D cells displayed lower endoplasmic reticulum Ca2+ levels, reduced mitochondrial Ca2+ entry, and increased Ca2+ leakage through the mPTP. Mitochondrial and cytosolic Ca2+ transients were diminished in T2D cells upon platelet-derived growth factor (PDGF) administration. Inhibiting mitochondrial Ca2+ uptake or the mPTP reduced VSMC proliferation in T2D, but had contrasting effects on [Ca2+]cyto. In T2D VSMCs, enhanced activation of Erk1/2 and its upstream regulators was observed, driven by elevated [Ca2+]cyto. Inhibiting mtCaMKII worsened the Ca2+ imbalance by blocking mitochondrial Ca2+ entry, leading to further increases in [Ca2+]cyto and Erk1/2 hyperactivation. Under these conditions, PDGF had no effect on VSMC proliferation. Inhibiting Ca2+-dependent signaling in the cytosol reduced excessive Erk1/2 activation and VSMC proliferation. Our findings suggest that altered Ca2+ handling drives enhanced VSMC proliferation in T2D, with mitochondrial dysfunction contributing to this process.

Keywords: calcium; proliferation; type 2 diabetes; vascular smooth muscle cells.


Conflict of interest statement

The authors have declared that no conflict of interest exists.

Figures

Figure 1
Figure 1
Inhibition of mitochondrial CaMKII reduces proliferation of VSMCs isolated from T2D mice. Numbers of VMSCs isolated from NG or T2D mice of the WT and mtCaMKIIN genetic backgrounds, counted after 72 h in culture with or without PDGF (20 ng/mL). Data are expressed as fold change over levels at 0 h. (A) NG or T2D mice of the WT background treated with BAPTA (1 µM), (n = 11). (B) VSMCs of the WT and mtCaMKIIN genetic backgrounds (n = 19). (C) VSMCs isolated from T2D mice of the WT background and transduced with control or mtCaMKIIN adenovirus (n = 8). (D,E) VSMCs from T2D mice of the WT and mtCaMKIIN background, with or without administration of the MCU inhibitor Ru 265 (100 µM) (n = 7 and 9, respectively). Analyses by Kruskal–Wallis test (AD).
Figure 2
Figure 2
Cytosolic Ca2+ levels and transients are altered by T2D. (A) [Ca2+]cyto concentration in VSMCs from WT normoglycemic (NG) and diabetic (T2D) mice (n = 6). (B) Baseline [Ca2+] levels, as assessed by Fura-2AM imaging, in VSMCs from NG and T2D mice of the WT and mtCaMKIIN genotypes (n = 13). (C) Cytosolic Ca2+ transients in response to PDGF (n = 7). (D) Peak amplitude and (E) area under the curve (AUC) for Ca2+ transients as in (C). Analysis by Mann–Whitney test (A), Kruskal–Wallis test (B,D,E).
Figure 3
Figure 3
ER Ca2+ release in VSMCs from NG and T2D mice of the WT and mtCaMKIIN genotypes. (A) [Ca2+]ER as assessed by CEPIA-ER fluorescence after adding thapsigargin (1 µM) to VSMCs isolated from NG and T2D mice of the WT and mtCaMKIIN genotypes (n = 7). (B,C) Quantitation of (B) peak amplitude and (C) area under the curve (AUC) for CEPIA-ER fluorescence, from recordings as in (A). (D) Representative immunoblots for IP3R, SERCA and NCX in whole cell lysates from VSMCs of normoglycemic (NG) and type 2 diabetic (T2D) mice of WT and mtCaMKIIN genotypes. (E) Quantification of IP3R adjusted for GAPDH (n = 5). (F) Quantification of SERCA adjusted for GAPDH (n = 5). (G) Quantification of NCX adjusted for GAPDH (n = 5). Analyses by Kruskal–Wallis test.
Figure 4
Figure 4
Mitochondrial Ca2+ levels and transients are altered by T2D. (A) Matrix-free mitochondrial Ca2+ measured from mitochondria isolated from NG and T2D VSMC of WT and mtCaMKIIN genotypes and normalized to total mitochondrial proteins (n = 6). (B) Mitochondrial Ca2+ uptake as assessed by mtPericam imaging, in VSMCs from NG and T2D mice of the WT and mtCaMKIIN genotypes induced by PDGF application (20ng/mL) (n = 8). (C) Quantification of area under the curve (AUC) and (D) peak amplitude of mtPericam recordings as in (B). (E) Mitochondrial membrane potential as assessed by TMRM imaging followed by normalization to the mitoTracker signal in VSMCs from NG and T2D mice of the WT and mtCaMKIIN genotypes (n = 7). Analysis by Kruskal–Wallis test.
Figure 5
Figure 5
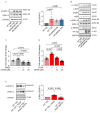
The enhanced proliferation of VSMCs isolated from T2D mice is caused by Ca2+-dependent Erk1/2 proliferation. (A) Representative immunoblots for phosphorylated (active) Erk1/2 and total Erk1/2 protein, and their quantification for cultured VSMCs isolated from NG and T2D WT and mtCaMKIIN mice (n = 8). (B) Representative immunoblots for signaling pathway components upstream of Erk1/2 activation in cultured VSMCs from T2D mice of the WT and mtCaMKIIN genetic backgrounds. (C,D) Fold changes in cell number in (C) WT NG (n = 9), (D) WT T2D (n = 10←) VSMCs 72 h after addition of PDGF and the Erk1/2 inhibitor U0126. (E) Representative immunoblot assessing phosphorylated (active) Erk-1/2 and (total) Erk1/2 protein levels and their quantification in cultured cells isolated from T2D mice of the WT genotype 15 min after addition of PDGF and preincubation with the Ca2+ chelator BAPTA (10 µM for 1 h), (n = 6). Analyses by Kruskal–Wallis test (A,CE).
Figure 6
Figure 6
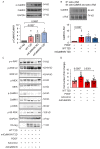
Activation of cytosolic CaMKII in T2D VSMCs mediates Erk1/2 activation. (A) Immunoblots for phosphorylated (active) CaMKII and total CaMKII protein in VSMCs isolated from NG and T2D mice of the WT and mtCaMKIIN genotypes (n = 5). (B) Representative immunoblot (upper panel) and quantification (lower panel) of co-IP between CaMKII and c-Raf in VSMCs from diabetic (T2D) mice of the WT and mtCaMKIIN genotypes. IP was performed with anti-cRaf and probed with anti-CaMKII (n = 5). (C) Representative immunoblots assessing upstream signaling components of the Erk1/2 signaling pathway in VSMCs from T2D mice of the WT and mtCaMKIIN genotypes. WT T2D cells were transduced with adenovirus expressing untargeted CaMKIIN for 72 h prior to treatment with PDGF (n = 3). (D) Number of VSMCs in T2D mice of the WT genotype following transduction with adenovirus expressing untargeted CaMKIIN or control virus for 72 h prior to treatment with PDGF (20 ng/mL) and counted 72 h later (n = 12). Analyses by Kruskal–Wallis test (A,B,D).
Figure 7
Figure 7
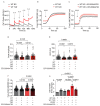
Changes of mitochondrial and cytosolic Ca2+- levels under mPTP inhibition. (A) Ca2+ uptake by Calcium Green-5N over time within response to 10 μM CaCl2 in permeabilized VSMCs from WT NG and T2D (n = 5). (B,C) Cytosolic Ca2+ transients induced by FCCP (5 µM) application and measured with Fura-2AM in NG and T2D WT VSMC before and after mPTP inhibitor preincubation (ER-000444793 (10 µM) for 2 h), (n = 5). (D) Peak amplitude and (E) Area under the curve (AUC) quantified from (B,C). (F) Basal Fura-2AM fluorescence measured in NG and T2D WT VSMC with and without mPTP inhibitor preincubation (ER-000444793 (10 µM) for 2 h), (n = 5). (G) Cell counts at 72 h. after addition of PDGF in NG and T2D WT VSMC before and after mPTP inhibitor preincubation (ER-000444793 (10 µM) for 2 h), (n = 12). Analyses by Kruskal–Wallis test (DG).

Update of

Similar articles

Cited by

References

    1. Einarson T.R., Acs A., Ludwig C., Panton U.H. Prevalence of cardiovascular disease in type 2 diabetes: A systematic literature review of scientific evidence from across the world in 2007–2017. Cardiovasc. Diabetol. 2018;17:83. doi: 10.1186/s12933-018-0728-6. - DOI - PMC - PubMed
    1. De Meyer G.R., Bult H. Mechanisms of neointima formation—Lessons from experimental models. Vasc. Med. 1997;2:179–189. doi: 10.1177/1358863X9700200304. - DOI - PubMed
    1. Basatemur G.L., Jørgensen H.F., Clarke M.C.H., Bennett M.R., Mallat Z. Vascular smooth muscle cells in atherosclerosis. Nat. Rev. Cardiol. 2019;16:727–744. doi: 10.1038/s41569-019-0227-9. - DOI - PubMed
    1. Nguyen A.T., Gomez D., Bell R.D., Campbell J.H., Clowes A.W., Gabbiani G., Giachelli C.M., Parmacek M.S., Raines E.W., Rusch N.J., et al. Smooth muscle cell plasticity: Fact or fiction? Circ. Res. 2013;112:17–22. doi: 10.1161/CIRCRESAHA.112.281048. - DOI - PMC - PubMed
    1. Majesky M.W., Giachelli C.M., Reidy M.A., Schwartz S.M. Rat carotid neointimal smooth muscle cells reexpress a developmentally regulated mRNA phenotype during repair of arterial injury. Circ. Res. 1992;71:759–768. doi: 10.1161/01.RES.71.4.759. - DOI - PubMed