. 2023 Aug 19;24(16):12965.
doi: 10.3390/ijms241612965.

Calcium Signaling during Cortical Apical Dendrite Initiation: A Role for Cajal-Retzius Neurons

Affiliations

Calcium Signaling during Cortical Apical Dendrite Initiation: A Role for Cajal-Retzius Neurons

Joshua R Enck et al. Int J Mol Sci. .

Abstract

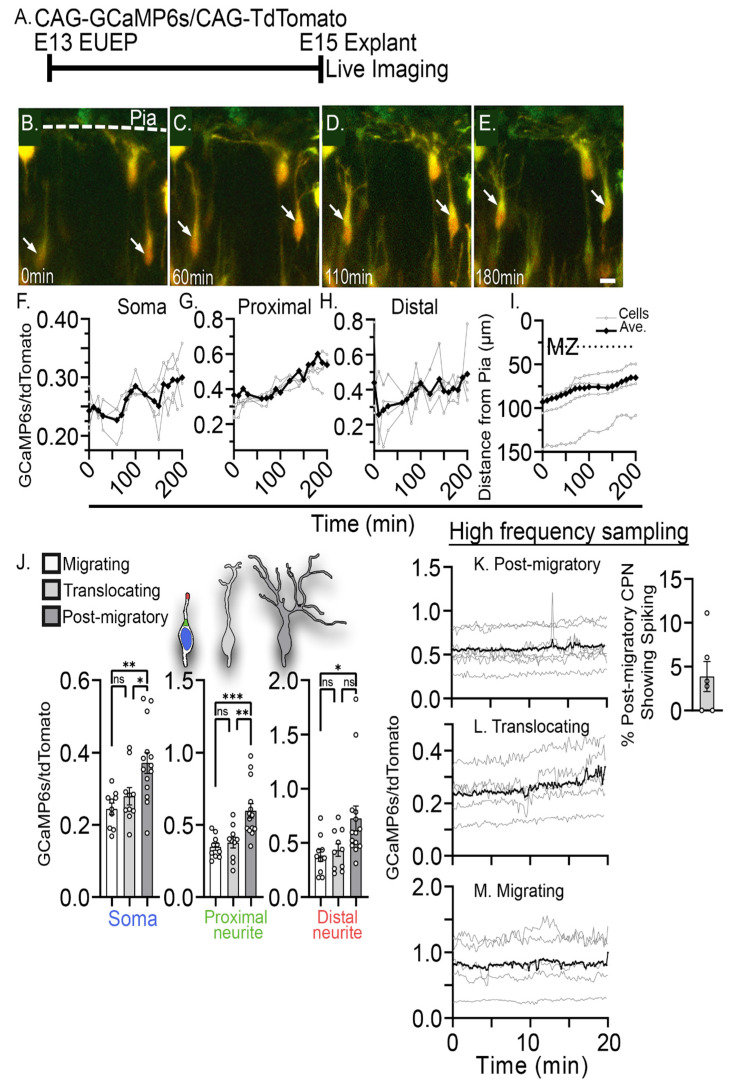
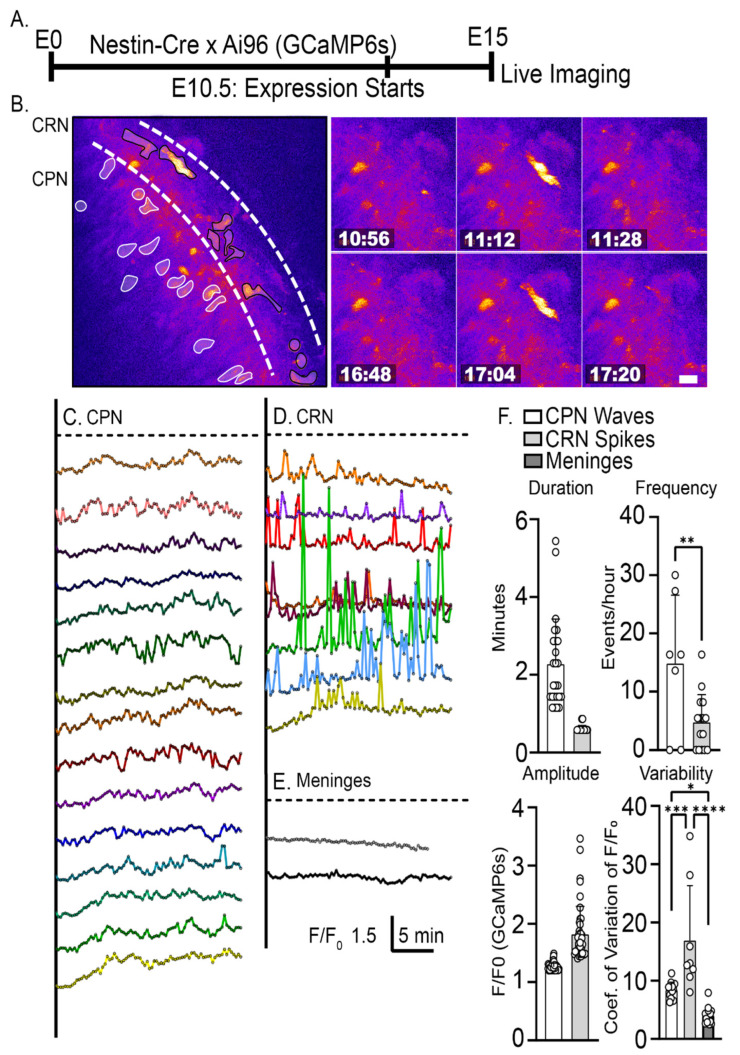
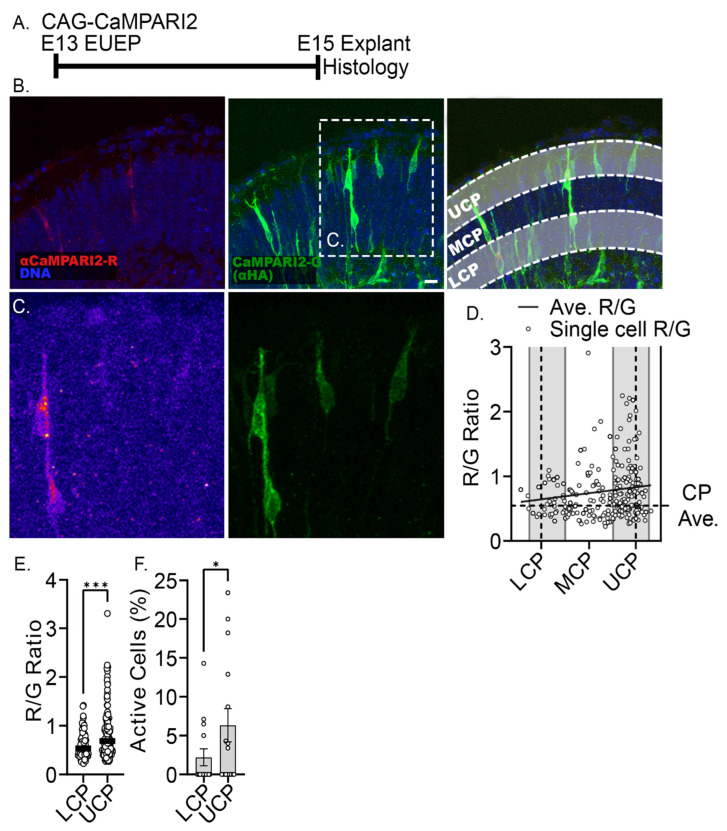
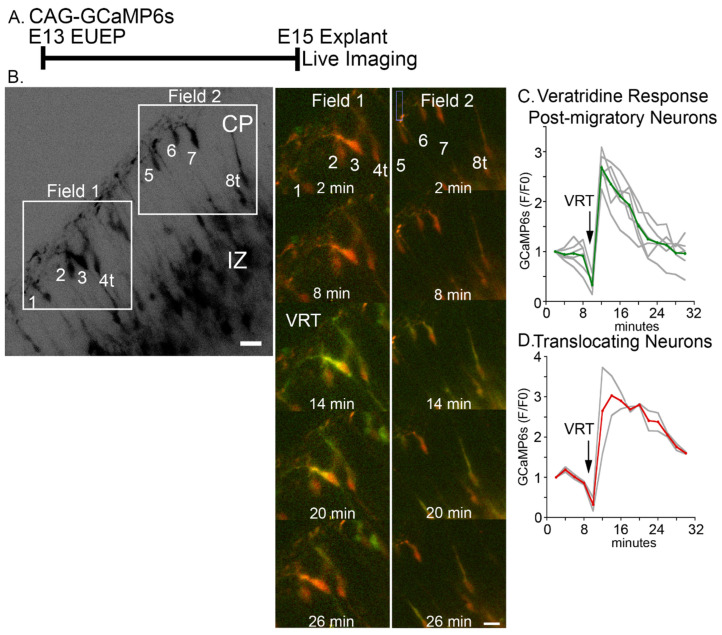
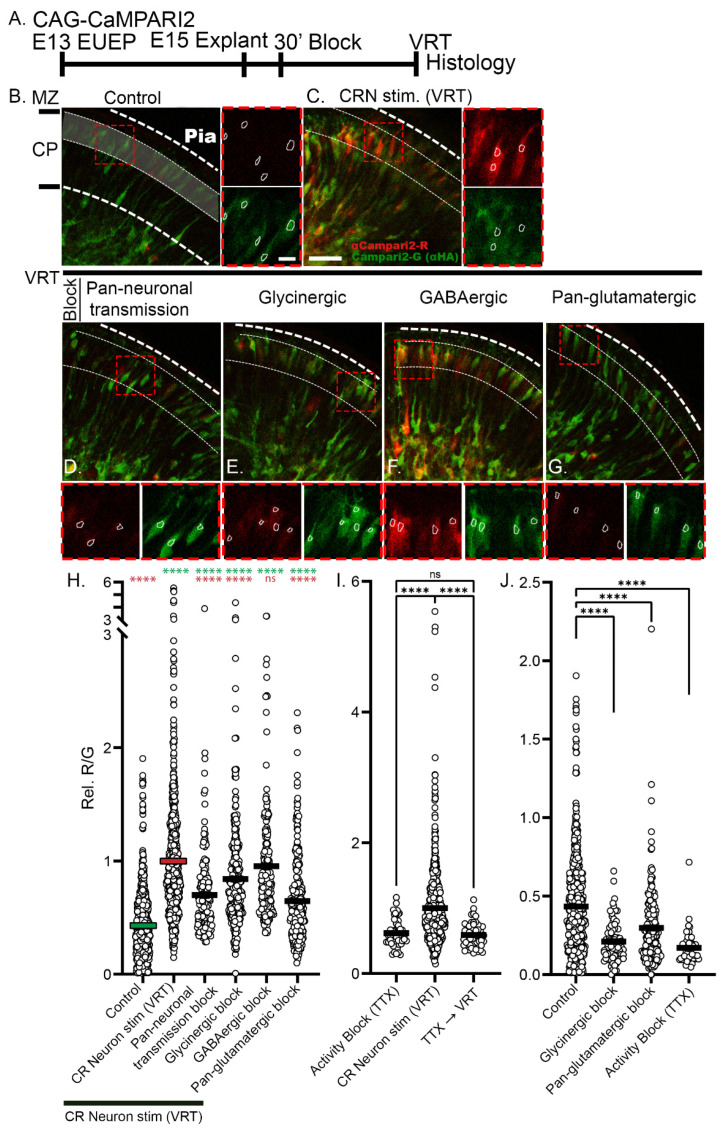
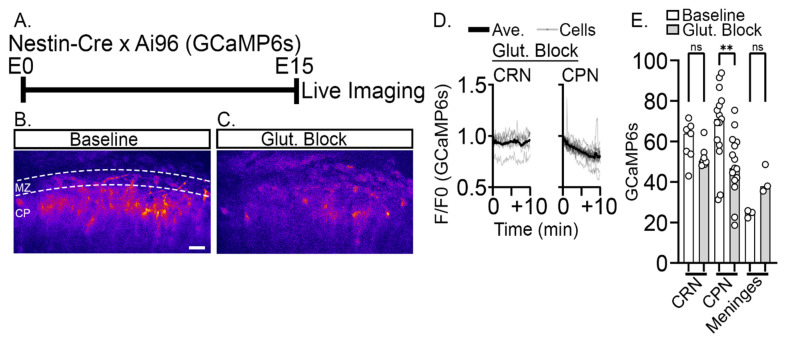
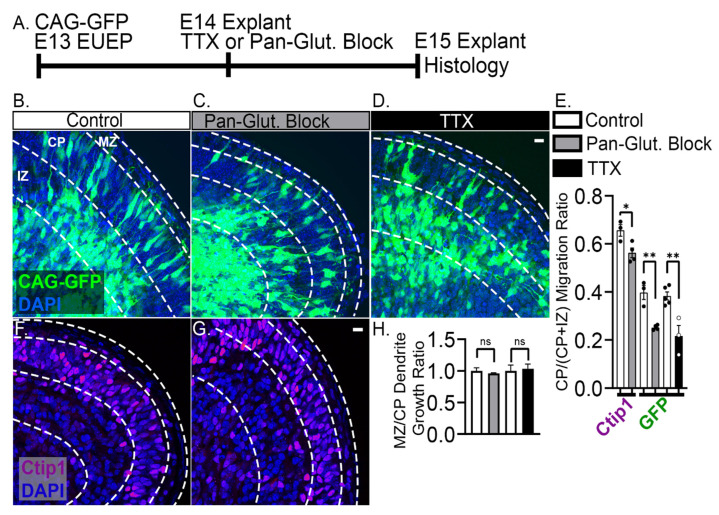
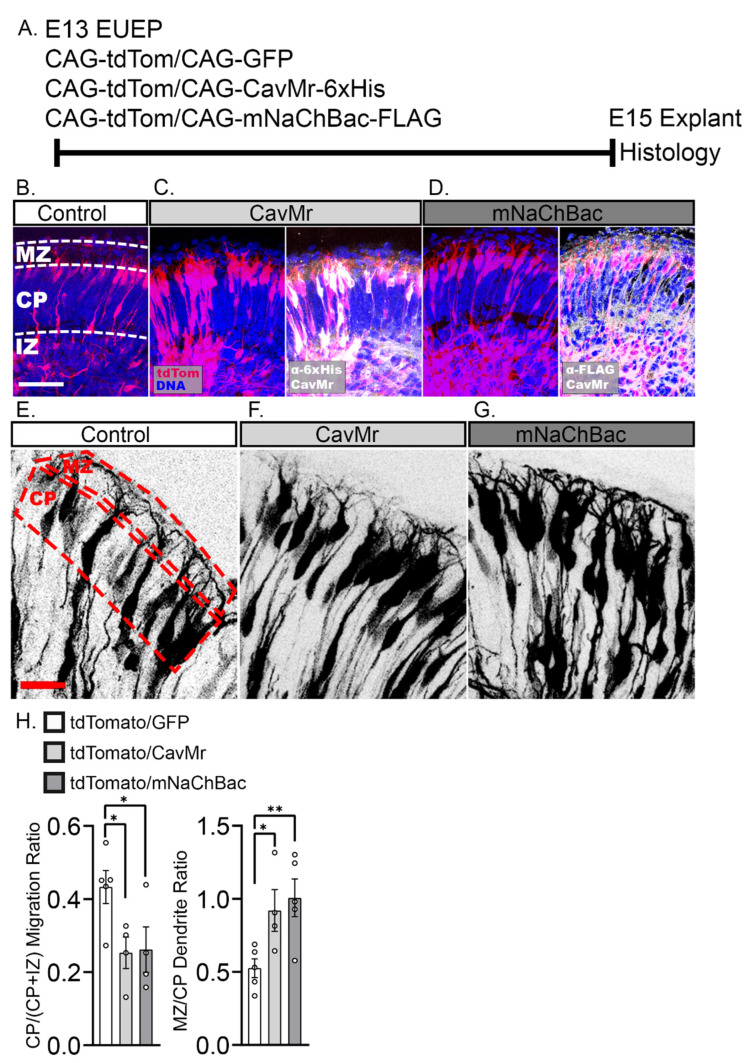
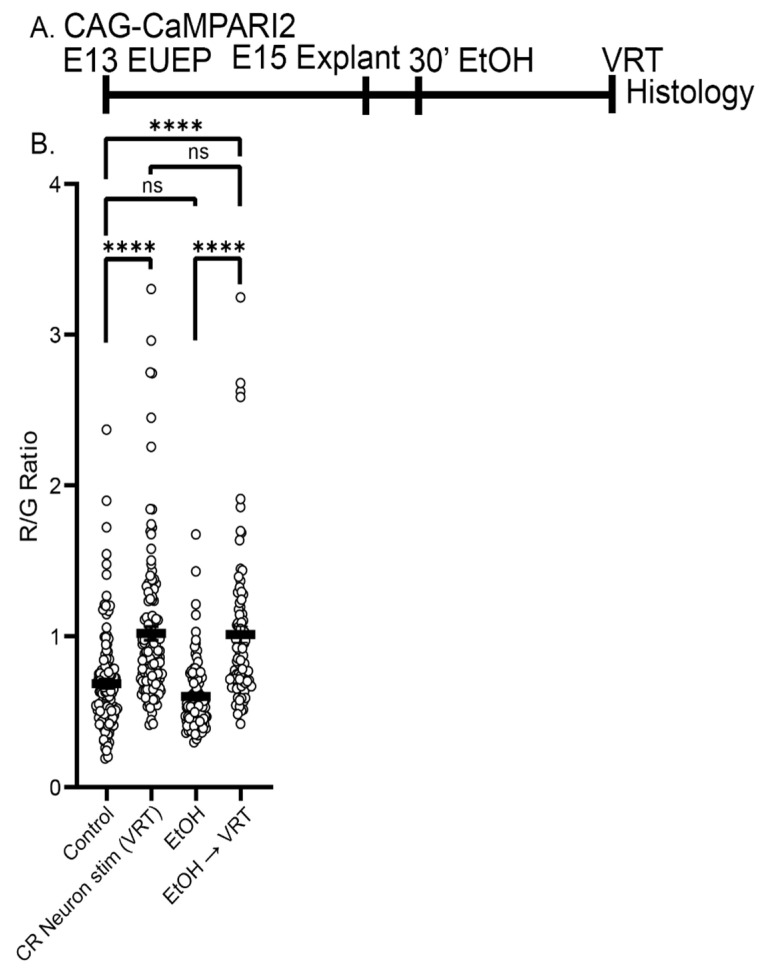
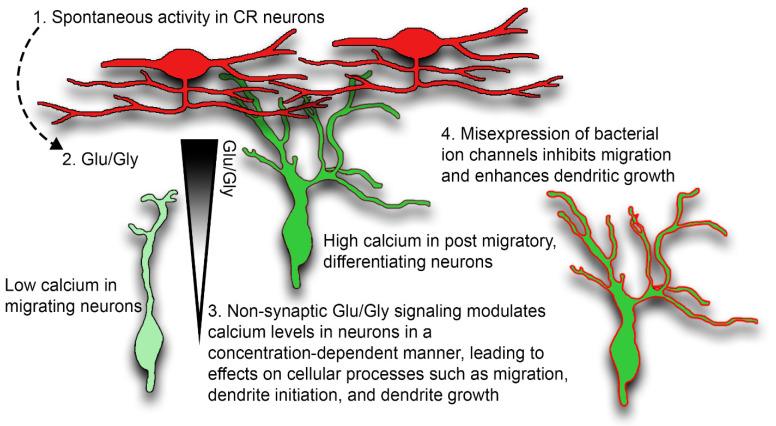
The apical dendrite of a cortical projection neuron (CPN) is generated from the leading process of the migrating neuron as the neuron completes migration. This transformation occurs in the cortical marginal zone (MZ), a layer that contains the Cajal-Retzius neurons and their axonal projections. Cajal-Retzius neurons (CRNs) are well known for their critical role in secreting Reelin, a glycoprotein that controls dendritogenesis and cell positioning in many regions of the developing brain. In this study, we examine the possibility that CRNs in the MZ may provide additional signals to arriving CPNs, that may promote the maturation of CPNs and thus shape the development of the cortex. We use whole embryonic hemisphere explants and multiphoton microscopy to confirm that CRNs display intracellular calcium transients of <1-min duration and high amplitude during early corticogenesis. In contrast, developing CPNs do not show high-amplitude calcium transients, but instead show a steady increase in intracellular calcium that begins at the time of dendritic initiation, when the leading process of the migrating CPN is encountering the MZ. The possible existence of CRN to CPN communication was revealed by the application of veratridine, a sodium channel activator, which has been shown to preferentially stimulate more mature cells in the MZ at an early developmental time. Surprisingly, veratridine application also triggers large calcium transients in CPNs, which can be partially blocked by a cocktail of antagonists that block glutamate and glycine receptor activation. These findings outline a model in which CRN spontaneous activity triggers the release of glutamate and glycine, neurotransmitters that can trigger intracellular calcium elevations in CPNs. These elevations begin as CPNs initiate dendritogenesis and continue as waves in the post-migratory cells. Moreover, we show that the pharmacological blockade of glutamatergic signaling disrupts migration, while forced expression of a bacterial voltage-gated calcium channel (CavMr) in the migrating neurons promotes dendritic growth and migration arrest. The identification of CRN to CPN signaling during early development provides insight into the observation that many autism-linked genes encode synaptic proteins that, paradoxically, are expressed in the developing cortex well before the appearance of synapses and the establishment of functional circuits.

Keywords: Cajal-Retzius neurons; cortical projection neurons; dendritogenesis; glutamate; glycine.


Conflict of interest statement

The authors declare no conflict of interest.

Figures

Figure 1
Figure 1
Intracellular calcium signals (GCaMP6s) during migration arrest and dendritic initiation. (A) Experimental design: CAG-GCaMP6s and CAG-tdTomato plasmids were co-electroporated into ventricular progenitors of the developing cortex on E13. Whole hemispheres were cultured for 2 days before 2-photon live imaging. (BE) Live imaging of dendritic initiation (1 z-stack/10 min) for a 3 h period. Arrows identify CPNs transitioning from migratory to post-migratory stages. (FH) Quantified GCaMP6s/tdTomato signals derived from regions of interest (ROI) in the (F) soma (blue), (G) proximal dendrite (green), and (H) distal dendrite (red) as neurons (I) translocate and begin dendritogenesis, MZ: Marginal zone (dotted line). (J) Comparison of the calcium signal at successive stages of CPN development: migrating (M), translocating (T), and post-migratory (PM). M and T neurons had similar proximal GCaMP6s signals of 0.24 ± 0.05 and 0.28 ± 0.08, respectively. In contrast, PM neurons revealed a significantly higher GCaMP6s signal of 0.37 ± 0.11. PM vs. T (p = 0.04), PM vs. M (p = 0.003), M vs. T (p = 0.74). In the proximal neurite, GCaMP6s was 0.60 ± 0.19 in PM vs. 0.35 ± 0.08 and 0.38 ± 0.12 in M and T neurons, respectively. PM vs. T (p = 0.002), PM vs. M (p = 0.0006), M vs. T (p = 0.96). Finally, in the distal neurite GCaMP6s signal of PM neurons were 0.73 ± 0.42 vs. 0.38 ± 0.17 and 0.43 ± 0.18 in M and T neurons, respectively, with significance of PM vs. T (p = 0.08), PM vs. M (p = 0.03), and M vs. T (p = 0.98). (KM) High-frequency sampling (1 z-stack/7 s) in GCaMP6s expressing PM CPNs. Only 3.9 ± 1.7% of PM CPNs showed spiking activity during 20 min of imaging (n = 4 explants). (L) translocating and (M) migrating neurons showed no spiking activity. All comparisons were made using ordinary one-way ANOVA and Šidák’s multiple comparisons. Significance: ns p > 0.05, * p ≤ 0.05, ** p ≤ 0.01, *** p ≤ 0.001. Scalebar: 10 μm.
Figure 2
Figure 2
Spontaneous calcium transients during early cortical development. (A) Experimental design: embryonic hemispheres from a Nestin-Cre X Ai96 (GCaMP6s) transgenics are imaged using 2-photon microscopy on E15 at one z-stack per 9 s intervals. (B) CRN (black outline) and CPN (white outline) are identified in the imaged field by their morphology and respective positions in the MZ and CP. (CE) GCaMP6s calcium activity in CPNs, CRNs, and control signal (auto-fluorescence) in the meninges. (F) Quantitative characterization of intracellular calcium waves and spikes. CPNs exclusively exhibit calcium waves with an amplitude of 1.26 ± 0.06 F/F0 (mean ± s.d.), frequency of 14.8 ± 11.8 waves/h, and duration of 2.27 ± 1.2 min. CRNs exhibit calcium spiking with a mean amplitude of 1.82 ± 0.48 F/F0, frequency of 4.73 ± 4.8 spikes/h, and duration of 0.60 ± 0.09 min. CRN F/F0 had an average coefficient of variation (CV) of 16.9 ± 9.4 compared to CPN of 8.4 ± 1.4. Autofluorescence in the meninges was measured to assess internal fluorescent fluctuation. The autofluorescence did not exhibit any spiking or wave activity and had an average CV of 4.01 ± 1.4, which is significantly lower than the fluorescence fluctuations observed with CPN signal. Significance: * p ≤ 0.05, ** p ≤ 0.01, *** p ≤ 0.001, **** p ≤ 0.0001. Unpaired two-tailed t-tests were used for comparing duration, frequency, amplitude. Coefficient of variation comparisons were made using ordinary one-way ANOVA and Šidák’s multiple comparisons n = 2 explants, and at least seven neurons from each class. Scale bar: 20 μm.
Figure 3
Figure 3
Fixed calcium signal confirms intracellular calcium signals (CaMPARI2 R/G ratio) are higher in neurons located in the upper cortical plate (UCP) compared to neurons in the lower cortical plate (LCP). Middle cortical plate (MCP) quantification is not shown. (A) Experimental design: CAG-CaMPARI2 plasmid was electroporated into the developing cortex on E13. Whole hemispheres were cultured for 2 days before photoconversion and paraformaldehyde fixation of the CaMPARI2 signal. (B) Calcium-bound CaMPARI2 is shown in red. Total CaMPARI2 is revealed by antibody detection of the HA tag on the CaMPARI2 protein (green). (C) Inset shows a higher magnification view of neurons in the UCP and LCP. The red channel is shown using the Fire lookup table to emphasize intracellular calcium differences. (D) Quantification of R/G ratio across the cortical plate (CP). The horizontal dashed line is the average of the CP R/G ratios. The solid line shows a simple linear regression line of the R/G ratios across the CP and reveals an elevated R/G ratio in the UCP compared to LCP. (E) R/G ratios from neurons in the UCP (0.82 ± 0.50, mean ± s.d.) vs. in the neurons in the LCP (0.61 ± 0.27), p = 0.0002. Black bars represent the mean. (F) Percent of active cells (R/G > 0.45) in the UCP (6.33 ± 8.3) compared to the LCP (2.19 ± 4.2), p = 0.049. Unpaired one-tailed t-tests were used for comparing the R/G ratio and % active cells. Significance: * p ≤ 0.05, *** p ≤ 0.001. n = 5 explants. Scale bar: 10 μm.
Figure 4
Figure 4
Veratridine (VRT) stimulation targeting CRNs induces a rapid calcium (GCaMP6s) signal transient in CPNs. (A) Experimental design: CAG-GCaMP6s plasmid was electroporated into the developing cortex on E13. Whole hemisphere explants were cultured for 2 days before 2-photon live imaging. (B) Example field of neurons imaged during live GCaMP6s imaging (CP: Cortical plate, IZ: Intermediate zone). Cells were analyzed in two areas (Field 1 and Field 2) and revealed a calcium transient approximately 2 min after bath application of VRT at 12 min. (C,D) Quantification of the VRT response in (C) post-migratory and (D) translocating neurons revealed a 2–3-fold increase in calcium signal (F/F0) from both populations. Gray lines are individual traces, red and green lines are the average. Scale bar: 15 μm.
Figure 5
Figure 5
Veratridine (VRT) stimulation targeting CRNs elevated the intracellular calcium signal (CaMPARI2 R/G) in CPNs, and glutamatergic and glycinergic antagonists partially block the response. (A) Experimental design: CAG-CaMPARI2 plasmid was electroporated on E13 and whole hemisphere explants were cultured for 2 days prior to pharmacological challenge on E15. (B,C) VRT caused an increase in the R/G ratio in post-migratory CPN in the UCP (MZ: Marginal zone, CP: Cortical plate). (DG) CaMPARI2-expressing explants were incubated for 30 min with antagonists before VRT stimulation. (H) The highlighted region in (B) shows the area of neuronal quantification in the UCP. Bars indicate the mean value. VRT caused a 2.3-fold increase in R/G ratio compared to control (1.0 ± 0.02 vs. 0.43 ± 0.013, respectively, p < 0.0001). Pan-neuronal block reduced the VRT to 1.63-fold of control (0.70 ± 0.03), p < 0.0001). Glycinergic block reduced the VRT 1.95-fold of control (0.84 ± 0.03, p < 0.0001). GABAergic block did not significantly affect the VRT response (0.95 ± 0.03, p = 0.87). Pan-glutamatergic block reduced the VRT response to 1.51-fold over control (0.65 ± 0.02, p < 0.0001). (I) TTX (tetrodotoxin) pretreatment reduced VRT response to 1.44-fold over control (0.63 ± 0.03 vs. 1.0 ± 0.02, p < 0.0001) (J) In the absence of VRT stimulation, 30 min pretreatment with a glycinergic antagonist (0.21 ± 0.01, p<0.0001), pan-glutamatergic antagonists (0.3 ± 0.02, p < 0.0001), or TTX (0.17 ± 0.01, p < 0.0001) reduced calcium (CaMPARI2 ratio) compared to control (0.43 ± 0.013), indicating baseline intracellular calcium levels are maintained by ongoing NT signaling. Comparisons were made using ordinary one-way ANOVA and Šidák’s multiple comparisons. Data from a minimum of five explants in each condition. Significance: ns p > 0.05, **** p ≤ 0.0001 (Labels in red are a comparison to VRT, labels in green are a comparison to Control). Scale bar: 30 μm. Outset scalebar: 10 μm.
Figure 6
Figure 6
Glutamatergic antagonists rapidly lower baseline intracellular calcium (GCaMP6s) signal in CPN. (A) Experimental design: Nestin-Cre X Ai96 (GCaMP6s) hemispheres were cultured on E15, and antagonists were applied at Time = 0 while imaging. (B) Baseline intracellular calcium (GCaMP6s) levels and (C) calcium levels 10 min after glutamatergic antagonist application. (Shown in the Fire lookup table, MZ: Marginal zone, CP: Cortical plate) (D) Traces of somal signal in both CRNs and CPNs during imaging. (E) Glutamatergic antagonists did not alter GCaMP6s signal in CRNs (52.6 ± 2.1, mean ± s.e.m.) vs. baseline (60.1 ± 3.8, p = 0.70). Glutamatergic blockade did disrupt GCaMP6s signal in the CPNs (48.4 ± 4.0) relative to baseline (68.5 ± 4.8, p = 0.001). There was no significant difference between the treatment groups in the meninges (baseline 24.3 ± 1.1 vs. block 40.7 ± 4.0, p = 0.42). Comparisons were made using ordinary one-way ANOVA and Šidák’s multiple comparisons. n = 2 explant, at least 7 neurons of each class. Significance: ns p > 0.05, ** p ≤ 0.01. Scale bar: 20 μm.
Figure 7
Figure 7
Pan-glutamatergic blockade and activity blockade for 24 h reduces the number of neurons migrating into the CP. (A) Experimental design: CAG-GFP plasmid was electroporated into the developing cortex on E13. Whole hemisphere explants were cultured for 1 day before being incubated with either pan-glutamatergic blockers or activity or TTX for an additional 24 h. (B,C,E) Pan-glutamatergic blockade reduces the percent of GFP+ neurons in the CP (38% reduction, p = 0.001) (MZ: Marginal zone, CP: Cortical plate, IZ: Intermediate zone). (D,E) Activity blockade by TTX also caused a 42% reduction of GFP+ neurons in the CP (p = 0.003). (EG) Similarly, a 15% reduction of CTIP1 immunopositive neurons in the CP was found with pan-glutamatergic blockade (p = 0.014). (H) No differences were seen in dendritic growth into the MZ in either pan-glutamatergic blockade or activity blockade groups. Unpaired one-tailed t-tests were used to compare the MZ/CP dendrite growth ratios and the CP/(CP + IZ) migration ratios. Data from a minimum of three explants in each condition. Significance: ns p > 0.05, * p ≤ 0.05, ** p ≤ 0.01. Scale bar: 10 μm.
Figure 8
Figure 8
Misexpression of a voltage-dependent sodium channel (bacterial mNaChBac) or a voltage-dependent calcium channel (bacterial CavMr) inhibited migration into the CP and increased dendritic growth into MZ. (A) Experimental design: Control CAG-GFP or ion channel expressing plasmids were co-electroporated with CAG-tdTomato plasmid on E13. Whole hemispheres were cultured for 2 days before being processed for histology. (B) Control section compared with (MZ: Marginal zone, CP: Cortical plate, IZ: Intermediate zone) (C) CavMr and (D) mNaChBac misexpression sections and immunostained for 6×His and FLAG tags, respectively. Greater fractions of neurons were found below the CP in the ion channel misexpressing explants compared to control (EG). Higher magnification image of the upper CP/MZ showing increased dendritic growth into the MZ in explants expressing CavMr and mNaChBac. (H) CavMr misexpression caused a 42% decrease in the CP/(CP + IZ) migration ratio compared to control (p = 0.029). mNaChBac misexpression caused a 40% decrease in CP migration ratio compared to control (p = 0.035). However, compared to control (0.53 ± 0.06), dendritic projection in the MZ was increased by 74% after CavMr misexpression (0.92 ± 0.14, p = 0.034) and increased 91% by mNaChBac (1.01 ± 0.13, p = 0.009). Comparisons were made using ordinary one-way ANOVA and Šidák’s multiple comparisons. Data from a minimum of four explants in each condition. Significance: * p ≤ 0.05, ** p ≤ 0.01. Scale bars: (BD), 50 μm (EG), 20 μm.
Figure 9
Figure 9
Ethanol exposure does not acutely alter baseline CaMPARI2 signal or disrupt the VRT response. (A) Experimental design: CAG-CaMPARI2 plasmid was electroporated into ventricular progenitors of the developing cortex on E13. Whole hemispheres were cultured for 2 days before ethanol (EtOH) treatment and processing for histology. (B) There was no significant difference in CaMPARI2 signal between EtOH-treated (400 mg/dL, 30 min) explants and control (0.69 ± 0.03 vs. 0.60 ± 0.02, p = 0.64). EtOH pretreatment also failed to block the VRT response (1.02 ± 0.05 vs. 1.01 ± 0.05, p > 0.99). Black bar represents the mean. Comparisons were made using ordinary one-way ANOVA and Šidák’s multiple comparisons. Significance: ns p > 0.05, **** p ≤ 0.0001. Data from a minimum of three explants in each condition.
Figure 10
Figure 10
Model of Cajal-Retzius neuron to Cortical Projection Neuron signaling. Intrinsic properties of CRNs generate (1) spontaneous activity in CRNs. Spontaneous activity in the Cajal-Retzius neurons leads to (2) glutamate and glycine secretion. (3) Secreted glutamate and glycine cause additional Cajal-Retzius neuron activity and intracellular calcium elevations, and dendritic growth in Cortical Projection Neurons. (4) Misexpression of bacterial ion channels (CavMr and mNaChBac) prematurely enhances calcium signaling, causing dendritic elaboration and migration arrest.

Similar articles

Cited by

References

    1. Pinto Lord M.C., Caviness V.S., Jr. Determinants of cell shape and orientation: A comparative Golgi analysis of cell-axon interrelationships in the developing neocortex of normal and reeler mice. J. Comp. Neurol. 1979;187:49–69. doi: 10.1002/cne.901870104. - DOI - PubMed
    1. Olson E.C., Kim S., Walsh C.A. Impaired neuronal positioning and dendritogenesis in the neocortex after cell-autonomous Dab1 suppression. J. Neurosci. 2006;26:1767–1775. doi: 10.1523/JNEUROSCI.3000-05.2006. - DOI - PMC - PubMed
    1. O’Dell R.S., Cameron D.A., Zipfel W.R., Olson E.C. Reelin Prevents Apical Neurite Retraction during Terminal Translocation and Dendrite Initiation. J. Neurosci. 2015;35:10659–10674. doi: 10.1523/JNEUROSCI.1629-15.2015. - DOI - PMC - PubMed
    1. Marin-Padilla M. Human cerebral cortex Cajal-Retzius neuron: Development, structure and function. A Golgi study. Front. Neuroanat. 2015;9:21. doi: 10.3389/fnana.2015.00021. - DOI - PMC - PubMed
    1. Elorriaga V., Pierani A., Causeret F. Cajal-retzius cells: Recent advances in identity and function. Curr. Opin. Neurobiol. 2023;79:102686. doi: 10.1016/j.conb.2023.102686. - DOI - PubMed

LinkOut - more resources