. 2023 Aug 19;24(16):12981.
doi: 10.3390/ijms241612981.

Ubiquitination Is a Novel Post-Translational Modification of VMP1 in Autophagy of Human Tumor Cells

Affiliations

Ubiquitination Is a Novel Post-Translational Modification of VMP1 in Autophagy of Human Tumor Cells

Felipe J Renna et al. Int J Mol Sci. .

Abstract

Autophagy is a tightly regulated catabolic process involved in the degradation and recycling of proteins and organelles. Ubiquitination plays an important role in the regulation of autophagy. Vacuole Membrane Protein 1 (VMP1) is an essential autophagy protein. The expression of VMP1 in pancreatic cancer stem cells carrying the activated Kirsten rat sarcoma viral oncogene homolog (KRAS) triggers autophagy and enables therapy resistance. Using biochemical and cellular approaches, we identified ubiquitination as a post-translational modification of VMP1 from the initial steps in autophagosome biogenesis. VMP1 remains ubiquitinated as part of the autophagosome membrane throughout autophagic flux until autolysosome formation. However, VMP1 is not degraded by autophagy, nor by the ubiquitin-proteasomal system. Mass spectrometry and immunoprecipitation showed that the cell division cycle protein cdt2 (Cdt2), the substrate recognition subunit of the E3 ligase complex associated with cancer, cullin-RING ubiquitin ligase complex 4 (CRL4), is a novel interactor of VMP1 and is involved in VMP1 ubiquitination. VMP1 ubiquitination decreases under the CRL inhibitor MLN4924 and increases with Cdt2 overexpression. Moreover, VMP1 recruitment and autophagosome formation is significantly affected by CRL inhibition. Our results indicate that ubiquitination is a novel post-translational modification of VMP1 during autophagy in human tumor cells. VMP1 ubiquitination may be of clinical relevance in tumor-cell-therapy resistance.

Keywords: DFCP1; VMP1; autophagosome; tumor cells.


Conflict of interest statement

The authors declare no conflict of interest.

Figures

Figure 1
Figure 1
VMP1 is post–translationally modified by ubiquitination. (a) HeLa cells expressing empty pEGFPN1 or pEGFPN1 VMP1, or non–transfected HeLa cells were immunolabeled with anti–ubiquitin. Scale bars: 10 μm. The number of ubiquitin (Ub) dots per cell was quantified in at least 12 individual cells per condition in three independent experiments. The means per condition and the SEM are represented in the graphic. *** p < 0.001 according to a Kruskall–Wallis test. (b) HeLa cells were transfected with VMP1–GFP and immunolabeled with anti–ubiquitin. Scale bar: 10 μm. Colocalization between VMP1 and ubiquitin was quantified in 10 individual cells in three independent experiments. In the graphic, the red plots show Pearson’s correlation coefficient (PCC). *** p < 0.001 according to a two–tailed Student’s t–test vs. the theoretical mean, 0.5. (c) Lysates from HEK293T cells transfected with FLAG–Ub, VMP1–GFP, and the combination of both were immunoprecipitated with anti–FLAG magnetic beads and immunoblotted with anti–VMP1. Several bands over VMP1–GFP’s molecular weight (73 kDa) appeared in the eluate of co–transfected cells, indicating VMP1 ubiquitination. The image is representative of three independent experiments. (d) Lysates from HEK293T cells transfected with VMP1–GFP were immunoprecipitated with anti–GFP magnetic beads and immunoblotted with anti–Ub. Several bands over VMP1–GFP’s molecular weight (73 kDa) appeared in the eluate, indicating VMP1 ubiquitination.
Figure 2
Figure 2
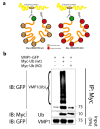
VMP1 is not monoubiquitinated with Myc–Ub (K0). (a) Schematic representation of Myc–Ub (K0) and Myc–Ub (wt) showing that Myc–Ub (K0) had its seven lysine residues replaced by arginine residues. In this way, Myc–Ub (K0) is only able to achieve monoubiquitination. (b) Lysates from HEK293T cells transfected with VMP1–GFP and Myc–Ub (wt) or Myc–Ub (K0) were immunoprecipitated with anti–Myc linked to protein G–Sepharose. The immunoblot with anti–GFP showed that there were no ubiquitination bands in the eluates from Myc–Ub (K0)–expressing cells, indicating that VMP1 is not monoubiquitinated. In contrast, eluates from Myc–Ub (wt)–expressing cells showed several bands corresponding to the polyubiquitination of VMP1. The image is representative of three independent experiments. K0 Ub: lysine–free ubiquitin; wt: wild type.
Figure 3
Figure 3
VMP1 is not degraded by the ubiquitin–proteasomal system, nor by autophagy. (a) Western blotting for VMP1, ubiquitin, and actin, where actin served as a loading control. HEK293T cells were transfected with VMP1–GFP and treated with or without the proteasome inhibitor MG132 (10 μM) over 6 h. The images are representative of three independent experiments. (b) Quantification of relative densitometry shows that VMP1–GFP (VMP1–GFP/actin) does not change significantly after treatment with MG132. (c) Relative densitometry (ubiquitin/actin) shows that ubiquitin levels increase significantly after MG132 treatment, indicating that the proteasome was effectively blocked. ** p < 0.01 vs. basal according to a Mann–Whitney nonparametric test; n = 3. (d) Western blotting for GFP and α–tubulin, where α–tubulin served as a loading control. HEK293T cells were transfected with VMP1–GFP and treated with 100 μg/mL of cycloheximide (CHX) over 0, 2, 4, 8, or 16 h. The images are representative of three independent experiments. (e) The graphic shows the means and SEMs of relative densitometry (VMP1–GFP/α–tubulin) in relation to the relative densitometry at 0 h; n = 3 for each experiment. (f) Western blotting for GFP and α–tubulin. HEK293T cells were transfected with VMP1–GFP and treated with CHX (100 μg/mL) and MG132 (10 μM) over 0, 2, 4, 8, or 16 h. The images are representative of three independent experiments. (g) The graphic shows the means and SEMs of relative densitometry (VMP1–GFP/α–tubulin) in relation to the relative densitometry at 0 h; n = 3 for each experiment. (h) Western blotting for VMP1, microtubule-associated protein 1 light–chain 3 (LC3), and actin, where actin served as a loading control. HEK 293T cells were transfected with VMP1–GFP and treated with or without 50 μM of the lysosome inhibitor chloroquine (CQ) over 24 h. The images are representative of three independent experiments. (i) Quantification of relative densitometry showed that VMP1–GFP (VMP1–GFP/actin) does not accumulate after treatment with CQ. In fact, VMP1–GFP significantly decreased in CQ–treated cells. * p < 0.05 vs. basal according to a Mann–Whitney nonparametric test; n = 3. (j) Relative densitometry (LC3–II/actin) showed that LC3–II levels significantly increased after CQ treatment, indicating that the lysosomal pathway was effectively blocked. *** p < 0.001 vs. basal according to a Mann–Whitney nonparametric test; n = 3. (k) Western blotting for GFP, LC3, and α–tubulin. HEK293T cells were transfected with VMP1–GFP and treated with CHX (100 μg/mL) and CQ (100 μM) over 0, 2, 4, or 8 h, or CHX 100 (μg/mL) and CQ (50 μM) over 16 h. The images are representative of three independent experiments. (l) The graphic shows the means and SEMs of relative densitometry (VMP1–GFP/α–tubulin) in relation to the relative densitometry at 0 h; n = 3 for each experiment.
Figure 4
Figure 4
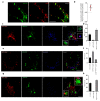
VMP1 associated with ubiquitin is involved in the autophagic process. (a) HeLa cells were transfected with VMP1–GFP and immunolabeled with anti-ubiquitin and anti–LC3. Scale bar: 10 μm. The images are representative of three independent experiments. The area bounded by the dotted line shows a perinuclear zone where the VMP1 that was not associated with Ub did not recruit LC3. (b) The square magnifications show examples of VMP1 dots that are associated with Ub and LC3. (c) Quantification of LC3 dots per cell associated with ubiquitin, VMP1, or ubiquitin and VMP1. *** p < 0.001 according to two–way ANOVA vs. Ub and VMP1 groups. n = 10 cells in three independent experiments. (d) Lysates from HEK293T cells that transfected with VMP1–GFP, FLAG–Ub and RFP–LC3 were immunoprecipitated with anti–GFP magnetic beads. The eluates were immunoblotted with anti–FLAG and anti–LC3. LC3 immunoblot shows a band of 41 kDa indicating the presence of RFP–LC3–II in the eluates. FLAG immunoblot shows the presence of ubiquitinated VMP1–GFP. (e) HeLa cells were transfected with VMP1–DsRed and GFP–DFCP1 and immunolabeled with anti–Ub. Scale bar: 10 μm. Arrows point to VMP1 dots that are associated with Ub and DFCP1. (f) Quantification of VMP1 dots per cell associated with DFCP1, ubiquitin, or ubiquitin and DFCP1. The graphic shows the means and SEMs. n = 10 cells in three independent experiments.
Figure 5
Figure 5
VMP1 remains ubiquitinated in the autophagic flux until it reaches the autolysosome. (a) HeLa cells were transfected with VMP1–GFP and immunolabeled with anti-LAMP2. Scale bars: 10 μm. (b) Colocalization between VMP1 and lysosome–associated membrane glycoprotein 2 (LAMP2) was quantified by Pearson’s correlation coefficient (PCC). Similar results were obtained in three independent experiments. The red plots show PCC for individual cells; n = 10. *** p < 0.001 according to a Kruskall–Wallis test. (c) HeLa cells were transfected with VMP1–DsRed and LAMP1–YFPs and immunolabeled with anti–LC3. Scale bar: 10 μm. Arrows point to VMP1 dots that are associated with lysosome–associated membrane glycoprotein 1 (LAMP1) and LC3. (d) Quantification of VMP1 dots per cell associated with LC3, LAMP1, and LC3–LAMP1. The graphic shows the means and SEMs. n = 10 cells in three independent experiments. (e) HeLa cells were transfected with VMP1–DsRed and GFP–DFCP1 and labeled with Lysotracker Blue DND–22. Scale bar: 10 μm. (f) The graphic shows the means and SEMs of the VMP1 dots associated with DFCP1, Lysotracker, or DFCP1 and Lysotracker. n = 10 cells in three independent experiments. (g) HeLa cells were transfected with VMP1–DsRed and LAMP1–YFPs and immunolabeled with anti–Ub. Scale bar: 10 μm. Arrows point to VMP1 dots that are associated with Ub and LAMP1. (h) Quantification of VMP1 dots per cell associated with ubiquitin, LAMP1, and Ub–LAMP1. The graphic shows the means and SEMs. n = 10 cells in three independent experiments. YFP: yellow fluorescent protein.
Figure 6
Figure 6
Cdt2 is involved in the ubiquitination of VMP1. (a) Schematic representation of the E3 ligase complex cullin–RING ubiquitin ligase complex 4 (CRL4)/Cdt2, in which the cell division cycle protein cdt2 (Cdt2) works as the substrate recognition subunit. (b) Table of main interactors of Cdt2 identified by MS of the sequential immunoprecipitation with anti–FLAG and anti–HA of soluble-fraction (non–chromatin–fraction) HEK293T cells transfected with FLAG–HA–Cdt2. VMP1 was found between the interactors. (c) Lysates from HEK293T cells transfected with Myc–Cdt2 and VMP1–FLAG were immunoprecipitated with anti–FLAG magnetic beads and immunoblotted with anti–Myc. (d) Lysates from HEK293T cells transfected with FLAG–Cdt2 were immunoprecipitated with anti–FLAG magnetic beads and immunoblotted with anti–VMP1. (e) HeLa cells were immunolabeled with anti–Cdt2. Scale bar: 10 μm. (f) HeLa cells were transfected with VMP1–GFP and immunolabeled with anti-Cdt2. Scale bar: 10 μm. Arrowheads point to VMP1 dots that co–distribute with Cdt2. (g) Endogenous Cdt2 localization was measured as the ratio between the extranuclear and intranuclear integrated density of fluorescence in VMP1–GFP– and non–transfected HeLa cells. *** p < 0.001 vs. control according to a Mann–Whitney nonparametric test. (h) Lysates from HEK293T cells transfected with VMP1–GFP and Myc–Ub with or without Cdt2–FLAG, and treated or not with MLN4924 (1 μM, 5 h), were immunoprecipitated with anti–Myc linked to protein G–Sepharose. The eluates were immunoblotted with anti–GFP. Ubiquitinated VMP1 increased in the presence of Cdt2–FLAG and decreased under treatment with MLN4924. Myc–Ub (K0) was used as a negative control. The images are representative of three independent experiments.
Figure 7
Figure 7
The distribution of VMP1 and its ability to trigger autophagy are both affected by treatment with MLN4924, a CRL inhibitor. (a) HeLa cells were treated with MLN4924 (1 μM, 5 h) or solvent. The cells were then immunolabeled with anti–LC3. Representative images are shown. Scale bar: 10 μm. (b) The number of LC3 dots per cell was quantified in both the control and MLN4924–treated cells. N = 13 cells per condition from three independent experiments. (c) Western blotting for LC3 and α–tubulin where α–tubulin served as a loading control. HEK293T cells were transfected with Empty–GFP and either treated with MLN4924 (1 μM, 5 h) or solvent. Images are representative of three independent experiments. (d) Quantification of relative densitometry shows LC3–II (LC3–II/α–tubulin) does not change significantly after treatment with MLN4924. N:3. (e) HeLa cells were transfected with pLenti–VMP1–GFP and either treated with MLN4924 (1 μM, 5 h) or solvent. The cells were then immunolabeled with anti–LC3. Representative images are shown. Scale bar: 10 μm. (f) The number of VMP1 dots per cell was significantly reduced in MLN4924–treated cells. The graph shows the means and SEMs of 18 control cells and 22 MLN4924–treated cells across three independent experiments. *** p < 0.001 vs. Control by Mann–Whitney test. (g) The number of LC3 dots per cell was also significantly reduced in MLN4924–treated cells compared to control. The means and SEMs are shown in the graph. The analysis was based on 18 control cells and 17 MLN4924–treated cells across three independent experiments. * p < 0.05 vs. Control by Mann–Whitney test. (h) Western blotting for LC3 and α–tubulin where α–tubulin served as a loading control. HEK293T cells were transfected with pLenti–VMP1–GFP and either treated with MLN4924 (1 μM, 5 h) or solvent. Images are representative of four independent experiments (i) Quantification of relative densitometry shows LC3–II (LC3–II/α–tubulin) significantly decrease after treatment with MLN4924. * p < 0.05 vs. Control by Student’s t test. N = 4.
Figure 8
Figure 8
Schematic model. VMP1 is ubiquitinated in the initial steps of autophagosome biogenesis and remains ubiquitinated throughout the autophagic flux until autolysosome formation. Moreover, VMP1 interacts with Cdt2, the adaptor subunit of the CRL4/Cdt2 E3 ligase complex, which is able to catalyze the VMP1 ubiquitination. ER: endoplasmic reticulum.

References

    1. Glick D., Barth S., Macleod K.F. Autophagy: Cellular and Molecular Mechanisms. J. Pathol. 2010;221:3–12. doi: 10.1002/path.2697. - DOI - PMC - PubMed
    1. Parzych K.R., Klionsky D.J. An Overview of Autophagy: Morphology, Mechanism, and Regulation. Antioxid. Redox Signal. 2014;20:460–473. doi: 10.1089/ars.2013.5371. - DOI - PMC - PubMed
    1. Yang Z., Klionsky D.J. Mammalian autophagy: Core molecular machinery and signaling regulation. Curr. Opin. Cell Biol. 2010;22:124–131. doi: 10.1016/j.ceb.2009.11.014. - DOI - PMC - PubMed
    1. Wani W.Y., Boyer-Guittaut M., Dodson M., Chatham J., Darley-Usmar V., Zhang J. Regulation of autophagy by protein post-translational modification. Lab. Investig. 2015;95:14–25. doi: 10.1038/labinvest.2014.131. - DOI - PMC - PubMed
    1. Chen R.H., Chen Y.H., Huang T.Y. Ubiquitin-mediated regulation of autophagy. J. Biomed. Sci. 2019;26:80. doi: 10.1186/s12929-019-0569-y. - DOI - PMC - PubMed