. 2023 Aug 19;24(16):12985.
doi: 10.3390/ijms241612985.

Interleukin 6 (IL-6) Regulates GABAA Receptors in the Dorsomedial Hypothalamus Nucleus (DMH) through Activation of the JAK/STAT Pathway to Affect Heart Rate Variability in Stressed Rats

Affiliations

Interleukin 6 (IL-6) Regulates GABAA Receptors in the Dorsomedial Hypothalamus Nucleus (DMH) through Activation of the JAK/STAT Pathway to Affect Heart Rate Variability in Stressed Rats

Lihua Zhang et al. Int J Mol Sci. .

Abstract

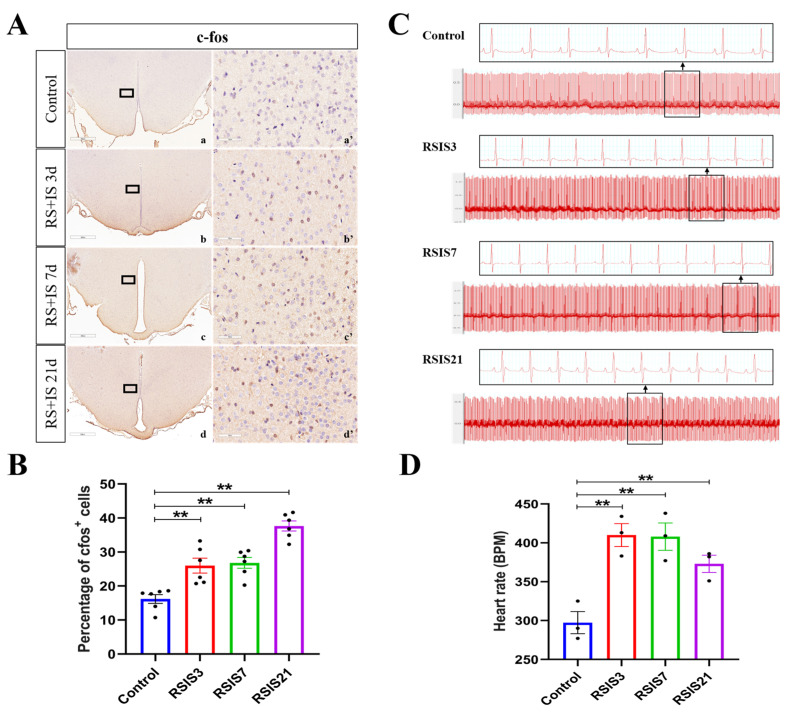
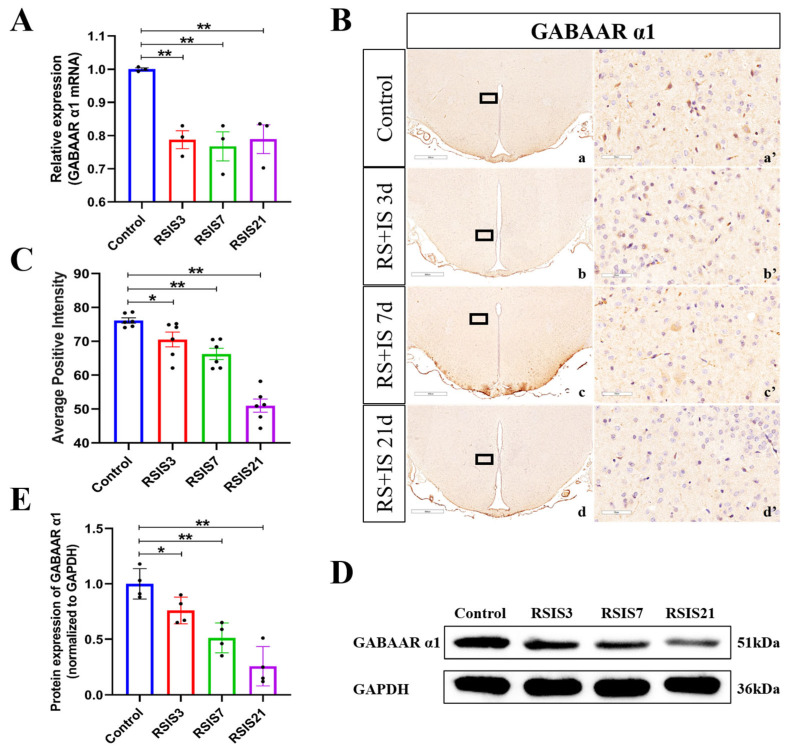
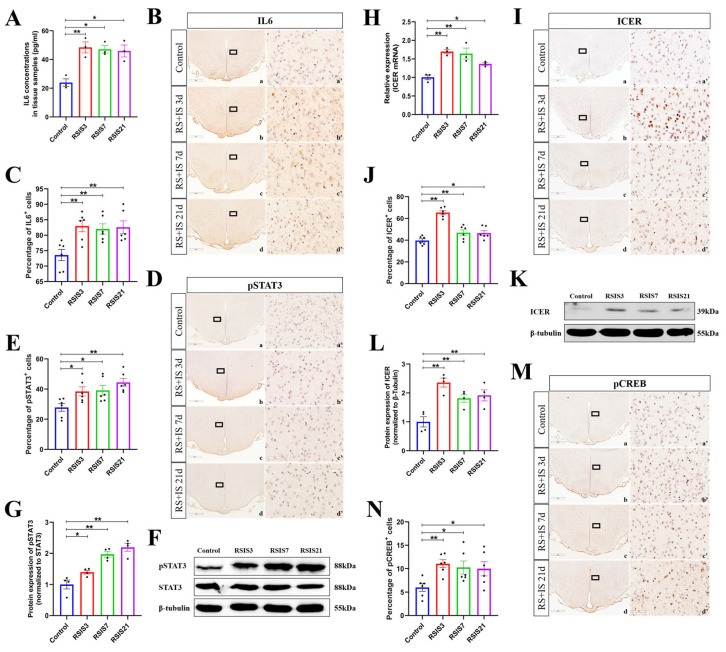
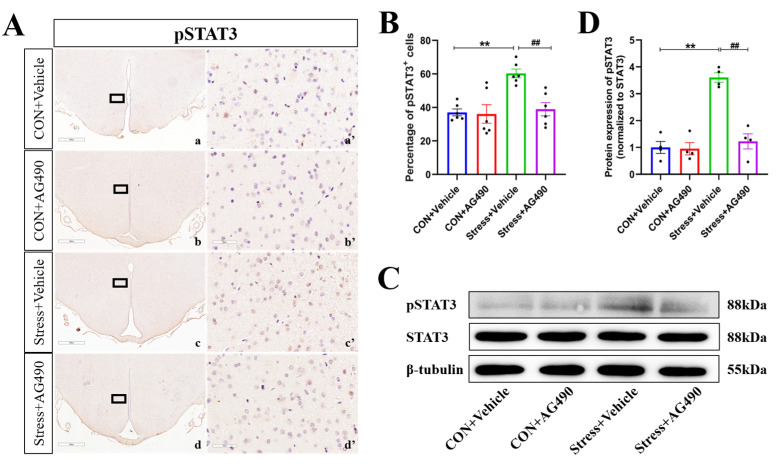
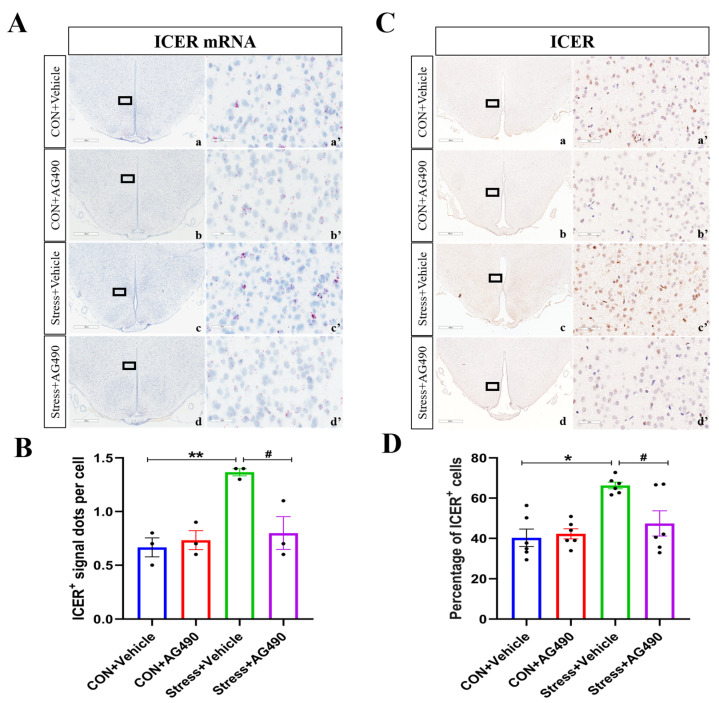
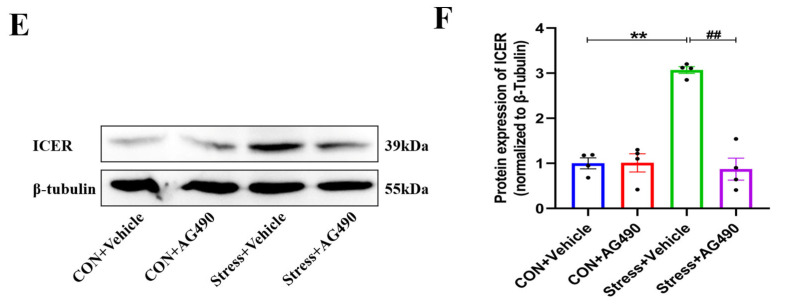
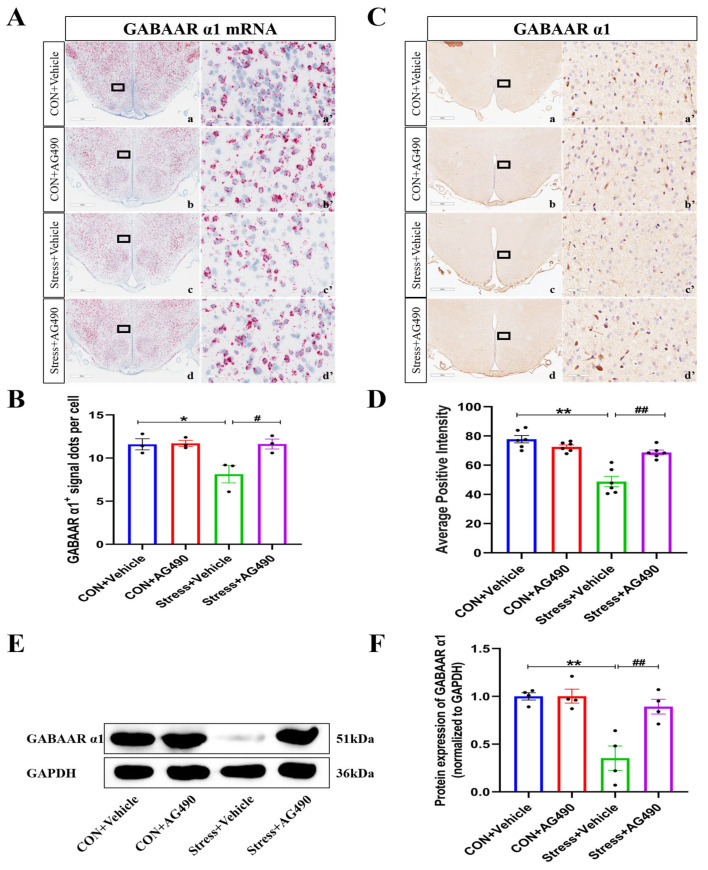
The dorsomedial hypothalamus nucleus (DMH) is an important component of the autonomic nervous system and plays a critical role in regulating the sympathetic outputs of the heart. Stress alters the neuronal activity of the DMH, affecting sympathetic outputs and triggering heart rate variability. However, the specific molecular mechanisms behind stress leading to abnormal DMH neuronal activity have still not been fully elucidated. Therefore, in the present study, we successfully constructed a stressed rat model and used it to investigate the potential molecular mechanisms by which IL-6 regulates GABAA receptors in the DMH through activation of the JAK/STAT pathway and thus affects heart rate variability in rats. By detecting the c-Fos expression of neurons in the DMH and electrocardiogram (ECG) changes in rats, we clarified the relationship between abnormal DMH neuronal activity and heart rate variability in stressed rats. Then, using ELISA, immunohistochemical staining, Western blotting, RT-qPCR, and RNAscope, we further explored the correlation between the IL-6/JAK/STAT signaling pathway and GABAA receptors. The data showed that an increase in IL-6 induced by stress inhibited GABAA receptors in DMH neurons by activating the JAK/STAT signaling pathway, while specific inhibition of the JAK/STAT signaling pathway using AG490 obviously reduced DMH neuronal activity and improved heart rate variability in rats. These findings suggest that IL-6 regulates the expression of GABAA receptors via the activation of the JAK/STAT pathway in the DMH, which may be an important cause of heart rate variability in stressed rats.

Keywords: GABAA receptor; JAK/STAT; dorsomedial hypothalamus nucleus; heart rate; stress.


Conflict of interest statement

The authors declare no conflict of interest.

Figures

Figure 1
Figure 1
Stress-induced enhancement of DMH neuronal activity increased heart rate. (A,B) Representative micrographs and quantitative analysis of c-Fos immunohistochemical staining in DMH (n = 6). (a’d’) are the magnified areas of (ad), respectively. Scale bar = 900 µm in (ad); scale bar = 50 µm in (a’d’). (C) Representative ECG records of rats. (D) Changes in heart rate in rats (n = 3). Values are expressed as the mean ± SEM, ** p < 0.01 vs. the control group.
Figure 2
Figure 2
Stress decreased the expression of the GABAAR α1 subunit. (A) The mRNA level of GABAA receptor α1 subunit (n = 3). (B,C) Representative micrographs and quantitative analysis of GABAAR α1 subunit immunohistochemical staining in DMH (n = 6). (a’d’) are the magnified areas of (ad), respectively. Scale bar = 900 µm in (ad); scale bar = 50 µm in (a’d’). (D,E) Representative Western blot images and densitometric quantification of GABAAR α1 subunit in the DMH (n = 4). Values are expressed as the mean ± SEM, * p < 0.05, ** p < 0.01 vs. the control group.
Figure 3
Figure 3
Stress-induced increase in IL-6 activated the JAK/STAT pathway, promoting the expression of the downstream molecule ICER. (A) IL6 content in DMH (n = 3). (B,C) Representative micrographs and quantitative analysis of IL-6 immunohistochemical staining in DMH (n = 6). (a’d’) are the magnified areas of (ad), respectively. Scale bar = 900 µm in (ad); scale bar = 50 µm in (a’d’). (D,E) Representative micrographs and quantitative analysis of pSTAT3 immunohistochemical staining in DMH (n = 6). (a’d’) are the magnified areas of (ad), respectively. Scale bar = 900 µm in (ad); scale bar = 50 µm in (a’d’). (F,G) Representative Western blot images and densitometric quantification of pSTAT3 in the DMH (n = 4). (H) The mRNA level of ICER (n = 3). (I,J) Representative micrographs and quantitative analysis of ICER immunohistochemical staining in DMH (n = 6). (a’d’) are the magnified areas of (ad), respectively. Scale bar = 900 µm in (ad); scale bar = 50 µm in (a’d’). (K,L) Representative Western blot images and densitometric quantification of ICER in the DMH (n = 4). (M,N) Representative micrographs and quantitative analysis of pCREB immunohistochemical staining in DMH (n = 6). (a’d’) are the magnified areas of (ad), respectively. Scale bar = 900 µm in (a–d); scale bar = 50 µm in (ad’). Values are expressed as the mean ± SEM, * p < 0.05, ** p < 0.01 vs. the control group.
Figure 4
Figure 4
AG490 treatment inhibited the levels of pSTAT3 in stressed rats. (A,B) Representative micrographs and quantitative analysis of pSTAT3 immunohistochemical staining in DMH after AG490 treatment (n = 6). (a’d’) are the magnified areas of (ad), respectively. Scale bar = 900 µm in (ad); scale bar = 50 µm in (a’d’). (C,D) Representative Western blot images and densitometric quantification of pSTAT3 in the DMH (n = 4). Values are expressed as the mean ± SEM, ** p < 0.01, ## p < 0.01 vs. the control group.
Figure 5
Figure 5
AG490 treatment reduced the expression of ICER in the DMH of stressed rats. (A) Representative micrographs of ICER RNAscope in DMH after AG490 treatment. (a’d’) are the magnified areas of (ad), respectively. Scale bar = 900 µm in (ad); scale bar = 50 µm in (a’d’). (B) The average number of ICER positive signal dots per cell in DMH after AG490 treatment (n = 3). (C,D) Representative micrographs and quantitative analysis of ICER immunohistochemical staining in DMH after AG490 treatment (n = 6). (a’d’) are the magnified areas of (ad), respectively. Scale bar = 900 µm in (ad); scale bar = 50 µm in (a’d’). (E,F) Representative Western blot images and densitometric quantification of ICER in the DMH (n = 4). Values are expressed as the mean ± SEM, * p < 0.05, ** p < 0.01, # p < 0.05, ## p < 0.01 vs. the control group.
Figure 5
Figure 5
AG490 treatment reduced the expression of ICER in the DMH of stressed rats. (A) Representative micrographs of ICER RNAscope in DMH after AG490 treatment. (a’d’) are the magnified areas of (ad), respectively. Scale bar = 900 µm in (ad); scale bar = 50 µm in (a’d’). (B) The average number of ICER positive signal dots per cell in DMH after AG490 treatment (n = 3). (C,D) Representative micrographs and quantitative analysis of ICER immunohistochemical staining in DMH after AG490 treatment (n = 6). (a’d’) are the magnified areas of (ad), respectively. Scale bar = 900 µm in (ad); scale bar = 50 µm in (a’d’). (E,F) Representative Western blot images and densitometric quantification of ICER in the DMH (n = 4). Values are expressed as the mean ± SEM, * p < 0.05, ** p < 0.01, # p < 0.05, ## p < 0.01 vs. the control group.
Figure 6
Figure 6
AG490 treatment alleviated the stress-induced decrease in the GABAAR α1 subunit. (A) Representative micrographs of GABAAR α1 subunit RNAscope in DMH after AG490 treatment. (a’d’) are the magnified areas of (ad), respectively. Scale bar = 900 µm in (ad); scale bar = 50 µm in (a’d’). (B) The average number of GABAAR α1 subunit positive signal dots per cell in DMH after AG490 treatment (n = 3). (C,D) Representative micrographs and quantitative analysis of GABAAR α1 subunit immunohistochemical staining in DMH after AG490 treatment (n = 6). (a’d’) are the magnified areas of (ad), respectively. Scale bar = 900 µm in (ad); scale bar = 50 µm in (a’d’). (E,F) Representative Western blot images and densitometric quantification of GABAAR α1 subunit in the DMH (n = 4). Values are expressed as the mean ± SEM, * p < 0.05, ** p < 0.01, # p < 0.05, ## p < 0.01 vs. the control group.
Figure 7
Figure 7
AG490 treatment reduced DMH neuronal activity and improved tachycardia in stressed rats. (A,B) Representative micrographs and quantitative analysis of c-Fos immunohistochemical staining in DMH after AG490 treatment (n = 6). (a’d’) are the magnified areas of (ad), respectively. Scale bar = 900 µm in (ad); scale bar = 50 µm in (a’d’). (C) Representative ECG records of rats after AG490 treatment. (D) Changes in heart rate in rats (n = 4). Values are expressed as the mean ± SEM, ** p < 0.01, # p < 0.05, ## p < 0.01 vs. the control group.

Similar articles

Cited by

References

    1. Hammadah M., Kim J.H., Al Mheid I., Samman Tahhan A., Wilmot K., Ramadan R., Alkhoder A., Khayata M., Mekonnen G., Levantsevych O., et al. Coronary and Peripheral Vasomotor Responses to Mental Stress. J. Am. Heart Assoc. 2018;7:e008532. doi: 10.1161/JAHA.118.008532. - DOI - PMC - PubMed
    1. Steptoe A., Kivimäki M. Stress and cardiovascular disease. Nat. Rev. Cardiol. 2012;9:360–370. doi: 10.1038/nrcardio.2012.45. - DOI - PubMed
    1. Kivimaki M., Virtanen M., Elovainio M., Kouvonen A., Vaananen A., Vahtera J. Work stress in the etiology of coronary heart disease—A meta-analysis. Scand. J. Work Environ. Health. 2006;32:431–442. doi: 10.5271/sjweh.1049. - DOI - PubMed
    1. Kyrou I., Tsigos C. Stress hormones: Physiological stress and regulation of metabolism. Curr. Opin. Pharmacol. 2009;9:787–793. doi: 10.1016/j.coph.2009.08.007. - DOI - PubMed
    1. Smith P.J., Blumenthal J.A. Psychiatric and Behavioral Aspects of Cardiovascular Disease: Epidemiology, Mechanisms, and Treatment. Rev. Esp. Cardiol. 2011;64:924–933. doi: 10.1016/j.recesp.2011.06.003. - DOI - PubMed

LinkOut - more resources