. 2023 Aug 10;16(16):5554.
doi: 10.3390/ma16165554.

Wear Analysis of 3D-Printed Spur and Herringbone Gears Used in Automated Retail Kiosks Based on Computer Vision and Statistical Methods

Affiliations

Wear Analysis of 3D-Printed Spur and Herringbone Gears Used in Automated Retail Kiosks Based on Computer Vision and Statistical Methods

Jakub Bryła et al. Materials (Basel). .

Abstract

This paper focuses on a wear evaluation conducted for prototype spur and herringbone gears made from PET-G filament using additive manufacturing. The main objective of this study is to verify if 3D-printed gears can be considered a reliable choice for long-term exploitation in selected mechanical systems, specifically automated retail kiosks. For this reason, two methods were applied, utilizing: (1) vision-based inspection of the gears' cross-sectional geometry and (2) the statistical characterization of the selected kinematic parameters and torques generated by drives. The former method involves destructive testing and allows for identification of the gears' operation-induced geometric shape evolution, whereas the latter method focuses on searching for nondestructive kinematic and torque-based indicators, which allow tracking of the wear. The novel contribution presented in this paper is the conceptual and experimental application of the identification of the changes of 3D-printed parts' geometric properties resulting from wear. The inspected exploited and non-exploited 3D-printed parts underwent encasing in resin and a curing process, followed by cutting in a specific plane to reveal the desired shapes, before finally being subjected to a vision-based geometric characterization. The authors have experimentally demonstrated, in real industrial conditions, on batch production parts, the usefulness of the presented destructive testing technique providing valid indices for wear identification.

Keywords: 3D printing; additive manufacturing; automated retail kiosk; computer vision; epoxy resin encase; fused deposition modeling (FDM); fused filament fabrication (FFF); gears; material extrusion (MEX); statistical methods; wear.


Conflict of interest statement

The authors declare no conflict of interest. The funders had no role in the design of the study; in the collection, analyses, or interpretation of data; in the writing of the manuscript; or in the decision to publish the results.

Figures

Figure 1
Figure 1
Spur gear: Definitions of the geometrical parameters (a) and their values for the designed 3D-prited prototypes—design parameters (b); herringbone gear: Definition of the helix angle (c) and design parameters (d).
Figure 2
Figure 2
Schematic view of the automated retail kiosk’s inner mechanisms: Mobile cart and conveyor belts.
Figure 3
Figure 3
Keyence VHX 7000 digital microscope stand.
Figure 4
Figure 4
Cross-section image of the herringbone gear (a), as well as binarization (b) and skeleton gradient (c) errors. The gear’s helical teeth prevent it from being correctly processed by the proposed computer vision algorithm.
Figure 5
Figure 5
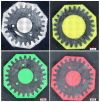
Cross-sections of the auxiliary gears encased in white, yellow, green, and red epoxy resin.
Figure 6
Figure 6
Result of the first step of the algorithm: Spur gear image with removed scale template.
Figure 7
Figure 7
Second step of the algorithm: Color space conversion from RGB to HSV (a), removal of the background corresponding to the green resin (b), and removal of black areas of the mask on the original image (c).
Figure 8
Figure 8
Third step of the algorithm that allows for removal of bright reflections and sequentially covers grayscale conversion (a), noise reduction (b), and binarization (c).
Figure 9
Figure 9
Fourth step of the algorithm: Morphological gradient/skeleton (a), identification of the two largest outlines (b), and circles describing outer and inner outlines of the gear (c).
Figure 10
Figure 10
Fifth step of the algorithm: Iterative method determining the pitch circle diameter (when the total length of the green arcs equals the total length of the red arcs); the pitch (green) and outer (blue) circle diameters are drawn on the gear’s image.
Figure 11
Figure 11
Fifth step of the algorithm: Iterative method determining the root circle diameter (when the total length of the green arcs exceeds 90% of the circle’s circumference); pitch (green) and root (blue) circle diameters are drawn on the gear’s image.
Figure 12
Figure 12
Overlapped plots for all session trajectories in the XZ-plane for a single spur gear tested. The cart was moving from the idle point to the work point along the lower path and back along the upper path.
Figure 13
Figure 13
Overlapped plots on the phase space diagrams for the trajectory of the X and Z axes for a single spur gear tested. The meshing of the spur gear teeth is visible in the Z velocity channel near the coordinate Z = 625 mm.
Figure 14
Figure 14
Raw data for the position of the X and Z axes and the velocity channels. Highlighted in green are the data ranges that passed the filtering steps.
Figure 15
Figure 15
Raw data for the torque channels of the X and Z axes. Highlighted in green are the data ranges that passed the filtering steps.
Figure 16
Figure 16
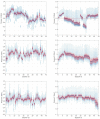
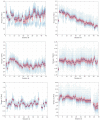
Torque in the Z-axis for the first herringbone gear tested with linear regression fitted. A detailed explanation regarding data presentation is provided in Section 3.
Figure 17
Figure 17
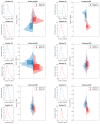
Torque distribution plot for 44 sessions of the three spur gears tested. From top to bottom, the successive horizontal pairs of plots reference the tested gears.
Figure 18
Figure 18
Torque distribution plot for 44 sessions of the three herringbone gears tested. From top to bottom, the successive horizontal pairs of plots reference the tested gears. Note: Sessions 36 and 37 for the last herringbone gear tested are missing due to temporary experimental setup failure—all recorded channels were zeroed out and retracted from the data frame.
Figure 19
Figure 19
Torque distribution plot annotations.
Figure 20
Figure 20
Torque profile for the idle position in the X and Z axes for the first spur gear tested.
Figure 21
Figure 21
Torque profile for the work and idle position in the X-axis for the first herringbone gear tested with the measured values visualized at the 0.5 Nm level and around −1 Nm, respectively.
Figure 22
Figure 22
Z-axis torque profiles for the work position at the 0.5 Nm level and the idle position (at around −1 Nm), compared for sessions 10 and 34 for the three spur gears (left column) and the three herringbone gears (right column). The sign * (asterisk) refers to the mean value.

References

    1. Wohlers T.T., Campbell I., Diegel O., Huff R., Kowen J. Wohlers Report 2020—3D Printing and Additive Manufacturing Global State of the Industry. Wohlers Associates; Fort Collins, CO, USA: 2018.
    1. Pisula J., Budzik G., Turek P., Cieplak M. An Analysis of Polymer Gear Wear in a Spur Gear Train Made Using FDM and FFF Methods Based on Tooth Surface Topography Assessment. Polymers. 2021;13:1649. doi: 10.3390/polym13101649. - DOI - PMC - PubMed
    1. Bonaiti L., Concli F., Gorla C., Rosa F. Bending fatigue behavior of 17-4 PH gears produced via selective laser melting. Procedia Struct. Integr. 2019;24:764–774. doi: 10.1016/j.prostr.2020.02.068. - DOI
    1. Tunalioglu M.S., Agca B.V. Wear and Service Life of 3-D Printed Polymeric Gears. Polymers. 2022;14:2064. doi: 10.3390/polym14102064. - DOI - PMC - PubMed
    1. Mousavi Nejad Z., Zamanian A., Saeidifar M., Vanaei H.R., Salar Amoli M. 3D Bioprinting of Polycaprolactone-Based Scaffolds for Pulp-Dentin Regeneration: Investigation of Physicochemical and Biological Behavior. Polymers. 2021;13:4442. doi: 10.3390/polym13244442. - DOI - PMC - PubMed

LinkOut - more resources