Review
. 2023 Aug 4;14(8):1557.
doi: 10.3390/mi14081557.

Silicon Carbide-Based DNA Sensing Technologies

Affiliations
Review

Silicon Carbide-Based DNA Sensing Technologies

Abdulla Al Mamun et al. Micromachines (Basel). .

Abstract

DNA sensing is critical in various applications such as the early diagnosis of diseases and the investigation of forensic evidence, food processing, agriculture, environmental protection, etc. As a wide-bandgap semiconductor with excellent chemical, physical, electrical, and biocompatible properties, silicon carbide (SiC) is a promising material for DNA sensors. In recent years, a variety of SiC-based DNA-sensing technologies have been reported, such as nanoparticles and quantum dots, nanowires, nanopillars, and nanowire-based field-effect-transistors, etc. This article aims to provide a review of SiC-based DNA sensing technologies, their functions, and testing results.

Keywords: DNA; SiC; chemiresistor; label-free; sensitivity; sensor.


Conflict of interest statement

The authors declare no conflict of interest.

Figures

Figure 1
Figure 1
Schematic illustration of P. mirabilis detection by fluorescence aptasensor assay. Reprinted with permission from Ref. [25]. 2020, Microchimica Acta.
Figure 2
Figure 2
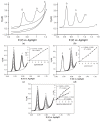
(a) UV-VIS spectra of SiC, DNA, and DNA-SiC QDs. (b) Fluorescent spectra of DNA-SiC QDs in the absence and presence of P. mirabilis with 1 × 10⁷ CFU mL−1. (c) The stability of the fluorescence intensity from SiC QDs in 8 weeks. (d) The selectivity of the aptasensor based on fluorescence intensity at 420 nm in the absence (F0) and presence (F) of bacteria (at 1.0 × 10⁷ CFU mL−1) including P. mirabilis, P. aeruginosa, L. monocytogenes, E. coli. (e) Fluorescence spectra of DNA-SiC QDs in the presence of P. mirabilis (103–109 CFU mL−1). Reprinted with permission from Ref. [25]. 2020, Microchimica Acta.
Figure 3
Figure 3
(a) TEM image of SiC powder, and (b) FE-SEM image of the SiCNP/GCE surface. The scale bar in (a) is 200 nm. Reprinted with permission from Ref. [1]. 2011, Biosensors and Bioelectronics.
Figure 4
Figure 4
Successive cyclic voltammetry (scan rate: 100 mV/s) test results: (a) differential pulse voltammetrics (scan rate: 20 mV/s and pulse amplitude 50 mV); (b) in 0.1 M pH 7.4 PBS containing 12.0 mol L−1 guanine and 12.0 mol L−1 adenine at bare GCE (denoted as “a”) and modified SiCNP/GCE (denoted as “b”). (c) DPVs of various concentrations of guanine (G) from 3 µM to 12 µM in 4.85 µM adenine (A) solution, (d) various concentrations of adenine from 3 µM to 12 µM in 4.85 µM guanine solution, and (e) simultaneous determination of guanine and adenine from 1.8 to 1.2 µM. Inset: plots Ip vs. concentrations. Reprinted with permission from Ref. [1]. 2011, Biosensors and Bioelectronics.
Figure 5
Figure 5
(a) Flowchart of the chemical process for DNA hybridization on a SiC surface. (b) SEM image of SiC nanopillar. Reprinted with permission from Ref. [23]. 2016, Elsevier.
Figure 6
Figure 6
XPS surveys of (a) bare SiC wafer, (b) biomodified SiC sample with hybridized DNA, (c) N1s in the case of silanized SiC surface, (d) N1s in the case of hybridized DNA on SiC surface, and (e) P2p in the case of hybridized DNA on the SiC surface. Reprinted with permission from Ref. [23]. 2016, Elsevier.
Figure 7
Figure 7
(a) FESEM image of 3C-SiC nanowires grown on a 4H-SiC (0001) substrate with individual nanowire tips shown in the inset. (b) Streptavidin (SA) binding and inhibition of Bovine Serum Albumin (BSA) binding to biotinylated nanowires. (c) XPS spectra of SiC nanowires. Curve a: as-grown; curve b: APTES-coated; curve c: biotinylated; and curve d: SA immobilized. The inset, from left to right, shows the C1s peaks from the as-grown SiC nanowires, the N1s peaks from NH3+1/NH2—H and NH2 after APTES functionalization, the S2p peaks after biotinylation, and the C1s signal related to SA conjugation. The different colors of * correspond to the color of the curves. Reprinted with permission from Ref. [19]. 2013, Journal of Materials Research.
Figure 8
Figure 8
(a) Fluorescence microscopy images of APTES-coated and biotinylated SiC nanowires after exposure to the SA/BSA mixture. The same nanowire on APTES-coated samples and the same biotinylated nanowire on biotinylated sample is imaged by the red (SA) and green (BSA) fluorescence, respectively. The dashed oval on biotinylated sample marks the locations of nonfluorescent nanowires, confirming the absence of nonspecific BSA attachment. Fluorescence intensity of (b) SA and (c) BSA proteins from as grown, APTES-functionalized, and biotinylated SiC nanowires after exposure to the SA/BSA mixture. Reprinted with permission from Ref. [19]. 2013, Journal of Materials Research.
Figure 9
Figure 9
A flow-chart of the localized functionalization process for DNA grafting and hybridization on SiC nanowire nanosensor (DEV1). The reference (DEV2) is kept un-functionalized. Reprinted with permission from Ref. [63]. 2022, Microelectronic Engineering.
Figure 10
Figure 10
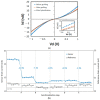
(a) Id vs. Vd characteristics of a SiC nanowire at Vg = 0 V before DNA probe grafting (initial state), after DNA probe grafting and after hybridization with DNA targets. (b) The drain current evolution of the sensor (DEV1, functionalized) and reference sample (DEV2, un-functionalized) after different functionalization steps: silane and glutaraldehyde covalent bonding (initial step), DNA probe grafting (step A), complementary hybridization (step B), dehybridization (step C), non-complementary hybridization (step D), and complementary re-hybridization (step E). The percentages represent the variation of the mean current between two successive steps. Reprinted with permission from Ref. [63]. 2022, Microelectronic Engineering.
Figure 11
Figure 11
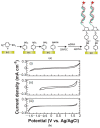
(a) Schematic of bio-functionalization of SiC with DNA. SSMCC: the cross-linker of sulphosuccinimidyl-4-(N-maleimidomethyl) cyclohexane-1-carboxylate. (b) Cyclic voltammograms from (i) nanocrystalline 3C-SiC electrode, (ii) glassy carbon electrode, and (iii) boron-doped (5 × 1023 cm−3) diamond electrode in 0.1 M H2SO4 at a scan rate of 100 mV/s. Reprinted with permission from Ref. [22]. 2011, Analytical Chemistry.
Figure 12
Figure 12
(a) Fluorescence microscopic image of a ds-DNA functionalized SiC electrode. (b) Cyclic voltammograms of ss-DNA (solid line) and ds-DNA (dashed line)-modified SiC electrode in a pH 7.4 PBS at a scan rate of 50 mV/s. Reprinted with permission from Ref. [22]. 2011, Analytical Chemistry.

References

    1. Ghavami R., Salimi A., Navaee A. SiC Nanoparticles-Modified Glassy Carbon Electrodes for Simultaneous Determination of Purine and Pyrimidine DNA Bases. Biosens. Bioelectron. 2011;26:3864–3869. doi: 10.1016/j.bios.2011.02.048. - DOI - PubMed
    1. Bano E., Fradetal L., Stambouli V., Attolini G. DNA Detection Using SiC Nanowire Based Transistor; Proceedings of the Silicon Carbide and Related Materials 2015; Giardini Naxos, Italy. 4–9 October 2015; Stafa-Zurich, Switzerland: Trans Tech Publications Ltd.; 2016. pp. 1006–1009.
    1. Sassolas A., Leca-Bouvier B.D., Blum L.J. DNA Biosensors and Microarrays. Chem. Rev. 2008;108:109–139. doi: 10.1021/cr0684467. - DOI - PubMed
    1. Frewin C.L., Nezafati M., Noble K., Saddow S.E. Chapter 2—Cytotoxicity of 3C–SiC Investigated through Strict Adherence to ISO 10993. In: Saddow S.E., editor. Silicon Carbide Biotechnology. 2nd ed. Elsevier; Amsterdam, The Netherlands: 2016. pp. 27–61.
    1. Chen K.-I., Li B.-R., Chen Y.-T. Silicon Nanowire Field-Effect Transistor-Based Biosensors for Biomedical Diagnosis and Cellular Recording Investigation. Nano Today. 2011;6:131–154. doi: 10.1016/j.nantod.2011.02.001. - DOI