. 2023 Aug 10;15(16):3527.
doi: 10.3390/nu15163527.

Monocarboxylate Transporter 13 (MCT13/SLC16A13) Functions as a Novel Plasma Membrane Oligopeptide Transporter

Affiliations

Monocarboxylate Transporter 13 (MCT13/SLC16A13) Functions as a Novel Plasma Membrane Oligopeptide Transporter

Kei Higuchi et al. Nutrients. .

Abstract

SLC16A13, which encodes the monocarboxylate transporter 13 (MCT13), is a susceptibility gene for type 2 diabetes and is expressed in the liver and duodenum. Some peptidase-resistant oligopeptides are absorbed in the gastrointestinal tract and affect glycemic control in the body. Their efficient absorption is mediated by oligopeptide transporter(s) at the apical and basolateral membranes of the intestinal epithelia; however, the molecules responsible for basolateral oligopeptide transport have not been identified. In this study, we examined whether MCT13 functions as a novel basolateral oligopeptide transporter. We evaluated the uptake of oligopeptides and peptidomimetics in MCT13-transfected cells. The uptake of cephradine, a probe for peptide transport system(s), significantly increased in MCT13-transfected cells, and this increase was sensitive to membrane potential. The cellular accumulation of bioactive peptides, such as anserine and carnosine, was decreased by MCT13, indicating MCT13-mediated efflux transport activity. In polarized Caco-2 cells, MCT13 was localized at the basolateral membrane. MCT13 induction enhanced cephradine transport in an apical-to-basal direction across Caco-2 cells. These results indicate that MCT13 functions as a novel efflux transporter of oligopeptides and peptidomimetics, driven by electrochemical gradients across the plasma membrane, and it may be involved in the transport of these compounds across the intestinal epithelia.

Keywords: CD147; cephradine; intestinal epithelium; membrane potential; membrane transport; monocarboxylate transporter 13; oligopeptide; protein–protein interaction; transporter.


Conflict of interest statement

We declare that we have no conflict of interest.

Figures

Figure 1
Figure 1
Ancillary protein CD147 enhances the plasma membrane localization of MCT13. (A) Effect of CD147 and GP70 on the intracellular localization of MCT13 in HEK239T cells. HEK293T cells were transfected with plasmids of EGFP-tagged MCT13 (green) and CD147 or GP70. The plasma membrane of cells was stained by PlasMem Bright Red (red). (B) Bi-FC assay for interactions between MCT13 and CD147. VN and VC mean the N- and C-terminal fragments of Venus fluorescent protein, respectively. HE293T cells were transfected with MCT13-VC and CD147-VN or -VC. EGFP-tagged MCT13 was used as a positive control. Venus fluorescent signals were detected by fluorescence microscopy. The obtained fluorescent images were merged with phase contrast images.
Figure 2
Figure 2
MCT13 mediates the uptake and efflux of oligopeptides and peptidomimetics. (AD) Uptakes of cephradine (A), Gly-Sar (B), anserine (C), and carnosine (D) by HEK293T expressing EGFP-tagged MCT13 and CD147. Uptake of each substrate was measured at 500 μM in HBBS-modified (Na+-free) buffer (pH 7.4) for the indicated time. (E) Effect of MCT13 on PEPT2-mediated oligopeptide and peptidomimetics uptakes. HEK293T cells were transfected with the plasmid of CD147 with or without plasmids of EGFP-tagged MCT13. The cells were re-transfected with plasmids of PEPT2. Uptake of these compounds was measured at 20 μM in Na+-free buffer (pH 6.5) for 30 min. Each point represents the mean ± S.D. (n = 3). *, p < 0.05, and **, p < 0.01, compared to the corresponding mock-transfected cells by two-way ANOVA with Sidak’s multiple comparisons test (AD) or by unpaired t-test (E).
Figure 3
Figure 3
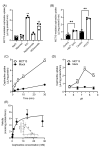
Depletion of membrane potential enhances MCT13-mediated cephradine uptake. Cephradine uptake was measured at 500 μM, except in (E), using HEK293T cells expressing MCT13 and CD147. (A) Effect of extracellular ions on MCT13-mediated cephradine uptake. Uptake in HBSS buffer (pH 7.4) or HBSS-modified buffer (pH 7.4) was measured. (B) Effect of Ba2+ pretreatment and FCCP co-incubation on MCT13-mediated cephradine uptake. For evaluation of the Ba2+ effect, the cells were preincubated with the modified HBSS buffer with or without 2 mM Ba2+. Cephradine uptake was measured in the modified HBSS buffer (pH 7.4) containing 2 mM Ba2+ or in HBSS buffer (pH 7.4) containing 10 μM FCCP. (C) Cephradine uptake was measured in KCl buffer (pH 7.4) for the designed time. (D) Effect of extracellular pH on MCT13-mediated cephradine uptake. The uptake was measured in KCl buffer at a pH of 5.5, 6.5, 7.4, and 8.5. (E) Concentration dependence of MCT13-mediated cephradine uptake. The uptake at 0.1 mM–30 mM was measured. Inset shows the Eadie–Hofstee plot. Each point represents the mean ± S.D. (n = 3). **, p < 0.01, compared to the corresponding uptake in NaCl buffer by one-way ANOVA with Dunnett’s test (A), by unpaired t-test (B,D), or by two-way ANOVA with Sidak’s multiple comparisons test (C).
Figure 4
Figure 4
Inhibitory profiles of transporter-substrates/inhibitors on MCT13-mediated cephradine uptake. Uptake of cephradine was measured at 1000 μM in KCl buffer for 5 min, using HEK293T cells expressing MCT13 and/or CD147. The substrates/inhibitors of transporters were used at 10 mM except for cyclosporine A (CysA) and rifampicin at 50 μM. MCT13-mediated uptake was calculated by subtracting the uptake amount of mock-transfected cells from that of MCT13-transfected cells. Each bar represents the mean ± S.D. (n = 6), except for the control (n = 15), control (1% DMSO) (n = 9), and probenecid (n = 3). The small sample number in the case of probenecid was due to several measurements that were below the detection limit and did not appear in the graph. CysA and rifampicin were used in KCl buffer containing DMSO at a final concentration of 1%(v/v). ** p < 0.01, compared with the corresponding control by one-way ANOVA with Dunnett’s multiple comparisons test.
Figure 5
Figure 5
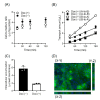
MCT13 enhances cephradine permeation across Caco-2 cells. MCT13 was induced in Caco-2-Tet-MCT13 cells by culturing in the medium including doxycycline at 5 μg/mL and sodium butyrate at 5 mM (Dox [+]) or sodium butyrate at 5 mM (Dox [−]) for 48 h. (A) Caco-2-Tet-MCT13 cells were seeded on 24-well plates. Uptake of cephradine was measured by the cells using HBSS buffer (pH 6.0). (B) Directional transport of cephradine across Caco-2-Tet-MCT13 cells. Caco-2-Tet-MCT13 cells were cultured on a Falcon cell culture insert membrane for 24–27 days and treated with doxycycline and sodium butyrate. Transport of cephradine (500 μM) from apical-to-basal chamber ((A)-to-(B)) or basal-to-apical chamber ((B)-to-(A)) was measured. HBSS buffer (pH 6.0 and pH 7.4) was used as a transport buffer for apical and basal chambers, respectively. (C) Intracellular accumulation of cephradine in Caco-2-Tet-MCT13 cells. Cephradine accumulation in Caco-2-Tet-MCT13 cells was evaluated after 3 h of A-to-B directional transport study. (D) Localization analysis of induced MCT13 in Caco-2 cells. Caco-2-Tet-MCT13 cells were cultured on a Falcon cell culture insert membrane. The nuclei were stained by DAPI. MCT13 (green) and nuclei (blue) were observed by confocal fluorescence microscopy. Each point represents the mean ± S.D. (n = 3). p < 0.01, compared to the corresponding Caco-2-Tet-MCT13 cells treated with only sodium butyrate by two-way ANOVA with Sidak’s multiple comparisons test (B) or unpaired t-test (C).
Figure 6
Figure 6
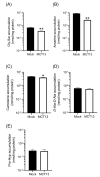
MCT13 suppresses intracellular accumulation of oligopeptides. HEK293T cells expressing MCT13 and CD147 were cultured with or without (A) Gly-Sar, (B) anserine, (C) carnosine, (D) D-Ala-D-Ala, or (E) Pro-Hyp at 500 μM for 24 h. Each bar represents the mean ± S.D. (n = 3). *, p < 0.05, **, p < 0.01, compared to the corresponding accumulation in mock-transfected cells by unpaired t-test.

Similar articles

References

    1. Ganapathy M.E., Brandsch M., Prasad P.D., Ganapathy V., Leibach F.H. Differential Recognition of Beta -Lactam Antibiotics by Intestinal and Renal Peptide Transporters, PEPT 1 and PEPT 2. J. Biol. Chem. 1995;270:25672–25677. doi: 10.1074/jbc.270.43.25672. - DOI - PubMed
    1. Liang R., Fei Y.J., Prasad P.D., Ramamoorthy S., Han H., Yang-Feng T.L., Hediger M.A., Ganapathy V., Leibach F.H. Human Intestinal H+/Peptide Cotransporter. Cloning, Functional Expression, and Chromosomal Localization. J. Biol. Chem. 1995;270:6456–6463. doi: 10.1074/jbc.270.12.6456. - DOI - PubMed
    1. Saito H., Inui K. Dipeptide Transporters in Apical and Basolateral Membranes of the Human Intestinal Cell Line Caco-2. Am. J. Physiol. 1993;265:G289–G294. doi: 10.1152/ajpgi.1993.265.2.G289. - DOI - PubMed
    1. Thwaites D.T., Brown C.D., Hirst B.H., Simmons N.L. Transepithelial Glycylsarcosine Transport in Intestinal Caco-2 Cells Mediated by Expression of H(+)-Coupled Carriers at Both Apical and Basal Membranes. J. Biol. Chem. 1993;268:7640–7642. doi: 10.1016/S0021-9258(18)53004-0. - DOI - PubMed
    1. Terada T., Sawada K., Saito H., Hashimoto Y., Inui K. Functional Characteristics of Basolateral Peptide Transporter in the Human Intestinal Cell Line Caco-2. Am. J. Physiol. 1999;276:G1435–G1441. doi: 10.1152/ajpgi.1999.276.6.G1435. - DOI - PubMed