. 2023 Aug 21;12(16):3014.
doi: 10.3390/plants12163014.

Cytokinin Promotes Jasmonic Acid Accumulation in the Control of Maize Leaf Growth

Affiliations

Cytokinin Promotes Jasmonic Acid Accumulation in the Control of Maize Leaf Growth

Aimee N Uyehara et al. Plants (Basel). .

Abstract

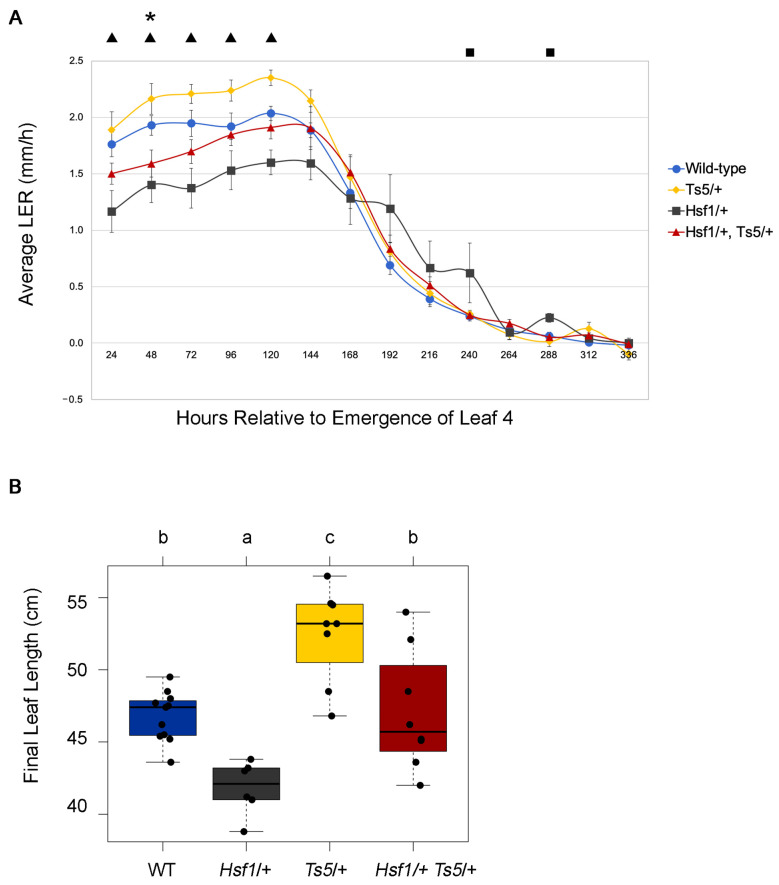
Plant organ growth results from the combined activity of cell division and cell expansion. The co-ordination of these two processes depends on the interplay between multiple hormones that determine the final organ size. Using the semidominant Hairy Sheath Frayed1 (Hsf1) maize mutant that hypersignals the perception of cytokinin (CK), we show that CK can reduce leaf size and growth rate by decreasing cell division. Linked to CK hypersignaling, the Hsf1 mutant has an increased jasmonic acid (JA) content, a hormone that can inhibit cell division. The treatment of wild-type seedlings with exogenous JA reduces maize leaf size and growth rate, while JA-deficient maize mutants have increased leaf size and growth rate. Expression analysis revealed the increased transcript accumulation of several JA pathway genes in the Hsf1 leaf growth zone. A transient treatment of growing wild-type maize shoots with exogenous CK also induced the expression of JA biosynthetic genes, although this effect was blocked by the co-treatment with cycloheximide. Together, our results suggest that CK can promote JA accumulation, possibly through the increased expression of specific JA pathway genes.

Keywords: cytokinin; jasmonic acid; maize.


Conflict of interest statement

The authors declare no conflict of interest.

Figures

Figure 1
Figure 1
Hsf1 growth and phytohormone phenotypes. (A) Barplots of WT and Hsf1/+ final leaf lengths. Error bars = SE. (B) Average leaf elongation rate (LER) of leaf #4 of Hsf1/+ and WT siblings in the B73 inbred background. Error bars = SE. (C) Kinematic analysis comparing growth zones of the Hsf1/+ mutant and its WT sibling. (D) Two-week-old whole-seedling hormone profile of Hsf1/+ and WT siblings. 12-OPDA, 12-oxophytodienoic acid; JA, Jasmonic Acid; 12OH-JA, 12-hydroxy-jasmonic acid; IAA, Indole-3-Acetic Acid; SA, Salicylic Acid; JA-Ile, Jasmonoyl Isoleucine; 12OH-JA-Ile, 12-hydroxy-jasmonoyl-isoleucine; 12COOH-JA-Ile, 12-carboxy-jasmonoyl-isoleucine; GA-3, gibberellic acid. (E) Jasmonic Acid (JA) concentration across leaf #9 at steady-state growth. The leaf was divided into three sections (leaf base, leaf middle, and leaf tip). Leaf base included the growth zone. White columns are Hsf1/+ and gray columns are WT sibling. Asterisks mark significant p-value differences (* p < 0.05, *** p < 0.001) calculated from a two-tailed Student’s t-test.
Figure 2
Figure 2
JA pathway genes are upregulated in the growth zone of Hsf1 leaves. RT-qPCR of key JA biosynthesis and signaling genes across the division zone in Hsf1/+ and wild-type leaf #4 at steady-state growth. Asterisks and daggers mark significant differences by a one-tailed Student’s t-test. p-values * ≤ 0.05, † < 0.10.
Figure 3
Figure 3
Effect of JA on B73 leaf growth. (A) Boxplots of sheath length, blade length, and blade width for leaves #1–#4 in control and 1 mM JA treated seedlings. Horizontal bars represent the maximum, third quantile, median, first quantile, and minimum values respectively. Each dot is a plant (B73, n = 23; B73 + JA, n = 22). Asterisks mark significant differences by Student’s t-test. (B) Average leaf elongation rate (LER) of leaf #4 at steady-state growth of control and 1 mM JA treated seedlings. Error bars = SE. Asterisks mark significant differences of LER between treatments at each time point by Student’s t-test p-value ≤ 0.05 (B73, n = 27; B73 + JA; n = 22).
Figure 4
Figure 4
Final leaf size, leaf elongation rate (LER), and leaf elongation duration (LED) of Hsf1/+ and WT siblings treated with 1 mM JA. Boxplots of leaves #3 (A) and #4 (B) of Hsf1/+ and WT siblings from seedlings grown from germinating seed subjected to a 6-day, 1 mM JA treatment. Horizontal bars represent the maximum, third quantile, median, first quantile, and minimum values, respectively. Each dot is a plant (WT Control, n = 7; WT JA, n = 9; Hsf1/+ Control, n = 10; Hsf1/+ JA, n = 9). Letters unshared in compact letter display indicates significant differences by ANOVA followed by Tukey’s HSD. (CE) LER superimposed over total leaf length. (C) LER and leaf lengths of WT and Hsf1/+ control treatments. JA treatment comparisons in (D) WT, (E) Hsf1/+, and (F) treated Hsf1/+ and WT. Significant differences by Student’s t-test are marked by asterisks. Yellow asterisks mark differences in LER and black asterisks mark differences in leaf length. Significant differences p < 0.05 are calculated by Student’s t-test. Error bars = SE.
Figure 5
Figure 5
JA deficiency in maize enhances leaf growth. (A) Boxplots of sheath length, blade length, and blade width of the JA-deficient opr7 opr8 double mutant as compared to its JA-sufficient siblings (opr7/opr7, OPR8/OPR8 and opr7/opr7, OPR8/opr8). Unshared letters in compact letter display indicates significant differences by ANOVA followed by Tukey’s HSD. (B) LER of JA-deficient opr7 opr8 double mutant as compared to its JA-sufficient siblings opr7/opr7, OPR8/OPR8 and opr7/opr7, OPR8/opr8. Significant differences by Student’s t-test (p ≤ 0.05) for the double mutant compared to opr7/opr7, OPR8/OPR8 or opr7/opr7, OPR8/opr8 are indicated by black triangles or black squares, respectively. Error bars = SE (OPR8/OPR8, n = 34; OPR8/opr8, n = 62; opr8/opr8, n = 33). (C) LER of JA-deficient Ts5 (n = 9) dominant mutant compared to its JA-sufficient WT sibling (n = 12). Error bars = SE. Asterisks mark significant differences by Student’s t-test p-value ≤ 0.05.
Figure 5
Figure 5
JA deficiency in maize enhances leaf growth. (A) Boxplots of sheath length, blade length, and blade width of the JA-deficient opr7 opr8 double mutant as compared to its JA-sufficient siblings (opr7/opr7, OPR8/OPR8 and opr7/opr7, OPR8/opr8). Unshared letters in compact letter display indicates significant differences by ANOVA followed by Tukey’s HSD. (B) LER of JA-deficient opr7 opr8 double mutant as compared to its JA-sufficient siblings opr7/opr7, OPR8/OPR8 and opr7/opr7, OPR8/opr8. Significant differences by Student’s t-test (p ≤ 0.05) for the double mutant compared to opr7/opr7, OPR8/OPR8 or opr7/opr7, OPR8/opr8 are indicated by black triangles or black squares, respectively. Error bars = SE (OPR8/OPR8, n = 34; OPR8/opr8, n = 62; opr8/opr8, n = 33). (C) LER of JA-deficient Ts5 (n = 9) dominant mutant compared to its JA-sufficient WT sibling (n = 12). Error bars = SE. Asterisks mark significant differences by Student’s t-test p-value ≤ 0.05.
Figure 6
Figure 6
Epistatic interaction of Hsf1 and Ts5. (A) LER of Hsf1/+ Ts5/+ double mutant compared to WT (blue circle, also Figure 5C), Hsf1/+ (black squares), and Ts5/+ (yellow diamond, also Figure 5C). Black asterisks, squares, or triangles above the LERs mark significant differences by Student’s t-test p-value ≤ 0.05 for double mutant compared to WT, Hsf1/+, or Ts5/+, respectively. Error bars = SE (+/+, n = 12; Hsf1/+, n = 6; Ts5/+, n = 9, Hsf1/+ Ts5/+, n = 10). (B) Boxplots of sheath length, blade length, and blade width of leaf #1 and #2 of the population described in (A) where leaf #1 is the leaf subtending the ear and leaf #2 is the next apical leaf. Horizontal bars represent the maximum, third quantile, median, first quantile, and minimum values, respectively. Each dot is a plant. Unshared letters in compact letter display indicates significant differences by ANOVA followed by Tukey’s HSD.
Figure 7
Figure 7
CK induces JA pathway gene expression in the leaf growth zone. (A) Quantitative real-time PCR analysis of CK reporter genes and JA biosynthesis and signaling genes after 10 µM BAP time course. (B) Quantitative real-time PCR analysis of CK reporter genes and JA biosynthesis genes after 10 µM BAP with and without cycloheximide (CHX) treatment. (C) Synopsis of JA pathway genes surveyed in (A,B). Asterisks in (AC) mark significant differences (p < 0.05) between treatment and respective control calculated using a Student’s t-test.

References

    1. Conklin P.A., Strable J., Li S., Scanlon M.J. On the Mechanisms of Development in Monocot and Eudicot Leaves. New Phytol. 2019;221:706–724. doi: 10.1111/nph.15371. - DOI - PubMed
    1. Gupta M.D., Nath U. On the Evolution of Developmental Mechanisms: Divergent Polarities in Leaf Growth as a Case Study. Plant Signal Behav. 2016;11:e1126030. doi: 10.1080/15592324.2015.1126030. - DOI - PMC - PubMed
    1. Nelissen H., Gonzalez N., Inzé D. Leaf Growth in Dicots and Monocots: So Different yet so Alike. Curr. Opin. Plant Biol. 2016;33:72–76. doi: 10.1016/j.pbi.2016.06.009. - DOI - PubMed
    1. Frébort I., Kowalska M., Hluska T., Frébortová J., Galuszka P. Evolution of Cytokinin Biosynthesis and Degradation. J. Exp. Bot. 2011;62:2431–2452. doi: 10.1093/jxb/err004. - DOI - PubMed
    1. Huot B., Yao J., Montgomery B.L., He S.Y. Growth-Defense Tradeoffs in Plants: A Balancing Act to Optimize Fitness. Mol. Plant. 2014;7:1267–1287. doi: 10.1093/mp/ssu049. - DOI - PMC - PubMed