. 2023 Aug 16;23(16):7200.
doi: 10.3390/s23167200.

Wavelet Analysis of Respiratory Muscle sEMG Signals during the Physiological Breakpoint of Static Dry End-Expiratory Breath-Holding in Naive Apneists: A Pilot Study

Affiliations

Wavelet Analysis of Respiratory Muscle sEMG Signals during the Physiological Breakpoint of Static Dry End-Expiratory Breath-Holding in Naive Apneists: A Pilot Study

Nataša Ž Mišić et al. Sensors (Basel). .

Abstract

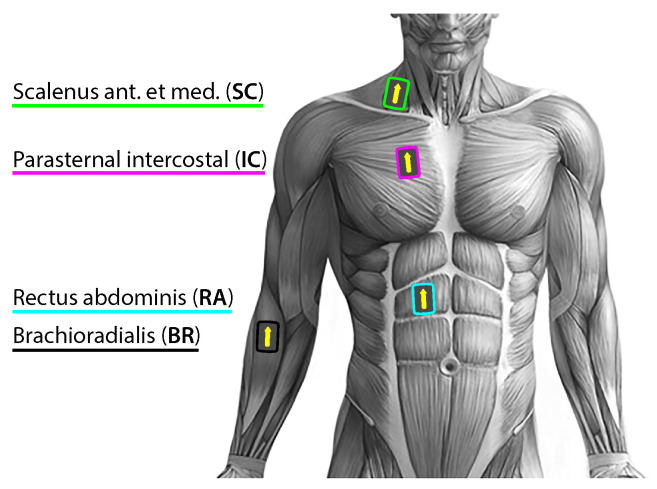
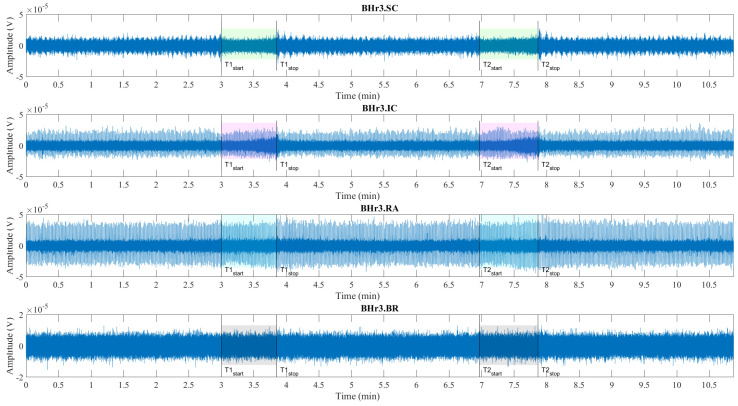
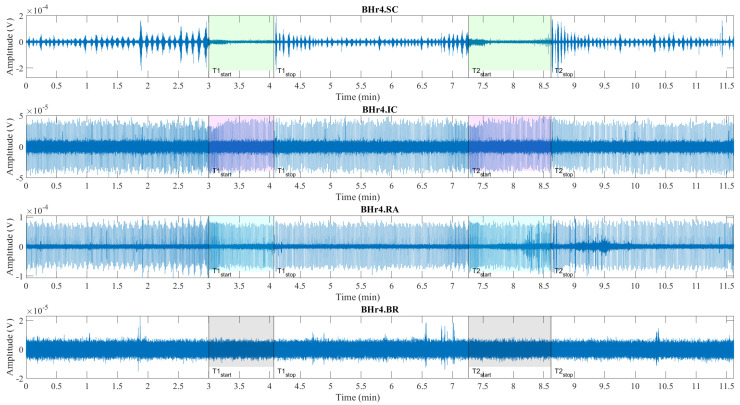
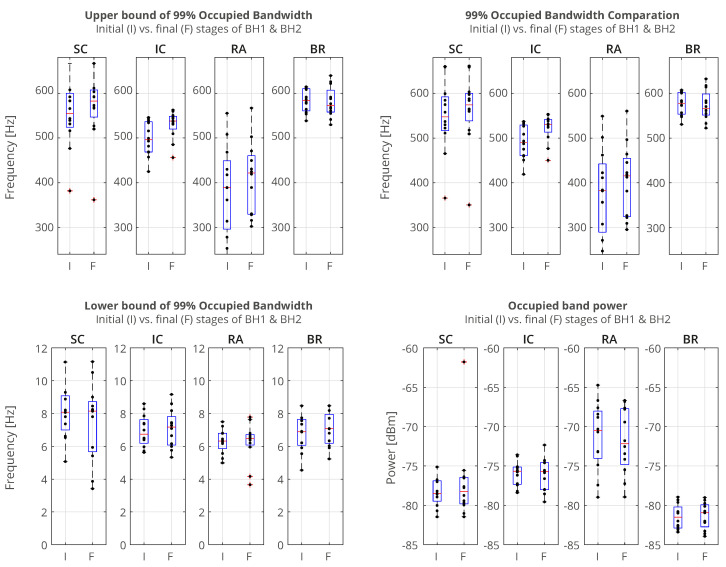
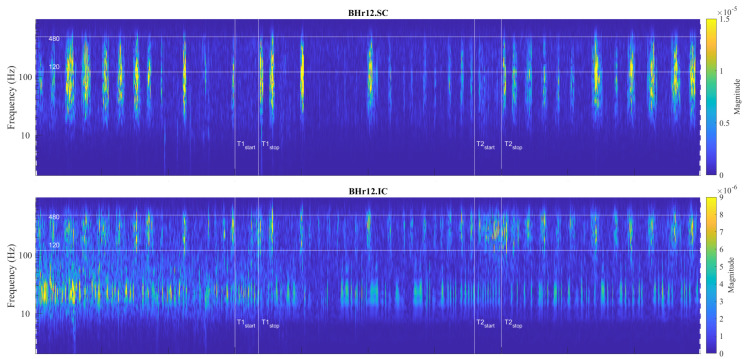
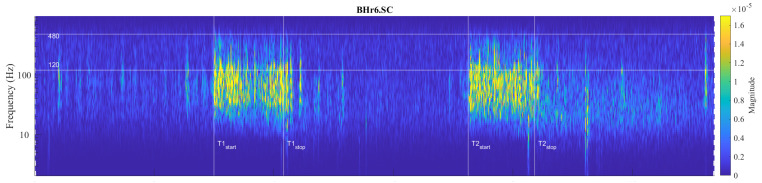
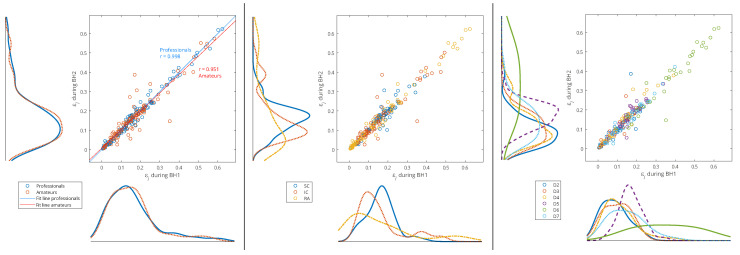
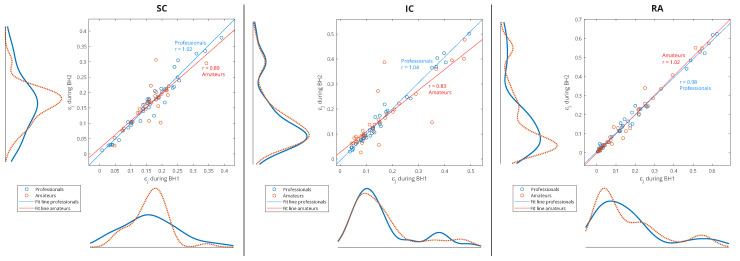
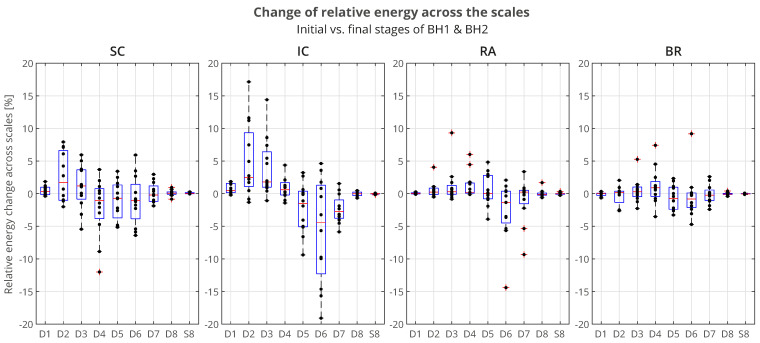
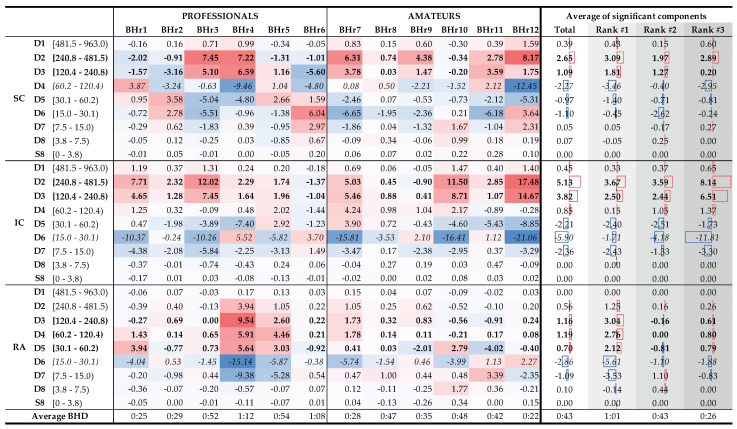
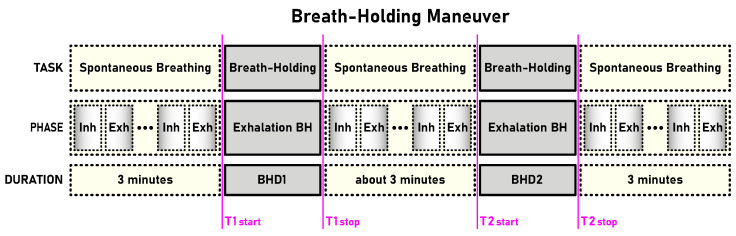
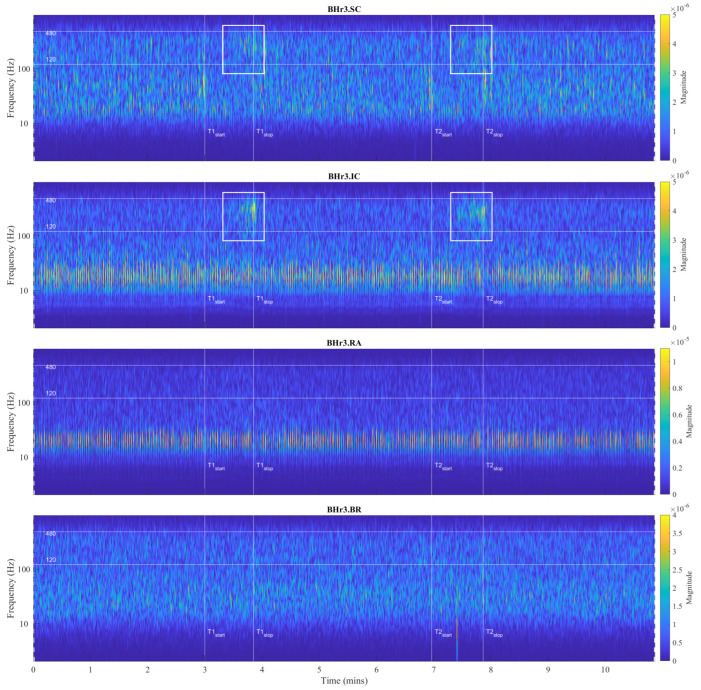
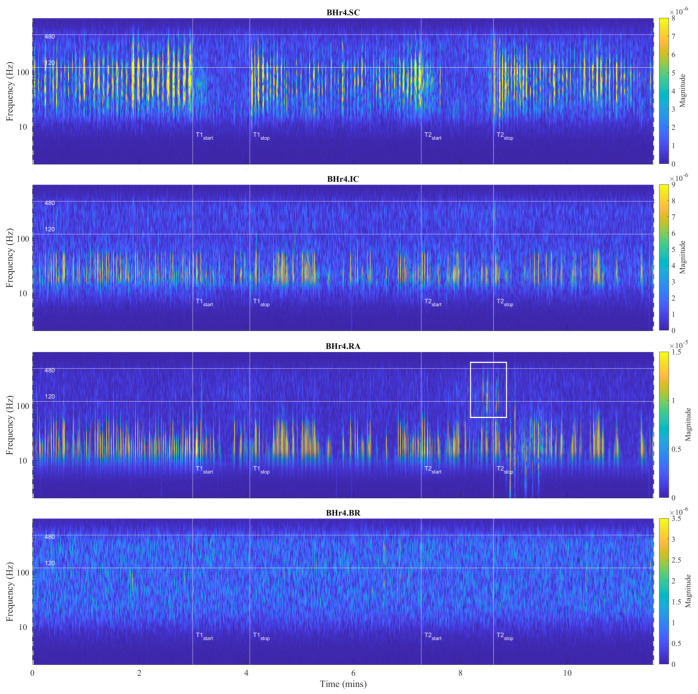
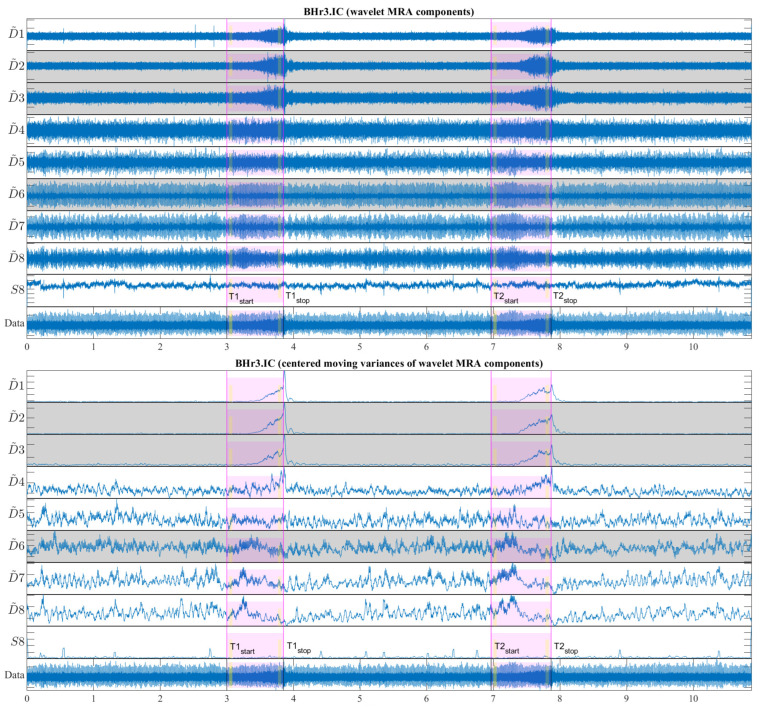
The wavelet spectral characteristics of three respiratory muscle signals (scalenus (SC), parasternal intercostal (IC), and rectus abdominis (RA)) and one locomotor muscle (brachioradialis (BR)) were analyzed in the time-frequency (T-F) domain during voluntary breath-holding (BH), with a focus on the physiological breakpoint that is commonly considered the first involuntary breathing movement (IBM) that signals the end of the easy-going phase of BH. The study was performed for an end-expiratory BH physiological breaking point maneuver on twelve healthy, physically active, naive breath-holders/apneists (six professional athletes; six recreational athletes, and two individuals in the post-COVID-19 period) using surface electromyography (sEMG). We observed individual effects that were dependent on muscle oxygenation and each person's fitness, which were consistent with the mechanism of motor unit (MU) recruitment and the transition of slow-twitch oxidative (type 1) to fast-twitch glycolytic (type 2) muscle fibers. Professional athletes had longer BH durations (BHDs) and strong hypercapnic responses regarding the expiratory RA muscle, which is activated abruptly at higher BHDs in a person-specific range below 250 Hz and is dependent on the BHD. This is in contrast with recreational athletes, who had strong hypoxic responses regarding inspiratory IC muscle, which is activated faster and gradually in the frequency range of 250-450 Hz (independent of the person and BHD). This pilot study preliminarily indicates that it is possible to noninvasively assess the physiological characteristics of skeletal muscles, especially oxygenation, and improve physical fitness tests by determining the T-F features of elevated myoelectric IC and RA activity during BH.

Keywords: breath-holding; heart rate variability; hypercapnia; hypoxia; involuntary breathing movement; multiresolution analysis; muscle fiber subtypes; wavelet analysis.


Conflict of interest statement

The authors declare no conflict of interest. The funders had no role in the design of the study; in the collection, analyses, or interpretation of data; in the writing of the manuscript; or in the decision to publish the results.

Figures

Figure 2
Figure 2
Placement of Delsys Trigno wireless sensors for unilateral right-sided body data collection of the myoelectric activity for the three respiratory muscles—the accessory inspiratory muscle scalenus anterior at medium (SC; green), the primary inspiratory muscle parasternal intercostal (IC; magenta), the accessory expiratory muscle rectus abdominis (RA; cyan), and for the locomotor muscle brachioradialis (BR; black). The colors of the sensors correspond to the colors of the time markers (T1start/T1stop and T2start/T2stop, Figure 1) on all signal plots in the time domain.
Figure 4
Figure 4
Time series of sEMG signals for three respiratory muscles EMGSC, EMGIC, and EMGRA and one nonrespiratory muscle EMGBR, respectively, from top to bottom, which are given for a representative apneist BHr3 (BHD Rank #1; Table 1). The first and second BH phases (BH1 and BH2) are marked with time markers (T1start/T1stop and T2start/T2stop, Figure 1) and colored rectangles, while their colors correspond to the sensor colors in Figure 2. In the final stages of BH, a gradual increase in the magnitudes of EMGSC, and especially EMGIC, was noticeable in both BH1 and BH2 periods.
Figure 5
Figure 5
Time series of EMGSC, EMGIC, and EMGRA, and EMGBR, respectively, from top to bottom, which are given for a representative apneist BHr4 (BHD Rank #1, highest BHD score; Table 1). Other descriptive notes in the caption for Figure 4. In contrast to BHr3, limited or no changes were observed in EMGSC and EMGIC; however, abrupt changes in EMGRA magnitudes were present in the final stages of BH2, indicating a different BH response mechanism.
Figure 6
Figure 6
Comparison of the occupied bandwidth (OBW) estimates (the width of the frequency band that contains 99% of the power of the signal, the lower and upper bounds of the band, and the power in the band), of the muscle sEMG signals in the initial and final phases of breathholding (during BH1 and BH2). The lower bounds were about 7 Hz, which were a consequence of an AC-coupling filtering with 7 Hz highpass filter that strongly attenuated lower frequencies in the sEMG signals. As a result, the upper bounds were similar to the occupied bandwidth. The increase in occupied bandwidth was most pronounced for IC, followed by SC. The occupied band power was the highest for RA and the lowest for BR, which indicated that it was necessary to normalize the power in order to be able to compare the change in the initial and final BH phases for different muscles.
Figure 9
Figure 9
Correlations of neuromuscular coupling for inspiratory muscles SC and IC were demonstrated by comparing scalograms for EMGSC and EMGIC signals of naive apneist BHr12 (BHD Rank #3). Correlation of areas of high energy density for EMGSC and EMGIC signals in the T-F plane were characteristic for the approximate FB of 120–480 Hz. This was the same FB for the increased energy density of the BH final stages for EMGIC signals in both BHr12 and BHr3, as shown in Figure 7, thus indicating that this FB is characteristic of increased IC electromyographic activity, regardless of the primary stimulus.
Figure 10
Figure 10
Individual specificities of neuromuscular coupling in participants for SC were demonstrated by comparing the scalograms for EMGSC signals of apneist BHr6 (BHD Rank #1) with BHr4 (BHD Rank #1, which are presented in Figure 8). During the BH maneuver, participant BHr4 (rower) showed higher SC activity during spontaneous breathing (areas of high energy density for EMGSC signal in the T-F plane are related to inspiration), while BHr6 (diver) showed greater SC activity during breath holding.
Figure 11
Figure 11
Joint distribution of relative energies of wavelet MRA (WMRA) components of respiratory signals EMGSC, EMGIC, and EMGRA of all participants for three types of data grouping: professional/amateur (left), respiratory signal type (middle), and MRA components (right). The distributions were determined using a probability density estimate based on a normal kernel function. The lines of best fit of the two data sets, professionals and amateurs, are calculated using linear regression, where r is the appropriate estimate of the regression slope.
Figure 12
Figure 12
Separated distributions of relative energies of WMRA components of respiratory signals EMGSC, EMGIC, and EMGRA of all participants for professional/amateur grouping. As in the caption of Figure 11, the lines of best fit of the two data sets, professionals and amateurs, are calculated using linear regression, where r is the appropriate estimate of the regression slope. A comparison of the distribution curves for professionals and amateurs shows that they most closely matched for the IC.
Figure 14
Figure 14
Boxplot representation of the changes in relative energy across the scales P(ε) between the BH final and initial stages (as explained in the caption of Figure 13), calculated for the combined BH1 and BH2 periods. The changes were most pronounced for the IC muscle, in particular an increase of D2 and D3 components, with a synchronous decrease of the D6 component (compare with the captions of Figure 13 and Figure 15).
Figure 15
Figure 15
Changes in relative energy across the scales P(ε) between the BH final and initial stages calculated for both BH1 and BH2 periods (left) and corresponding to the average values per scale for the total population and the population grouped by ranks (right). Scales with a significant positive change are displayed in boldface, and with negative change are italic (all values are expressed in percentages). Gradual highlighting from negative (blue) to positive (red) values was performed at the level of one muscle. In the part of the figure where the average values are calculated, the width of the red and blue boxes visualizes the size of the positive and negative change in values, respectively. Average values show the largest energy increase for D2 and D3 scales of EMGIC and EMGSC signals, regardless of the rank, as well as for D3, D4, and D5 scales of EMGRA signal, but only for the Rank #1 group.
Figure 1
Figure 1
Breathing pattern of breath-holding (BH) maneuver. BH began after completion of spontaneous exhalation to functional residual capacity and ended with spontaneous inhalation to normal lung capacity. The T1start/T1stop and T2start/T2stop markers define the beginning/ending of the first and second exhalation BH, respectively (the time markers are displayed on all signal plots, whether in the time or wavelet domain, while their colors correspond to the sensor colors in Figure 2).
Figure 3
Figure 3
The equivalence of processing for a discrete time signal x={xn}n=1N between DWT using wavelet and scaling functions ({Ψj}j=15 and Φ5) and the corresponding fDWT using lowpass and highpass filters (L and H). Left: A perfect T-F plane tiling for DWT in dyadic (octave range) configuration, thus resulting in Heisenberg boxes with the same constant area (examples highlighted in red and blue). With successive downscaling, the wavelet is scaled by 21 and translated by 2. Right: The corresponding fDWT bandwidth division using the cascade in the form of a tree structure of halfband filters and subsampling by 2 results in filterbank with a constant relative bandwidth. Such filtering followed by sampling at the respective Nyquist frequency fs/2 gives same wavelet and smooth coefficients ({Dj}j=15 and S5) as for DWT. More detailed explanations in the main text.
Figure 7
Figure 7
Scalograms of all four sEMG signals calculated for representative apneist BHr3 (BHD Rank #1) (description of signals and time markers are the same as in Figure 4). Two specific frequency bands were observed: the first for EMGIC signal and EMGRA signal in the approximate frequency band (FB) range of 9–30 Hz, which normally corresponds to cardiac activity (the QRS wave), and the second for EMGSC and EMGIC signals in the approximate frequency band (FB) range of 120–480 Hz (D3—high FB (HFB) and D2—very high FB (VHFB)), which occurred in the final stage of BH and was related to the physiological breakpoint (see focused area indicated by white rectangular).
Figure 8
Figure 8
Scalograms of all four sEMG signals calculated for representative apneist BHr4 (BHD Rank #1, highest BHD score) (description of signals and time markers are given in Figure 5). Similar to BHr3 (Figure 7), the same frequency range was observed for EMGIC and EMGRA signals related to cardiac activity. However, in contrast to BHr3, limited or no changes were observed in EMGSC and EMGIC signals; however, abrupt changes in EMGRA signal in FB range of 80–300 Hz (predominantly in D4—medium FB (MFB) and D3—high FB (HFB)) during the final stages of BH2 (see focused area indicated by white rectangular), thus indicating a different BH response mechanism (compare with caption in Figure 5).
Figure 13
Figure 13
Wavelet MRA components of EMGIC signal for BHr3 (above) and their centered moving variances (below). The moving window had a time interval of 1.5 s—approximately 2 times the cardiac interbeat (RR) interval. The BH1 and BH2 phases are marked by rectangles in the magenta color chosen for the IC muscle, as marked in the Figure 4 and indicated in its caption. The narrow yellow rectangles indicate the BH initial stage and BH final stage that were used to quantify energy changes during the first involuntary breathing movement (IBM) shown in Figure 14 and Figure 15. Grayed-out areas correspond to the frequency bands with the highest relative energy changes for the IC muscle (compare with the boxplot representation of changes in relative energy across the scales related to IBM for the IC in Figure 14). The BHD of BHr3 was 52 s on average, while an energy increase started around the middle of the BH period and lasted until the end: in total 27 s.

Similar articles

References

    1. Parkes M.J. Breath-holding and its breakpoint. Exp. Physiol. 2006;91:1–15. doi: 10.1113/expphysiol.2005.031625. - DOI - PubMed
    1. Lindholm P., Lundgren C.E. The physiology and pathophysiology of human breath-hold diving. J. Appl. Physiol. 2009;106:284–292. doi: 10.1152/japplphysiol.90991.2008. - DOI - PubMed
    1. Bain A.R., Ainslie P.N., Barak O.F., Hoiland R.L., Drvis I., Mijacika T., Bailey D.M., Santoro A., DeMasi D.K., Dujic Z., et al. Hypercapnia is essential to reduce the cerebral oxidative metabolism during extreme apnea in humans. J. Cereb. Blood Flow Metab. 2017;37:3231–3242. doi: 10.1177/0271678X16686093. - DOI - PMC - PubMed
    1. Cooper H.E., Parkes M.J., Clutton-Brock T.H. CO2-dependent components of sinus arrhythmia from the start of breath holding in humans. Am. J. Physiol.-Heart Circ. Physiol. 2003;285:H841–H848. doi: 10.1152/ajpheart.01101.2002. - DOI - PubMed
    1. Foster G.E., Sheel A.W. The human diving response, its function, and its control. Scand. J. Med. Sci. Sport. 2005;15:3–12. doi: 10.1111/j.1600-0838.2005.00440.x. - DOI - PubMed