Multicenter Study
. 2023 Dec;94(6):1086-1101.
doi: 10.1002/ana.26776. Epub 2023 Sep 19.

Detection of High-Risk Paraneoplastic Antibodies against TRIM9 and TRIM67 Proteins

Affiliations
Multicenter Study

Detection of High-Risk Paraneoplastic Antibodies against TRIM9 and TRIM67 Proteins

Christopher M Bartley et al. Ann Neurol. 2023 Dec.

Abstract

Objective: Co-occurring anti-tripartite motif-containing protein 9 and 67 autoantibodies (TRIM9/67-IgG) have been reported in only a very few cases of paraneoplastic cerebellar syndrome. The value of these biomarkers and the most sensitive methods of TRIM9/67-IgG detection are not known.

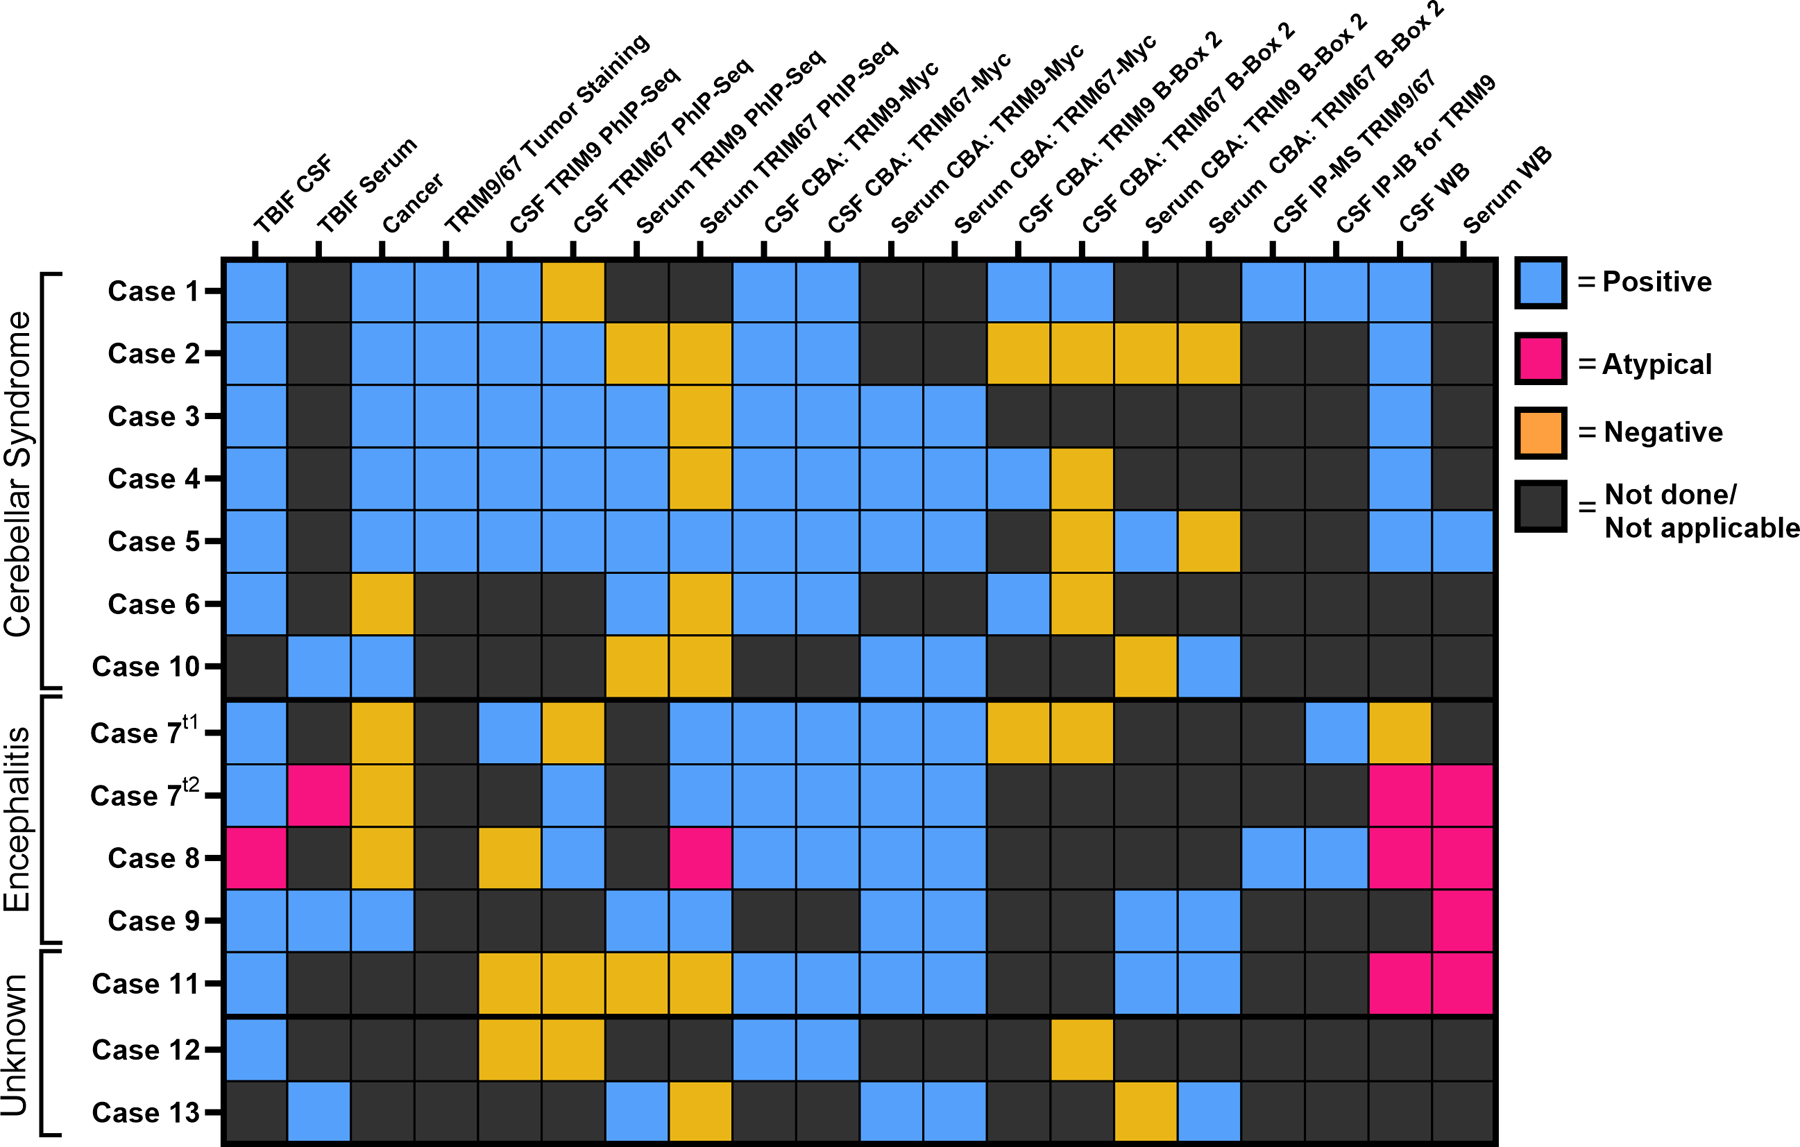
Methods: We performed a retrospective, multicenter study to evaluate the cerebrospinal fluid and serum of candidate TRIM9/67-IgG cases by tissue-based immunofluorescence, peptide phage display immunoprecipitation sequencing, overexpression cell-based assay (CBA), and immunoblot. Cases in which TRIM9/67-IgG was detected by at least 2 assays were considered TRIM9/67-IgG positive.

Results: Among these cases (n = 13), CBA was the most sensitive (100%) and revealed that all cases had TRIM9 and TRIM67 autoantibodies. Of TRIM9/67-IgG cases with available clinical history, a subacute cerebellar syndrome was the most common presentation (n = 7/10), followed by encephalitis (n = 3/10). Of these 10 patients, 70% had comorbid cancer (7/10), 85% of whom (n = 6/7) had confirmed metastatic disease. All evaluable cancer biopsies expressed TRIM9 protein (n = 5/5), whose expression was elevated in the cancerous regions of the tissue in 4 of 5 cases.

Interpretation: TRIM9/67-IgG is a rare but likely high-risk paraneoplastic biomarker for which CBA appears to be the most sensitive diagnostic assay. ANN NEUROL 2023;94:1086-1101.


Conflict of interest statement

Potential Conflicts of Interest

ALP reports grant and research support from Genentech; consulting fees from Alexion, Genentech/Roche, UCB, and EMD Sorono. MRW has received research support from Roche/Genentech and Novartis as well as speaking honoraria from Novartis, Takeda, and Genentech, companies that make therapeutics that could be relevant to paraneoplastic disease. SJP and AZ work as consultants in the Mayo Clinic Neuroimmunology Laboratory clinical service that commercially offers neural autoantibody testing, but revenue accrued does not contribute to salary, research support, or personal income for any of the authors. JH and DLD have filed for a patent (PCT/EP/2019/061280) to protect biological tests to detect anti-TRIM9/67 autoantibodies in patients. All other authors have nothing to report.

Figures

Figure 1.
Figure 1.
Cases and biospecimens and outcomes for each assay. Categorical heatmap of cases, assays, and assays results. CBA = cell-based assay, IP-IB = immunoprecipation followed by immunoblot, IP-MS = immunoprecipitation mass spectrometry, PhIP-Seq = phage display immunoprecipitation sequencing, TBIF = tissue-based immunofluorescence, WB = western blot.
Figure 2.
Figure 2.
Tissue-based immunofluorecent assays. A. Panoramic images of CSF IgG (green) from two representative TRIM9/67 cases. Case 1 was immunostained at a 1:25 CSF dilution and case 7 at a 1:4 dilution. Nuclei are stained with DAPI (blue). Scale bars are 2 mm. B. Coimmunostaining of case 1 CSF (green), TRIM9 (red), and nuclei (blue) in the cortex, CA2 of the hippocampus, and cerebellum. Scale bars are 20 µm. C. Coimmunostaining of case 1 CSF (green), TRIM67 (red), and nuclei (blue) in the cortex, CA2 of the hippocampus, and cerebellum wtihout antigen retrieval. Scale bars are 20 µm.
Figure 3.
Figure 3.
Validation of TRIM9/67-IgG by CBA and immunoblot. A. HEK 293T cells were transfected with myc-TRIM9 or myc-Trim67 and immunostained with anti-Myc (green), patient CSF or serum (anti-human IgG, red) and DAPI nuclear counterstain (blue). CSF CBAs (1:10 dilution) from two representative cases are shown. Scale bar = 100 µm. B. Table of CBA end point titers. N.D. = not done. * indicates that case 6 was positive by CBA but there was insufficient CSF to complete the dilution series, **indicates that two time points were tested for case 7 CSF (earlier time point to the left of the backslash). CS = cerebellar syndrome, EN = encephalitis, UN = unknown phenotype. C. Dot plots of TRIM9 and TRIM67 autoantibody titers as determined by end point dilution CBAs. Unbroken line = median titer. Barbells below each data column indicate whether there is a significant (*, p < 0.05) or nonsignificant difference between autoimmune encephalitis (EN) and cerebellar syndrome (CS) cases as determined by two-tailed unpaired Mann Whitney tests. UN = unknown clinical phenotype. D. Log scale scatter plot of within sample TRIM9:TRIM67 autoantibody titer as determined by CBA. r2 was determined by simple linear regression. E. Immunoblots of whole rat brain lysate with CSF and serum. Cases 1 and 5 show the typical banding pattern at 72 kDa and 95 kDa. Cases 7, 8, 9 and 11 show atypical banding patterns as indicated by the asterisks. Black arrows = TRIM9/67 bands. Asterisks = unexpected bands.
Figure 4.
Figure 4.
TRIM9/67-IgG epitope mapping. A. Top, linear TRIM9 and TRIM67 protein structures. Protein domains align to peptides in heatmap below. The white and black band beneath TRIM9 and TRIM67 protein structures denotes peptides (black) enriched by a TRIM9/67-IgG-positive individual from a prior study3. Heatmaps are colored according to the proportion of PhIP-Seq reads that map to individually enriched peptides. Total rpK for TRIM9 and TRIM67 are shown to the left of each heat map; rpK = reads per 100,000, bolded red = rpK significantly greater than controls (Z score ≥ 3), black = rpK not significant. CS = cerebellar syndrome, EN = encephalitis, UN = unknown phenotype. The bottom row represents the median enrichment of each peptide across all samples. The red numbers indicate the N and C terminal amino acid (AA) positions for the dominant TRIM9 (Uniprot ID #Q9C026, isoform 1) and dominant TRIM67 (Uniprot ID #Q6ZTA4, isoform 1) peptide. B. Sequences of the dominant TRIM9 and TRIM67 peptides. The bolded letters between indicated AAs encode target peptides demarcated by red numbers below the heatmap in A. Vertical lines indicate identical AAs in the overlapping region between the dominant TRIM9 and TRIM67 peptide, plus signs indicate chemically similar AAs, and gaps indicate dissimilar AAs. The overlapping sequence is shown in teal (TRIM9) and salmon (TRIM67). C. AlphaFold models were imported into ChimeraX and the B-box 2 domain of TRIM67 (salmon) was aligned to the B-box 2 domain of TRIM9 (teal). D. TRIM9 and TRIM67 B-box 2-FLAG overexpression CBAs. The top row shows case 4 CSF (green) binding to cytoplasmic FLAG-tagged TRIM9 B-box2 (red). The bottom row demonstrates case 1 CSF (green) binding to FLAG-tagged TRIM67 B-box-2 (red). E. Immunofluorescent immunoblot following immunoprecipitation of TRIM9 from mouse brain lysate without CSF (beads) or with CSF from cases 1, 7, 8, healthy controls (HC, N = 2), or other neuroinflammatory cases (NID, N = 2). F. Heatmaps of spectral counts of TRIM9 and TRIM67 peptide identified by mass spectrometry after immunoprecipitation without CSF (beads), or with CSF from cases 1, 8, other neuroinflammatory disorders (NID, N = 8) or noninflammatory CSF samples (N = 6).
Figure 5.
Figure 5.
IHC of TRIM9 and TRIM67 in the murine and human brain (A) 3,3’-diaminobenzidine (DAB) immunostaining of mouse and human FFPE cerebellum. Mouse scale bars = 50 µm. Human scale bars = 100 µm. (B) DAB immunostaining of serial coronal adult mouse brain sections. Anatomic annotations: rs = retrosplenial cortex, par = parietal cortex, aud = auditory cortex, t = temporal cortex, pr = perirhinal cortex, ent = entorhinal cortex, pir = piriform cortex, tr = postpiriform transition cortex, CoAmy = cortical amygdalar layer, cc = corpus callosum, lg = lateral geniculate, th = thalamus, mb = midbrain, z = zona incerta, pg = periaqueductal grey, cp = cerebral peduncle, and hy = hypothalamus. Scale bars = 1mm. (C) i and ii) IHC of serial coronal sections of human medial temporal lobe. Anatomic annotations: h = hippocampus, s = subiculum, e = entorhinal cortex, pr = perirhinal cortex. Upper dashed box indicates region shown in subpanels iii and iv. Lower right dashed rectangle indicates region shown in subpanels v and vi. Scale bars = 2mm. iii and iv) IHC of TRIM9 and TRIM67 in the entorhinal cortex (e). Scale bars = 200 µm. Throughout the figure, black arrows indicate select regions of TRIM9 > TRIM67 immunoreactivity whereby white arrows indicate select regions of TRIM67 > TRIM9 immunoreactivity. v and vi) IHC of TRIM9 and TRIM67 in serial sections of the human hippocampal formation. Anatomic annotations: a = alveus, so = stratum oriens, sp = stratum pyramidale, sr = stratum radiatum, slm = stratum lacunosum moleculare, sg = stratum granulare, pl = polyform layer/hilus. Scale bares = 250 µm.
Figure 6.
Figure 6.
IHC of TRIM9 and TRIM67 in patient tumors. A. DAB immunostaining of tyrosinase (TYR) in metastatic melanoma to tonsils as a positive control. Scale bar = 1mm. B. Serial sections of case 1 primary melanoma tissue were DAB immunostained for TYR, TRIM9, and TRIM67. Little overlap is observed. Scale bars = 1mm. C. Serial sections from case 1 of metastatic melanoma to lymph nodes were DAB immunostained for TYR, TRIM9, and TRIM67. Visually, the intensity of TRIM9 immunostaining is stronger in TYR+ than TYR- regions. In contrast, the intensity of TRIM67 immunostaining is invariant between TYR+ and TYR- regions. Scale bars = 1mm. D. Multiplex immunofluorescent staining with tumor marker pan-CK clone AE1/AE3 (red), anti-TRIM9 (white), and anti-TRIM67 (green). Case 2, top row: panCK+ areas lie within yellow dotted boundaries. Case 3, middle row: the panCK+ area is to the right of the yellow dotted line. Case 4, bottom row: the parallel yellow lines demarcate a panCK+ cells that are not anti-TRIM9 and anti-TRIM67 immunoreactive. The arrow points to a cluster of panCK+ cells that are immunoreactive to anti-TRIM9 and anti-TRIM67. Scale bars = 50 µm. E. Quantification of the panCK, TRIM9, and TRIM67 immunostaining of tumors shown in 2D. For each antibody, the mean grey value of four panCKlow and four panCKhigh regions of interest (ROIs; Orange = ROI 1, green = ROI 2, blue = ROI 3, purple = ROI 4) was measured. Mean grey values were normalized to the mean of the four panCKlow ROIs. For case 3, two tumor tissues were evaluated: primary (prim) and metastatic (met). For case 4, mean grey value measurements from cytoarchitecturally organized (org) and disorganized (dis) ROIs were taken from within the same primary tumor tissue. P-values were calculated using unpaired, two-tailed t-tests with Welch’s correction when appropriate. ns = not significant given a significant threshold of 0.05 (ns > 0.05, * ≤ 0.05, ** ≤ 0.01, *** ≤ 0.001)
Figure 7.
Figure 7.
TRIM9 and TRIM67 protein expression in case 5 breast cancer. A. Multipleplex immunofluorescence (mIF) for TRIM9, TRIM67, ER, and DAPI on primary breast cancer tissue. The dotted line indicates the boundary between ER+ (left) and the ER- (right) region of the tissue. Scale bar = 500µm. B. mIF of metastatic breast cancer to lymph node. Scale bar = 50µm.

References

    1. Do LD, Gupton SL, Tanji K, et al. TRIM9 and TRIM67 Are New Targets in Paraneoplastic Cerebellar Degeneration. Cerebellum Apr 2019;18(2):245–254. doi:10.1007/s12311-018-0987-5 - DOI - PMC - PubMed
    1. Sebbag E, Psimaras D, Baloglu S, et al. Immune-Related Cerebellar Ataxia: A Rare Adverse Effect of Checkpoint Inhibitor Therapy. J Neuroimmune Pharmacol Oct 22 2021;doi:10.1007/s11481-021-10026-3 - DOI - PubMed
    1. Larman HB, Zhao Z, Laserson U, et al. Autoantigen discovery with a synthetic human peptidome. Nat Biotechnol May 22 2011;29(6):535–41. doi:10.1038/nbt.1856 - DOI - PMC - PubMed
    1. O’Donovan B, Mandel-Brehm C, Vazquez SE, et al. High-resolution epitope mapping of anti-Hu and anti-Yo autoimmunity by programmable phage display. Brain Commun 2020;2(2):fcaa059. doi:10.1093/braincomms/fcaa059 - DOI - PMC - PubMed
    1. Short KM, Cox TC. Subclassification of the RBCC/TRIM superfamily reveals a novel motif necessary for microtubule binding. J Biol Chem Mar 31 2006;281(13):8970–80. doi:10.1074/jbc.M512755200 - DOI - PubMed

Publication types

MeSH terms