. 2023 Aug 24;15(16):8408-8432.
doi: 10.18632/aging.204978. Epub 2023 Aug 24.

SART3, regulated by p53, is a biomarker for diagnosis, prognosis and immune infiltration in hepatocellular carcinoma

Affiliations

SART3, regulated by p53, is a biomarker for diagnosis, prognosis and immune infiltration in hepatocellular carcinoma

Jusen Nong et al. Aging (Albany NY). .

Abstract

Objective: This study aimed to investigate the role of squamous cell carcinoma antigen recognized by T cells 3 (SART3) in hepatocellular carcinoma (HCC).

Methods: SART3 expression and prognostic value were analyzed in TCGA and GEO datasets. The diagnostic value and prognostic significance of SART3 were determined using immunohistochemistry in the Guangxi cohort. The whole-exome mutation spectrum of SART3 was analyzed in high and low expression groups in both TCGA and Guangxi cohorts. The biological functions of the SART3 gene were validated through in vitro experiments using small interfering RNA technology to downregulate SART3 expression in HCC cell lines.

Results: SART3 expression was significantly higher in HCC tissues than in adjacent noncancerous liver tissues in TCGA, GEO and Guangxi cohorts. High expression of SART3 was significantly associated with poor prognosis in HCC patients. In TCGA and Guangxi cohorts, the expression of SART3 in the TP53 mutation group was significantly higher than that in the non-mutation group. Downregulation of SART3 expression significantly inhibited the migration and proliferation of HCC cells. SART3 may be involved mainly in immune infiltration of Th2 cells and macrophages in HCC. Additionally, SART3 can upregulate the expression of immune checkpoints (PD-L1 and TIM-3) and predict potential therapeutic agents for HCC.

Conclusion: The findings of this study demonstrate the diagnostic and prognostic value of SART3 in HCC. SART3 may be associated with immune infiltration of Th2 cells and macrophages in HCC, highlighting its potential role in the development and progression of HCC.

Keywords: TP53 mutation; hepatocellular carcinoma (HCC); immune checkpoint; immune infiltration; prognosis; squamous cell carcinoma antigen recognized by T cells 3 (SART3).


Conflict of interest statement

CONFLICTS OF INTEREST: The authors declare no conflicts of interest related to this study.

Figures

Figure 1
Figure 1
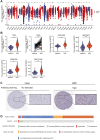
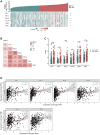
SART3 is highly expressed in the HCC transcriptome and proteome. (A) SART3 expression levels in 31 different human cancers. Panels (B) present the expression levels of SART3 in various datasets, including TCGA LIHC dataset, GSE14520 dataset, GSE76427 dataset, GSE62232 dataset, and GSE121248 dataset. (C) Validation of SART3 expression levels in the HCC proteome in the Human Protein Atlas database. (D) Distribution of genomic changes of SART3 in cBioPortal OncoPrint plots. ns. p ≥ 0.05; *p < 0.05; **p < 0.01; ***p < 0.001.
Figure 2
Figure 2
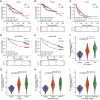
High expression of SART3 correlates with poor prognosis and advanced staging of HCC. Kaplan-Meier curves show SART3high and SART3low groups for (A) OS, (B) DSS and (C) PFS in TCGA dataset, and for (D) OS and (E) RFS in GSE14520 dataset. Violin plot shows SART3 expression at different AFP levels (F), T-stage (G), histological grade (H) and pathological stage (I) expression levels, *p < 0.05; **p < 0.01; ***p < 0.001.
Figure 3
Figure 3
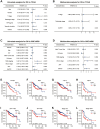
Prognostic value of SART3 in HCC. (A) Univariate Cox regression model and (B) multivariate Cox regression model in TCGA. (C) Univariate Cox regression model and (D) Multivariate Cox regression model in GSE14520. Kaplan-Meier survival curves for subgroups of SART3high and SART3low patients in (E) female, (F) male, (G) T1 and T2, (H) T3 and T4, (I) AFP ≤400, (J) AFP >400, (K) stage I and II and (L) stage III and IV.
Figure 4
Figure 4
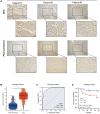
Validation of SART3 in patients with HCC in Guangxi. (A) Representative IHC images showing the in situ expression of SART3 in HCC and adjacent liver tissues. (B) Paired plots showing immunostaining scores of SART3 in HCC and adjacent liver tissues in the Guangxi cohort. (C) Diagnostic ROC curves of SART3 in the Guangxi cohort. (D) OS of SART3high and SART3low groups in the Guangxi cohort based on immunohistochemical staining scores.
Figure 5
Figure 5
Somatic mutation landscape of HCC based on SART3. (A) Waterfall plots demonstrate the HCC somatic mutation landscape in the SART3high and SART3low in TCGA and Guangxi cohort. In the TCGA cohort, (B) SART3 expression between TP53 mutation and TP53 wild group, (C) survival analysis of TP53 mutation group and TP53 wild group, (D) SART3 expression between CTNNB1 mutation and wild group, (E) survival analysis of CTNNB1 mutation group and CTNNB1 wild group. (F) Immunohistochemical staining intensity of SART3 between TP53 mutation and TP53 wild group in the Guangxi cohort. (G) Representative images of immunohistochemistry.
Figure 6
Figure 6
High expression of SART3 upregulates the expression level of immune checkpoint genes. (A) Heat map showing co-expression of SART3 and immune checkpoint genes. (B) Correlation matrix showing SART3-immune checkpoint association. (C) Expression levels of immune checkpoint genes between SART3 high and SART3 low groups. (D) Correlation of SART3 with immune checkpoint genes was verified in TIMER database.
Figure 7
Figure 7
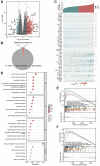
Identification and functional annotation of DEGs and GSEA analysis. (A) Volcano plot showing DEGs between SART3 high and SART3 low groups. (B) Pie chart showing the percentage of up-regulated DEGs and down-regulated DEGs in transcriptome genes. (C) Heat map showing the top 25 up- and down-regulated genes. (D) Bubble plots of DEGs significantly enriched in GO terms and KEGG pathways. Enrichment plots showing (E) four significantly positively correlated KEGG pathways and (F) four significantly positively correlated GO annotations.
Figure 8
Figure 8
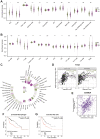
Correlation between SART3 expression and immune infiltration in HCC and its impact on prognosis. (A, B) Violin plots showing the degree of infiltration of different immune cells in the SART3high and SART3low groups, ns: p ≥ 0.05; *p < 0.05; **p < 0.01; ***p < 0.001. (C) Circle heat map showing the correlation between SART3 and different immune cells. (D, E) Scatter plot showing the correlation between SART3 expression levels and CD4+ T cells, macrophages and Th2 cells. Subgroup survival analysis of the SART3high and SART3low groups in (F) enriched macrophages and (G) enriched Th2 cells.
Figure 9
Figure 9
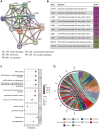
SART3 and its related genes are closely associated with RNA transcription in HCC cells. (A) PPI network of SART3-associated genes. (B) Annotations and correlation coefficients of nine SART3-related genes. (C, D) Enriched GO and KEGG pathways of SART3 and its related genes.
Figure 10
Figure 10
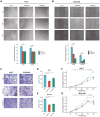
Representative images and corresponding histograms of the wound healing assay of Huh-7. (A) and SUN-449 (B) cells in si-SART3 group and control group. Representative images (C) and corresponding histograms (D, E) of the Trans-well assay of Huh-7 and SUN-449 cells in si-SART3 group and control group. Growth curves of Huh-7 (F) and SUN-449 (G) cells in si-SART3 group and control group by CCK-8 assay.
Figure 11
Figure 11
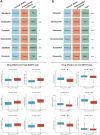
Sensitivity drugs for SART3 high and low expression groups in HCC. Sensitivity drugs for SART3 high expression (A) and SART3 low expression (B). Abbreviations: TKi: Tyrosine kinase inhibitor; HAIC: hepatic arterial infusion chemotherapy; VEGFRi: vascular endothelial growth factor receptor inhibitor; c-METi: c-MET inhibitor; MEK1/2i: mitogen-activated protein kinase 1 and 2 inhibitor; Chemo: Chemotherapy; AurKi: pan-aurora kinase inhibitor; CDKi: Cyclin-dependent kinase inhibitor; mTORC1i: mTOR Complex 1 inhibitor; Pi: proteasome inhibitor.

References

    1. Sung H, Ferlay J, Siegel RL, Laversanne M, Soerjomataram I, Jemal A, Bray F. Global Cancer Statistics 2020: GLOBOCAN Estimates of Incidence and Mortality Worldwide for 36 Cancers in 185 Countries. CA Cancer J Clin. 2021; 71:209–49. 10.3322/caac.21660 - DOI - PubMed
    1. Villanueva A. Hepatocellular Carcinoma. N Engl J Med. 2019; 380:1450–62. 10.1056/NEJMra1713263 - DOI - PubMed
    1. Nevola R, Ruocco R, Criscuolo L, Villani A, Alfano M, Beccia D, Imbriani S, Claar E, Cozzolino D, Sasso FC, Marrone A, Adinolfi LE, Rinaldi L. Predictors of early and late hepatocellular carcinoma recurrence. World J Gastroenterol. 2023; 29:1243–60. 10.3748/wjg.v29.i8.1243 - DOI - PMC - PubMed
    1. Bader JE, Voss K, Rathmell JC. Targeting Metabolism to Improve the Tumor Microenvironment for Cancer Immunotherapy. Mol Cell. 2020; 78:1019–33. 10.1016/j.molcel.2020.05.034 - DOI - PMC - PubMed
    1. Liu Y, Xun Z, Ma K, Liang S, Li X, Zhou S, Sun L, Liu Y, Du Y, Guo X, Cui T, Zhou H, Wang J, et al.. Identification of a tumour immune barrier in the HCC microenvironment that determines the efficacy of immunotherapy. J Hepatol. 2023; 78:770–82. 10.1016/j.jhep.2023.01.011 - DOI - PubMed

Publication types