

Resting-state EEG and MEG biomarkers of pathological fatigue - A transdiagnostic systematic review
- PMID: 37632989
- PMCID: PMC10474495
- DOI: 10.1016/j.nicl.2023.103500
Resting-state EEG and MEG biomarkers of pathological fatigue - A transdiagnostic systematic review
Abstract
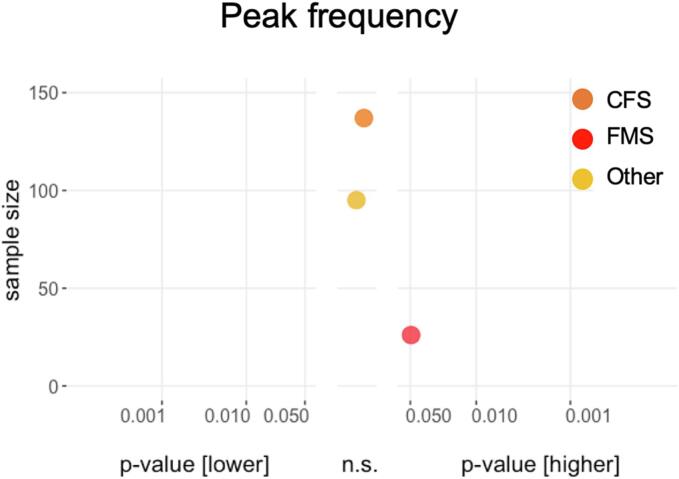
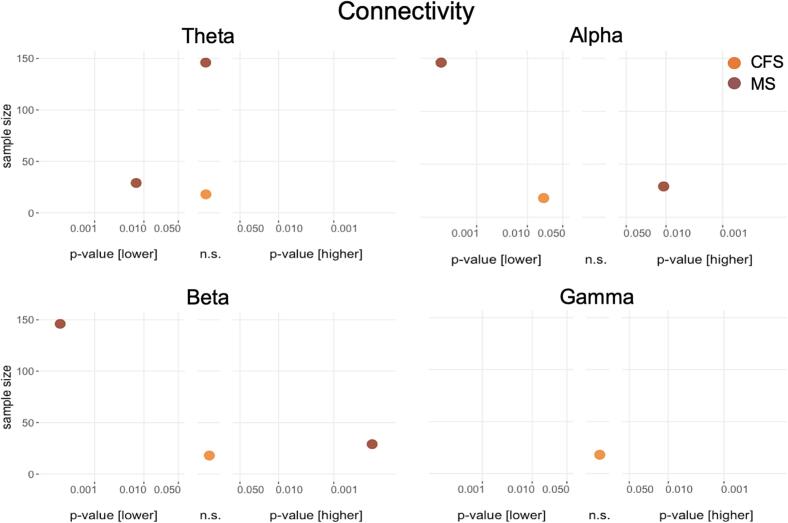
Fatigue is a highly prevalent and disabling symptom of many disorders and syndromes, resulting from different pathomechanisms. However, whether and how different mechanisms converge and result in similar symptomatology is only partially understood, and transdiagnostic biomarkers that could further the diagnosis and treatment of fatigue are lacking. We, therefore, performed a transdiagnostic systematic review (PROSPERO: CRD42022330113) of quantitative resting-state electroencephalography (EEG) and magnetoencephalography (MEG) studies in adult patients suffering from pathological fatigue in different disorders. Studies investigating fatigue in healthy participants were excluded. The risk of bias was assessed using a modified Newcastle-Ottawa Scale. Semi-quantitative data synthesis was conducted using modified albatross plots. After searching MEDLINE, Web of Science Core Collection, and EMBASE, 26 studies were included. Cross-sectional studies revealed increased brain activity at theta frequencies and decreased activity at alpha frequencies as potential diagnostic biomarkers. However, the risk of bias was high in many studies and domains. Together, this transdiagnostic systematic review synthesizes evidence on how resting-state M/EEG might serve as a diagnostic biomarker of pathological fatigue. Beyond, this review might help to guide future M/EEG studies on the development of fatigue biomarkers.
Keywords: Biomarker; EEG; Fatigue; MEG; Systematic review; Transdiagnostic.
Copyright © 2023 The Author(s). Published by Elsevier Inc. All rights reserved.
Conflict of interest statement
Declaration of Competing Interest The authors declare that they have no known competing financial interests or personal relationships that could have appeared to influence the work reported in this paper.
Figures
Similar articles
-
Resting-state electroencephalography and magnetoencephalography as biomarkers of chronic pain: a systematic review.Pain. 2023 Jun 1;164(6):1200-1221. doi: 10.1097/j.pain.0000000000002825. Epub 2022 Nov 28. Pain. 2023. PMID: 36409624 Free PMC article.
-
Electroencephalography, Magnetoencephalography, and Cognitive Reserve: A Systematic Review.Arch Clin Neuropsychol. 2021 Oct 13;36(7):1374-1391. doi: 10.1093/arclin/acaa132. Arch Clin Neuropsychol. 2021. PMID: 33522563 Free PMC article.
-
Reliability of Magnetoencephalography and High-Density Electroencephalography Resting-State Functional Connectivity Metrics.Brain Connect. 2019 Sep;9(7):539-553. doi: 10.1089/brain.2019.0662. Epub 2019 Jun 26. Brain Connect. 2019. PMID: 31115272
-
Comparing the potential of MEG and EEG to uncover brain tracking of speech temporal envelope.Neuroimage. 2019 Jan 1;184:201-213. doi: 10.1016/j.neuroimage.2018.09.006. Epub 2018 Sep 8. Neuroimage. 2019. PMID: 30205208
-
Comparing MEG and high-density EEG for intrinsic functional connectivity mapping.Neuroimage. 2020 Apr 15;210:116556. doi: 10.1016/j.neuroimage.2020.116556. Epub 2020 Jan 20. Neuroimage. 2020. PMID: 31972279
Cited by
-
Neural Correlates of Burnout Syndrome Based on Electroencephalography (EEG)-A Mechanistic Review and Discussion of Burnout Syndrome Cognitive Bias Theory.J Clin Med. 2025 Jul 29;14(15):5357. doi: 10.3390/jcm14155357. J Clin Med. 2025. PMID: 40806977 Free PMC article. Review.
-
Resting-state electroencephalography and magnetoencephalography in migraine-a systematic review and meta-analysis.J Headache Pain. 2024 Sep 11;25(1):147. doi: 10.1186/s10194-024-01857-5. J Headache Pain. 2024. PMID: 39261817 Free PMC article.
-
From bench to bedside: Overview of magnetoencephalography in basic principle, signal processing, source localization and clinical applications.Neuroimage Clin. 2024;42:103608. doi: 10.1016/j.nicl.2024.103608. Epub 2024 Apr 20. Neuroimage Clin. 2024. PMID: 38653131 Free PMC article. Review.
-
Neurophysiological Markers of Cancer-Related Fatigue Derived from High-Density EEG.bioRxiv [Preprint]. 2025 May 1:2025.04.29.651322. doi: 10.1101/2025.04.29.651322. bioRxiv. 2025. PMID: 40654965 Free PMC article. Preprint.
-
Resting-State Electroencephalogram (EEG) as a Biomarker of Learning Disabilities in Children-A Systematic Review.J Clin Med. 2025 Aug 21;14(16):5902. doi: 10.3390/jcm14165902. J Clin Med. 2025. PMID: 40869731 Free PMC article. Review.
References
-
- (2016) In: BEST (Biomarkers, EndpointS, and other Tools) Resource. Silver Spring (MD), Bethesda (MD).
-
- Bruno R.L., Creange S., Zimmerman J.R., Frick N.M. Elevated plasma prolactin and EEG slow wave power in post-polio fatigue. J. Chronic Fatigue Syndrome. 1998;4(2):61–75.
-
- Buyukturkoglu K., Porcaro C., Cottone C., Cancelli A., Inglese M., Tecchio F. Simple index of functional connectivity at rest in Multiple Sclerosis fatigue. Clin. Neurophysiol. 2017;128(5):807–813. - PubMed
Publication types
MeSH terms
Substances
LinkOut - more resources
Full Text Sources
