. 2023 Sep 14;186(19):4172-4188.e18.
doi: 10.1016/j.cell.2023.08.008. Epub 2023 Aug 25.

PINK1, Keap1, and Rtnl1 regulate selective clearance of endoplasmic reticulum during development

Affiliations

PINK1, Keap1, and Rtnl1 regulate selective clearance of endoplasmic reticulum during development

Ruoxi Wang et al. Cell. .

Abstract

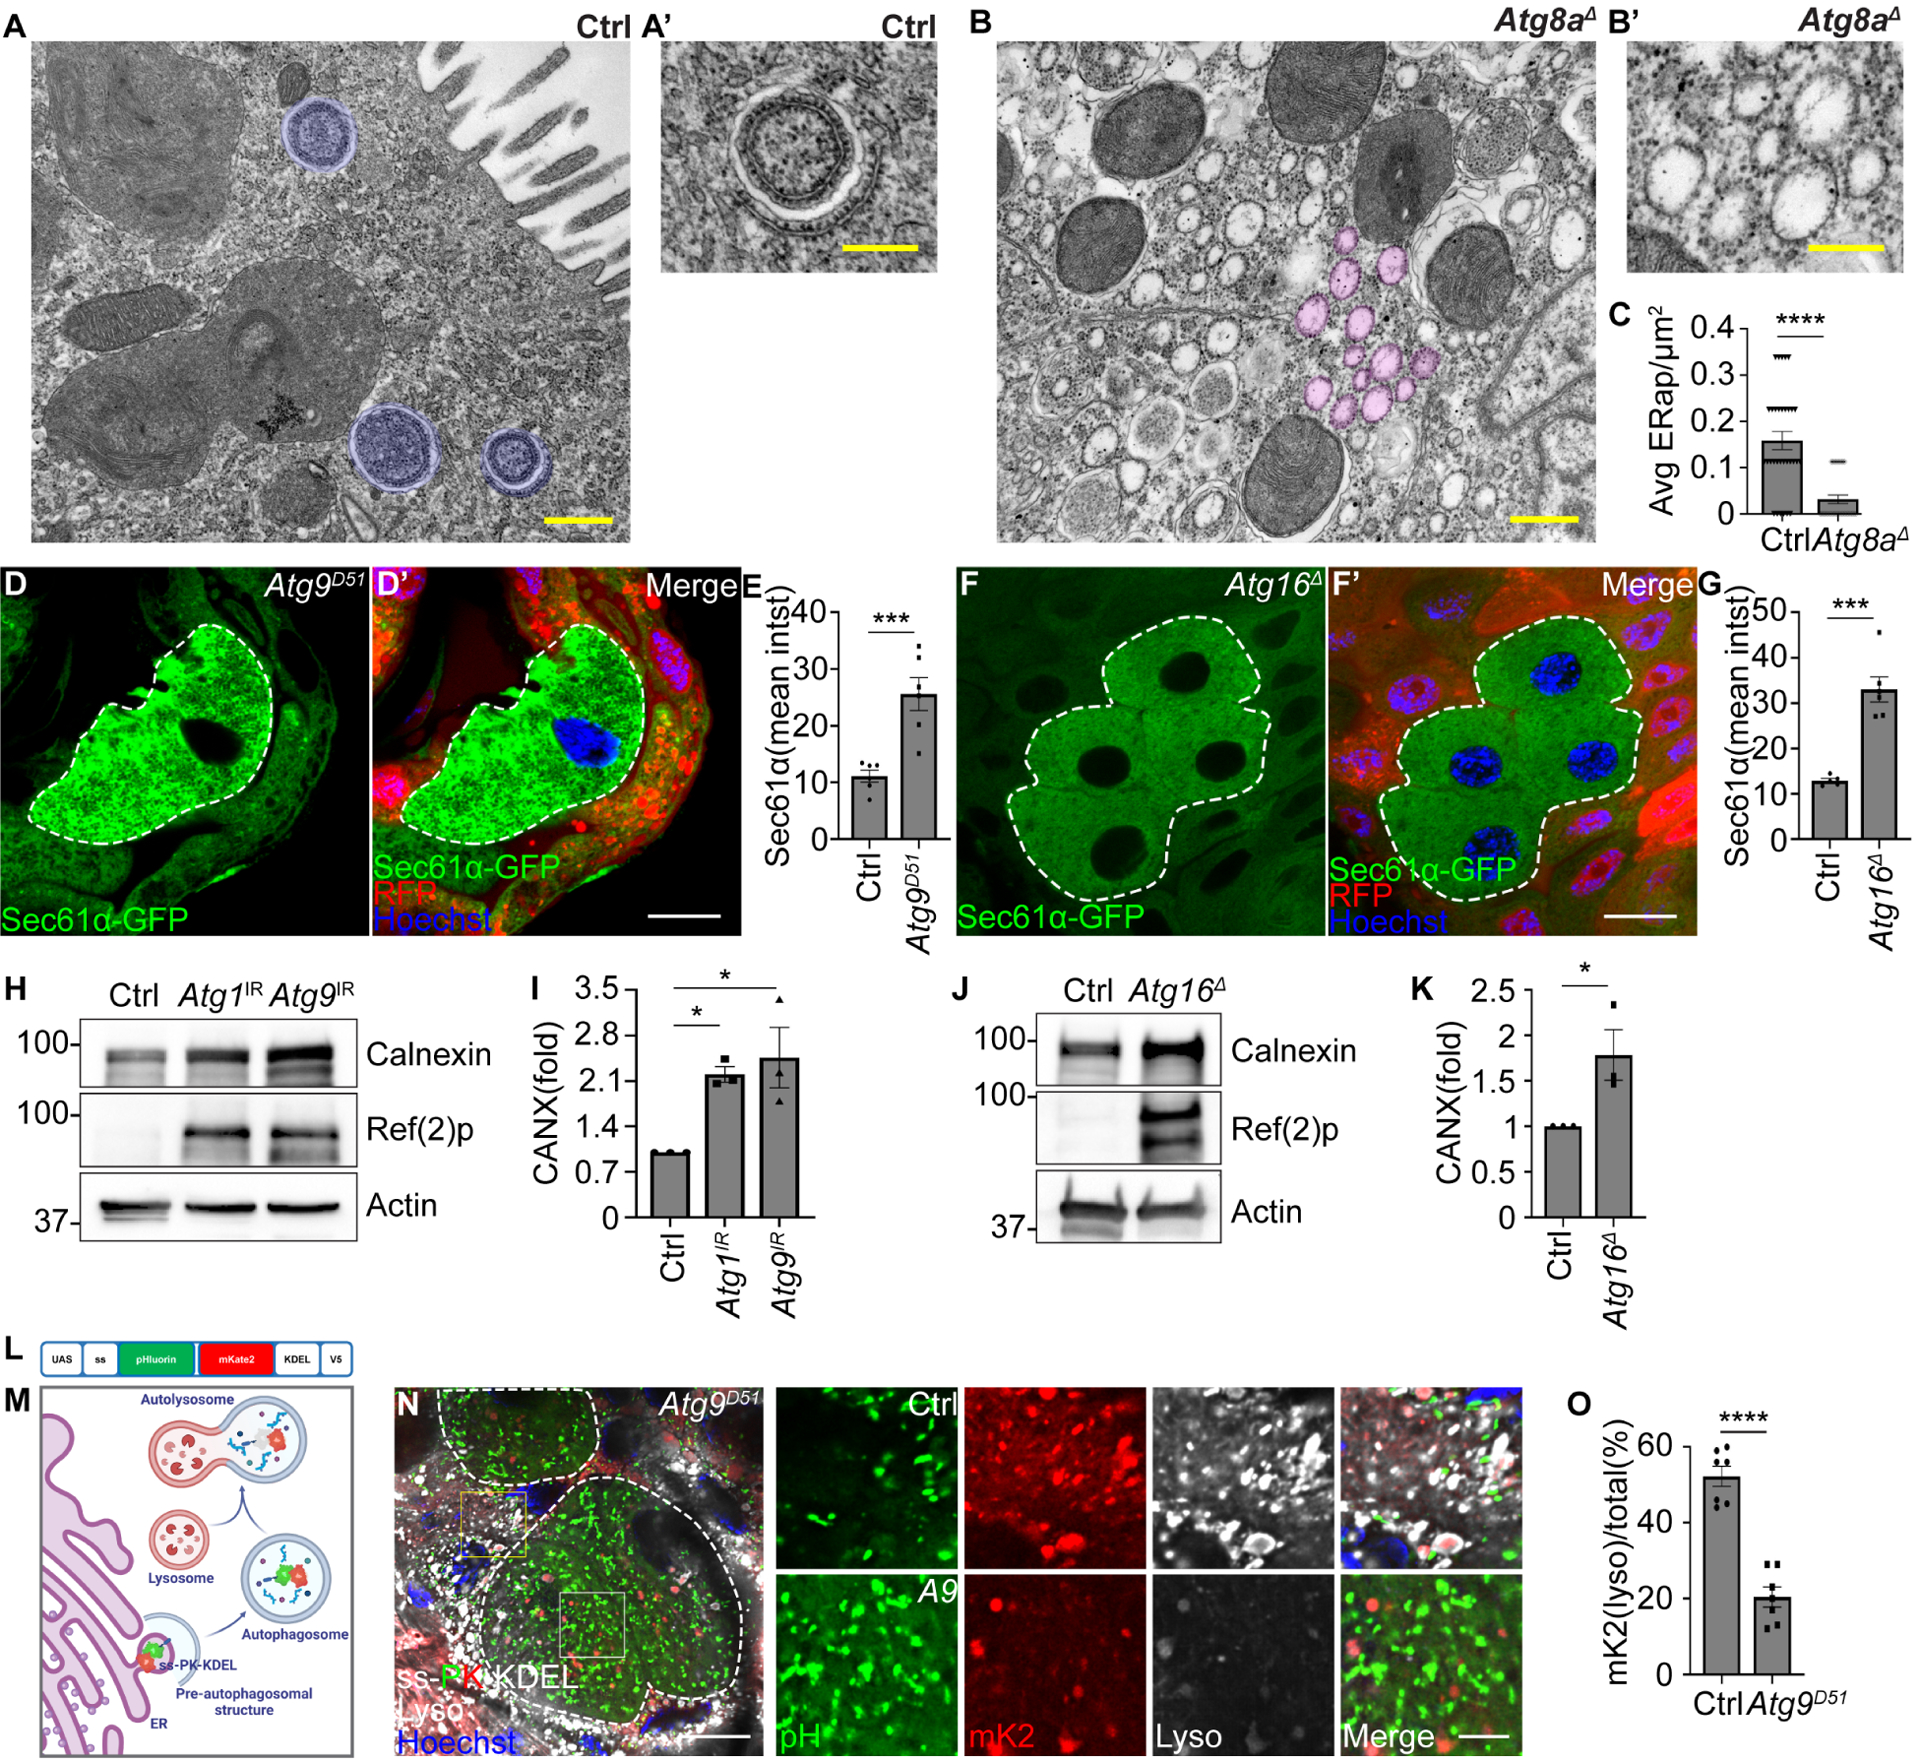
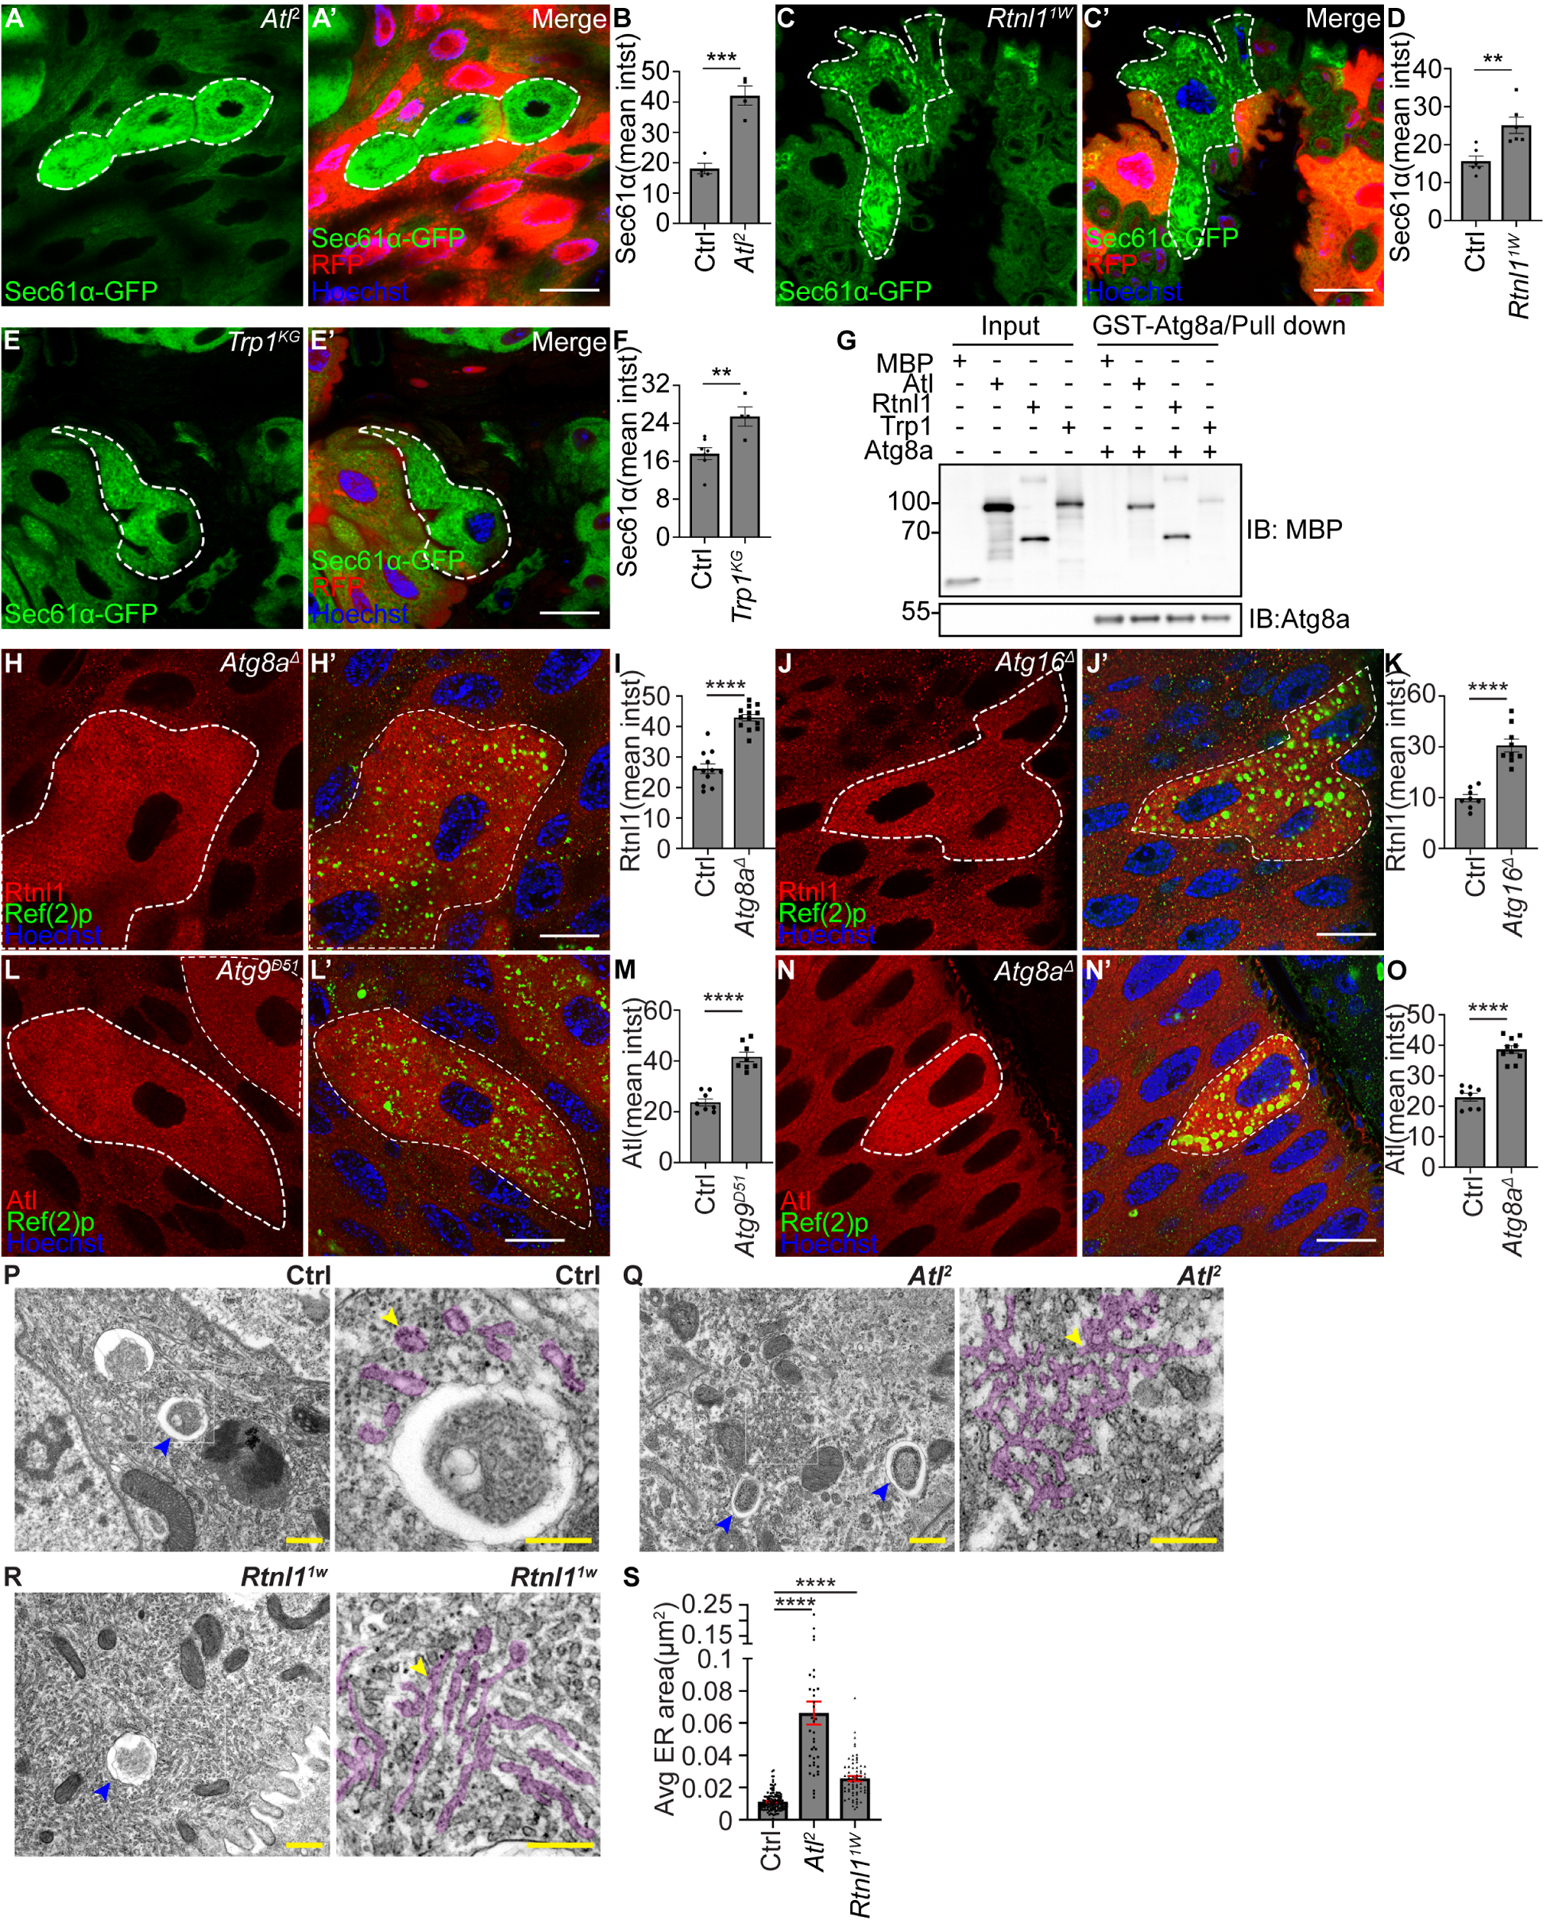
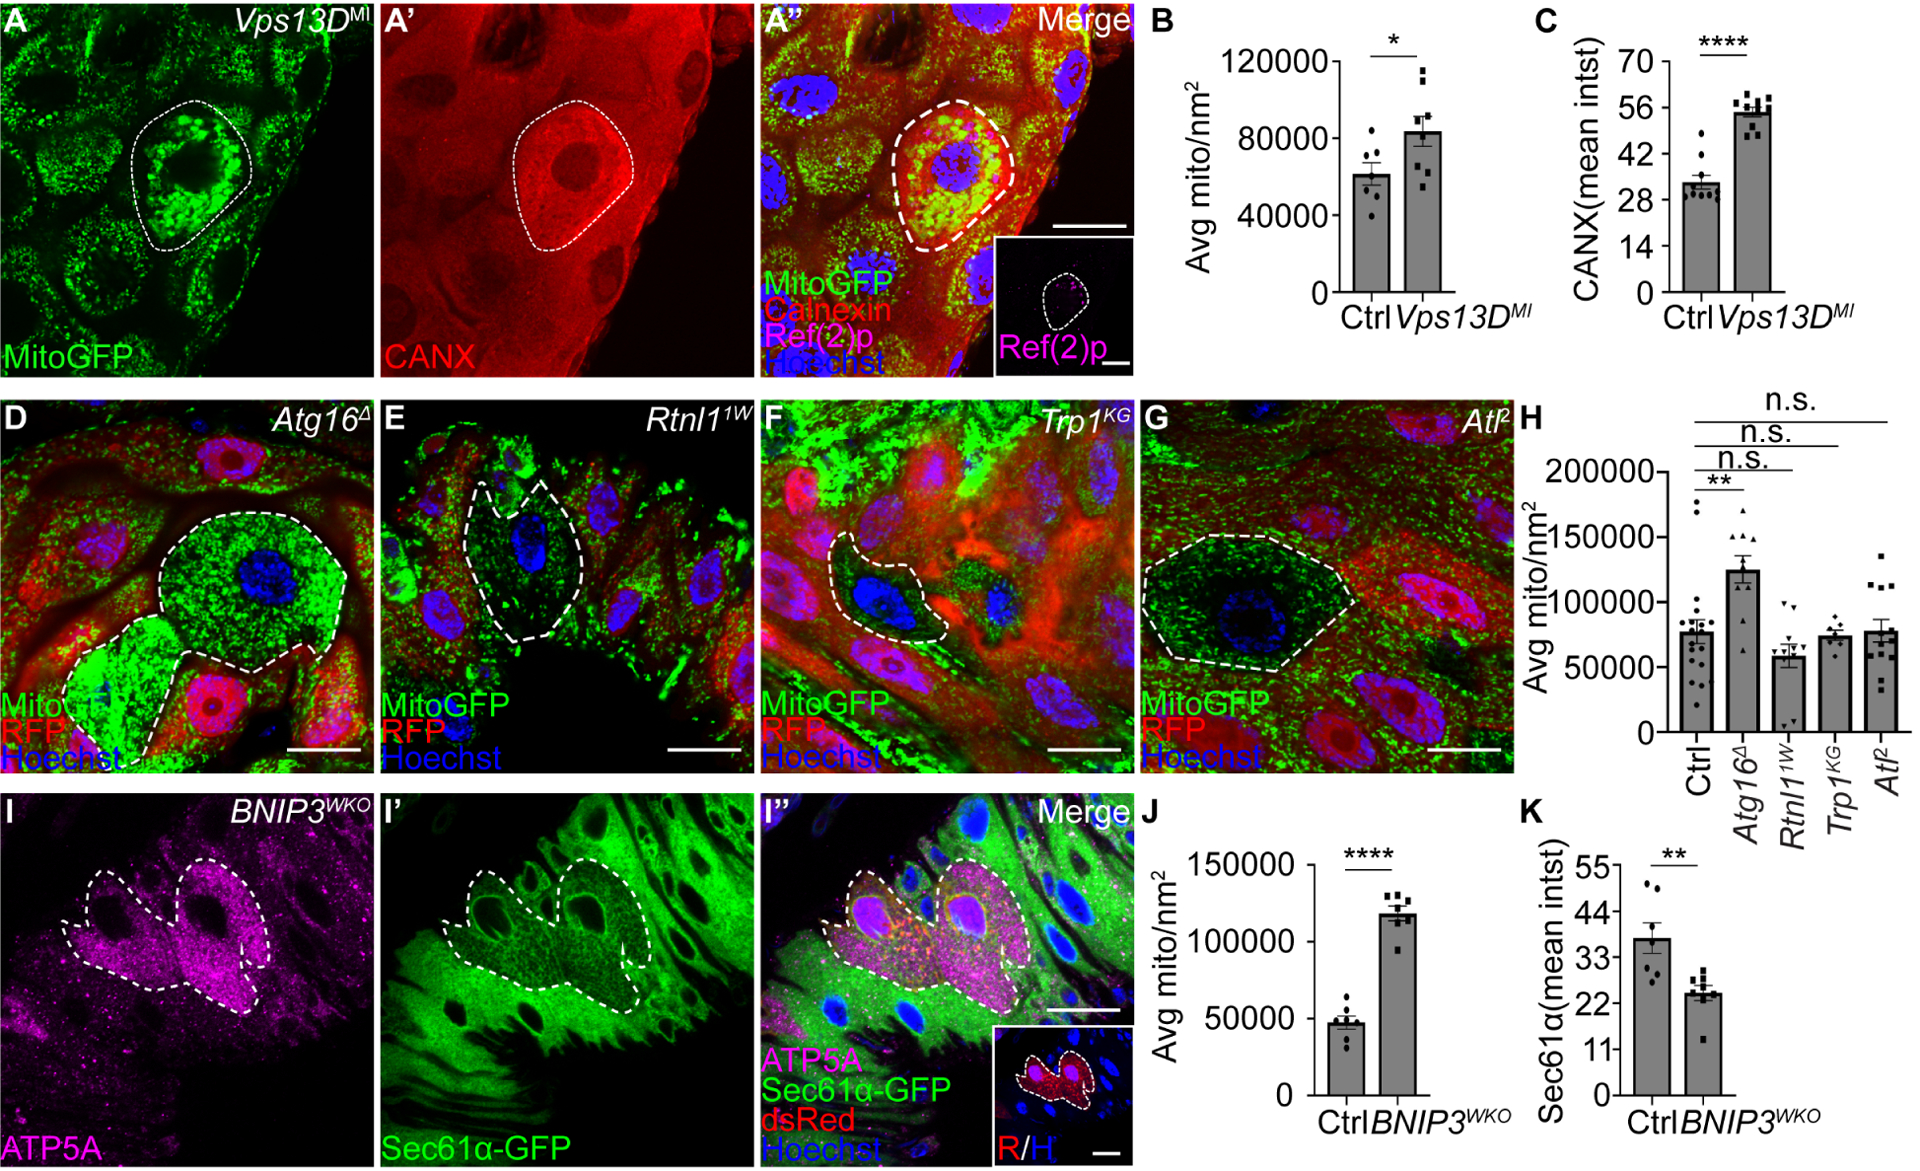
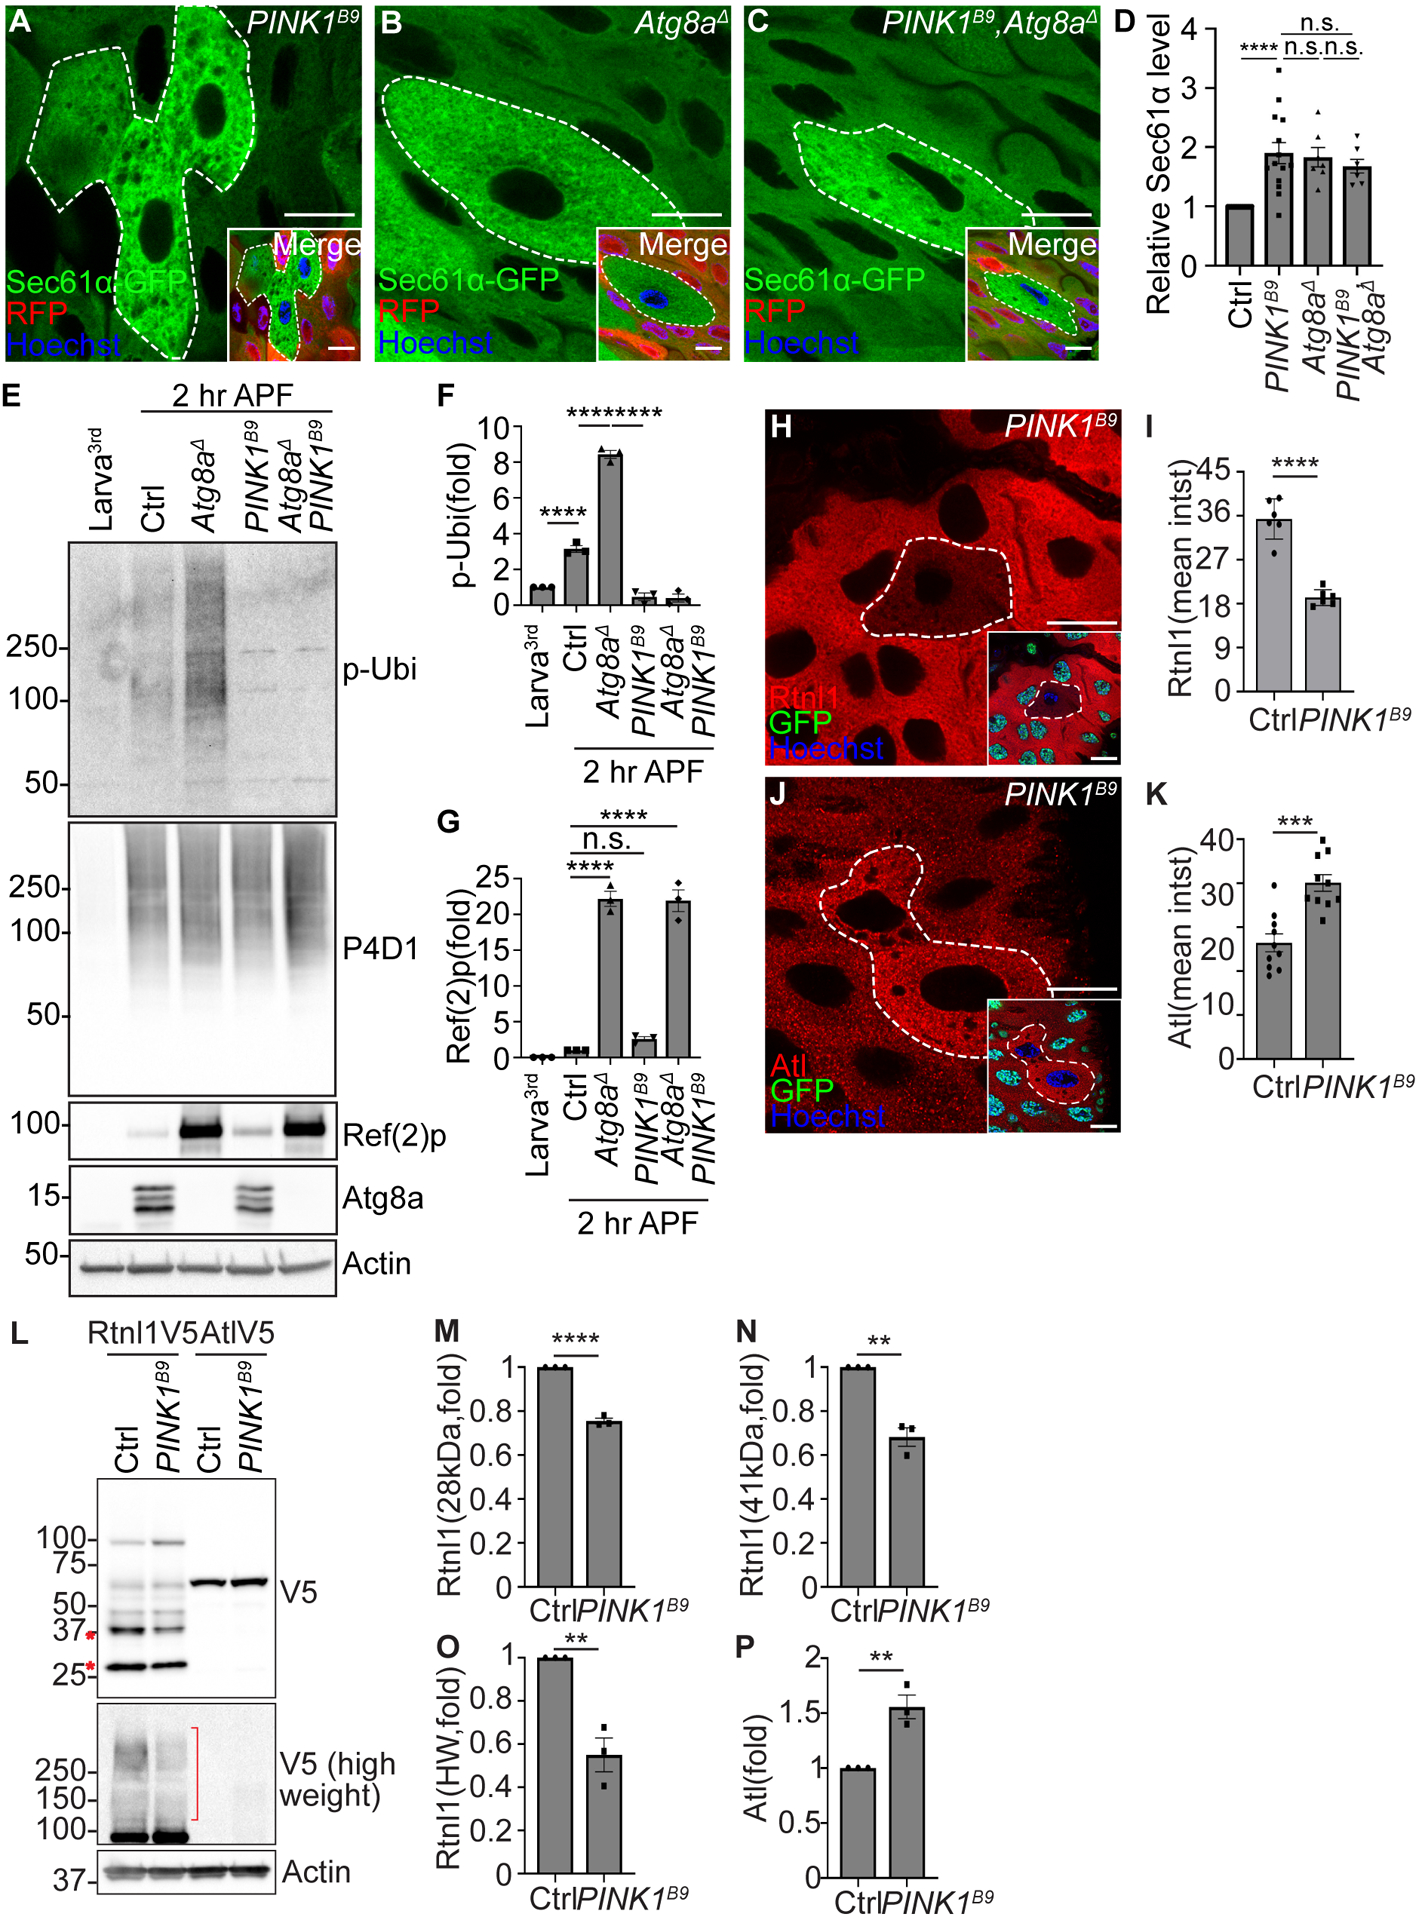
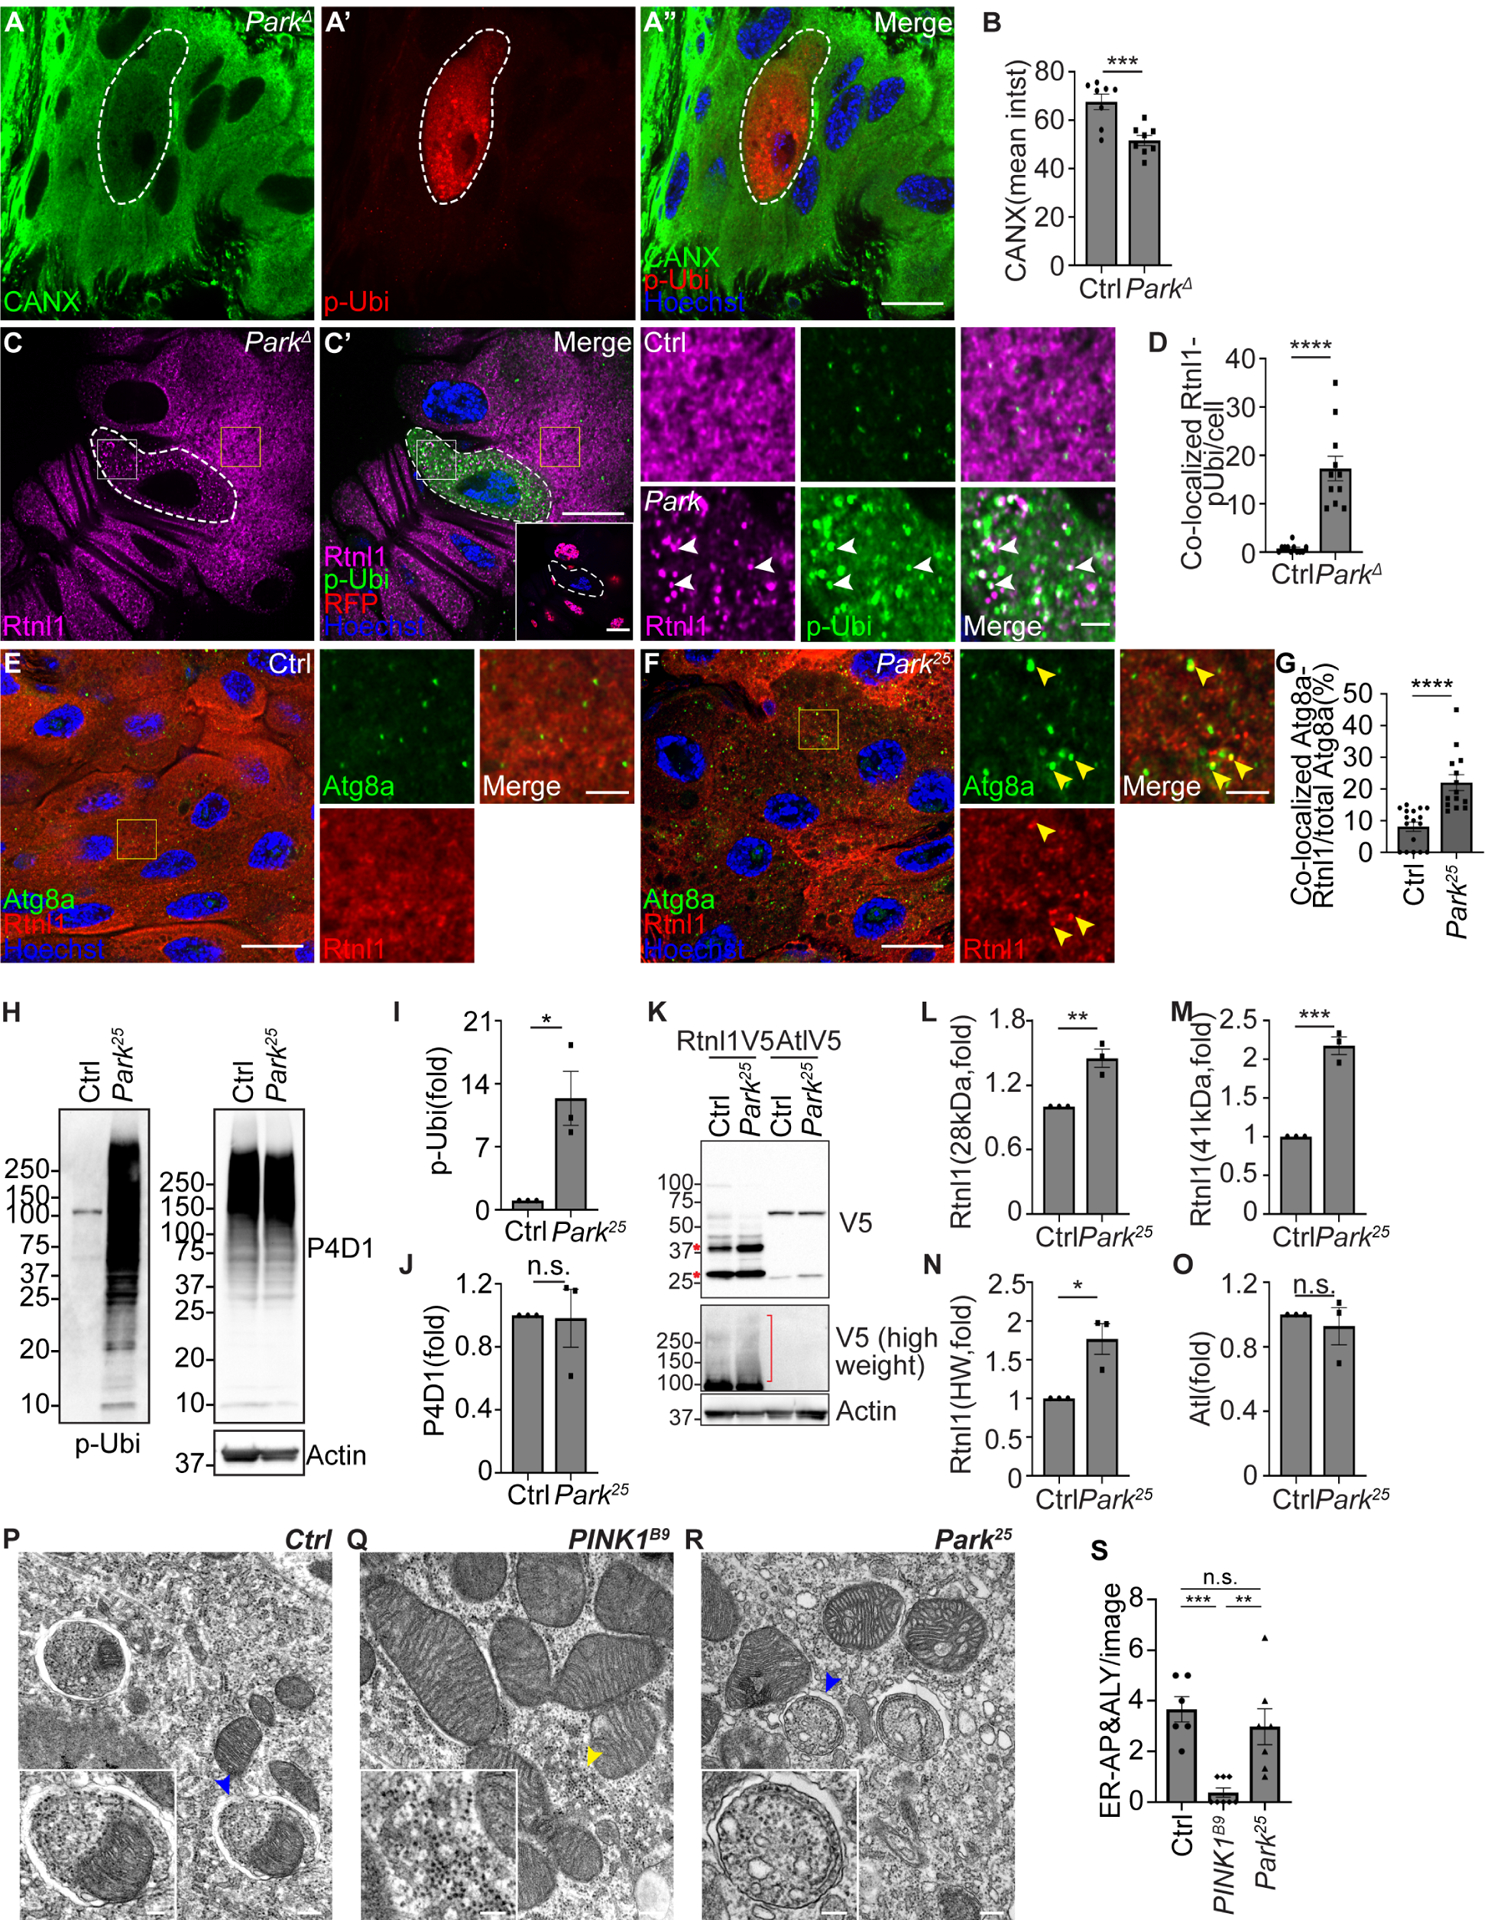
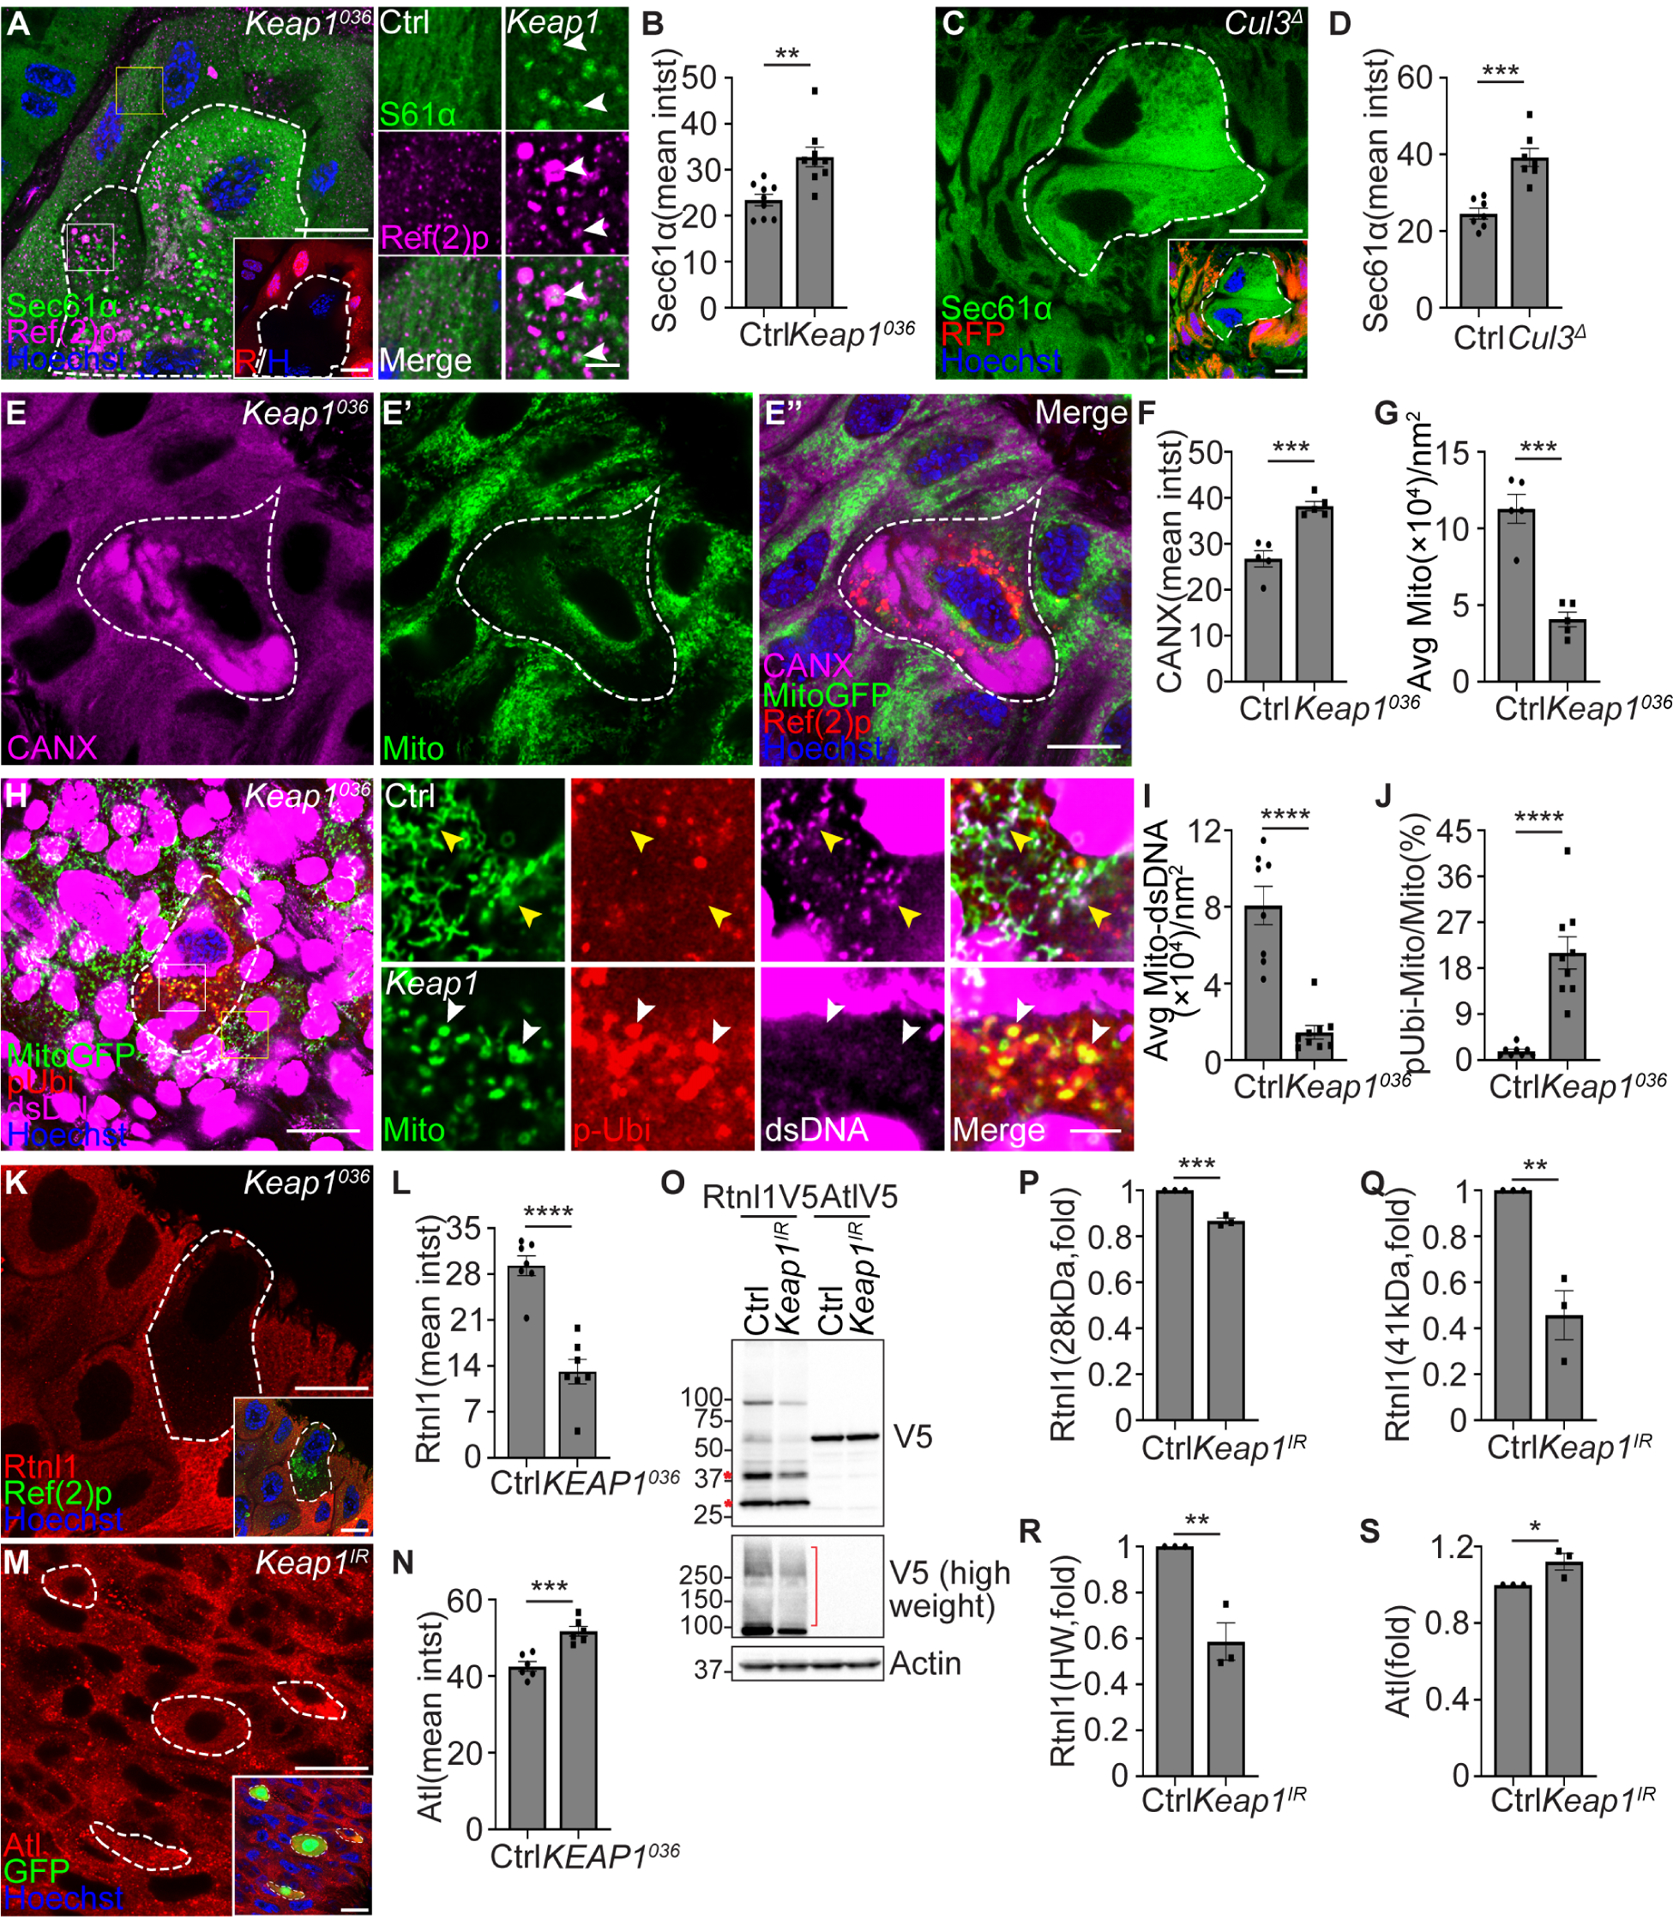
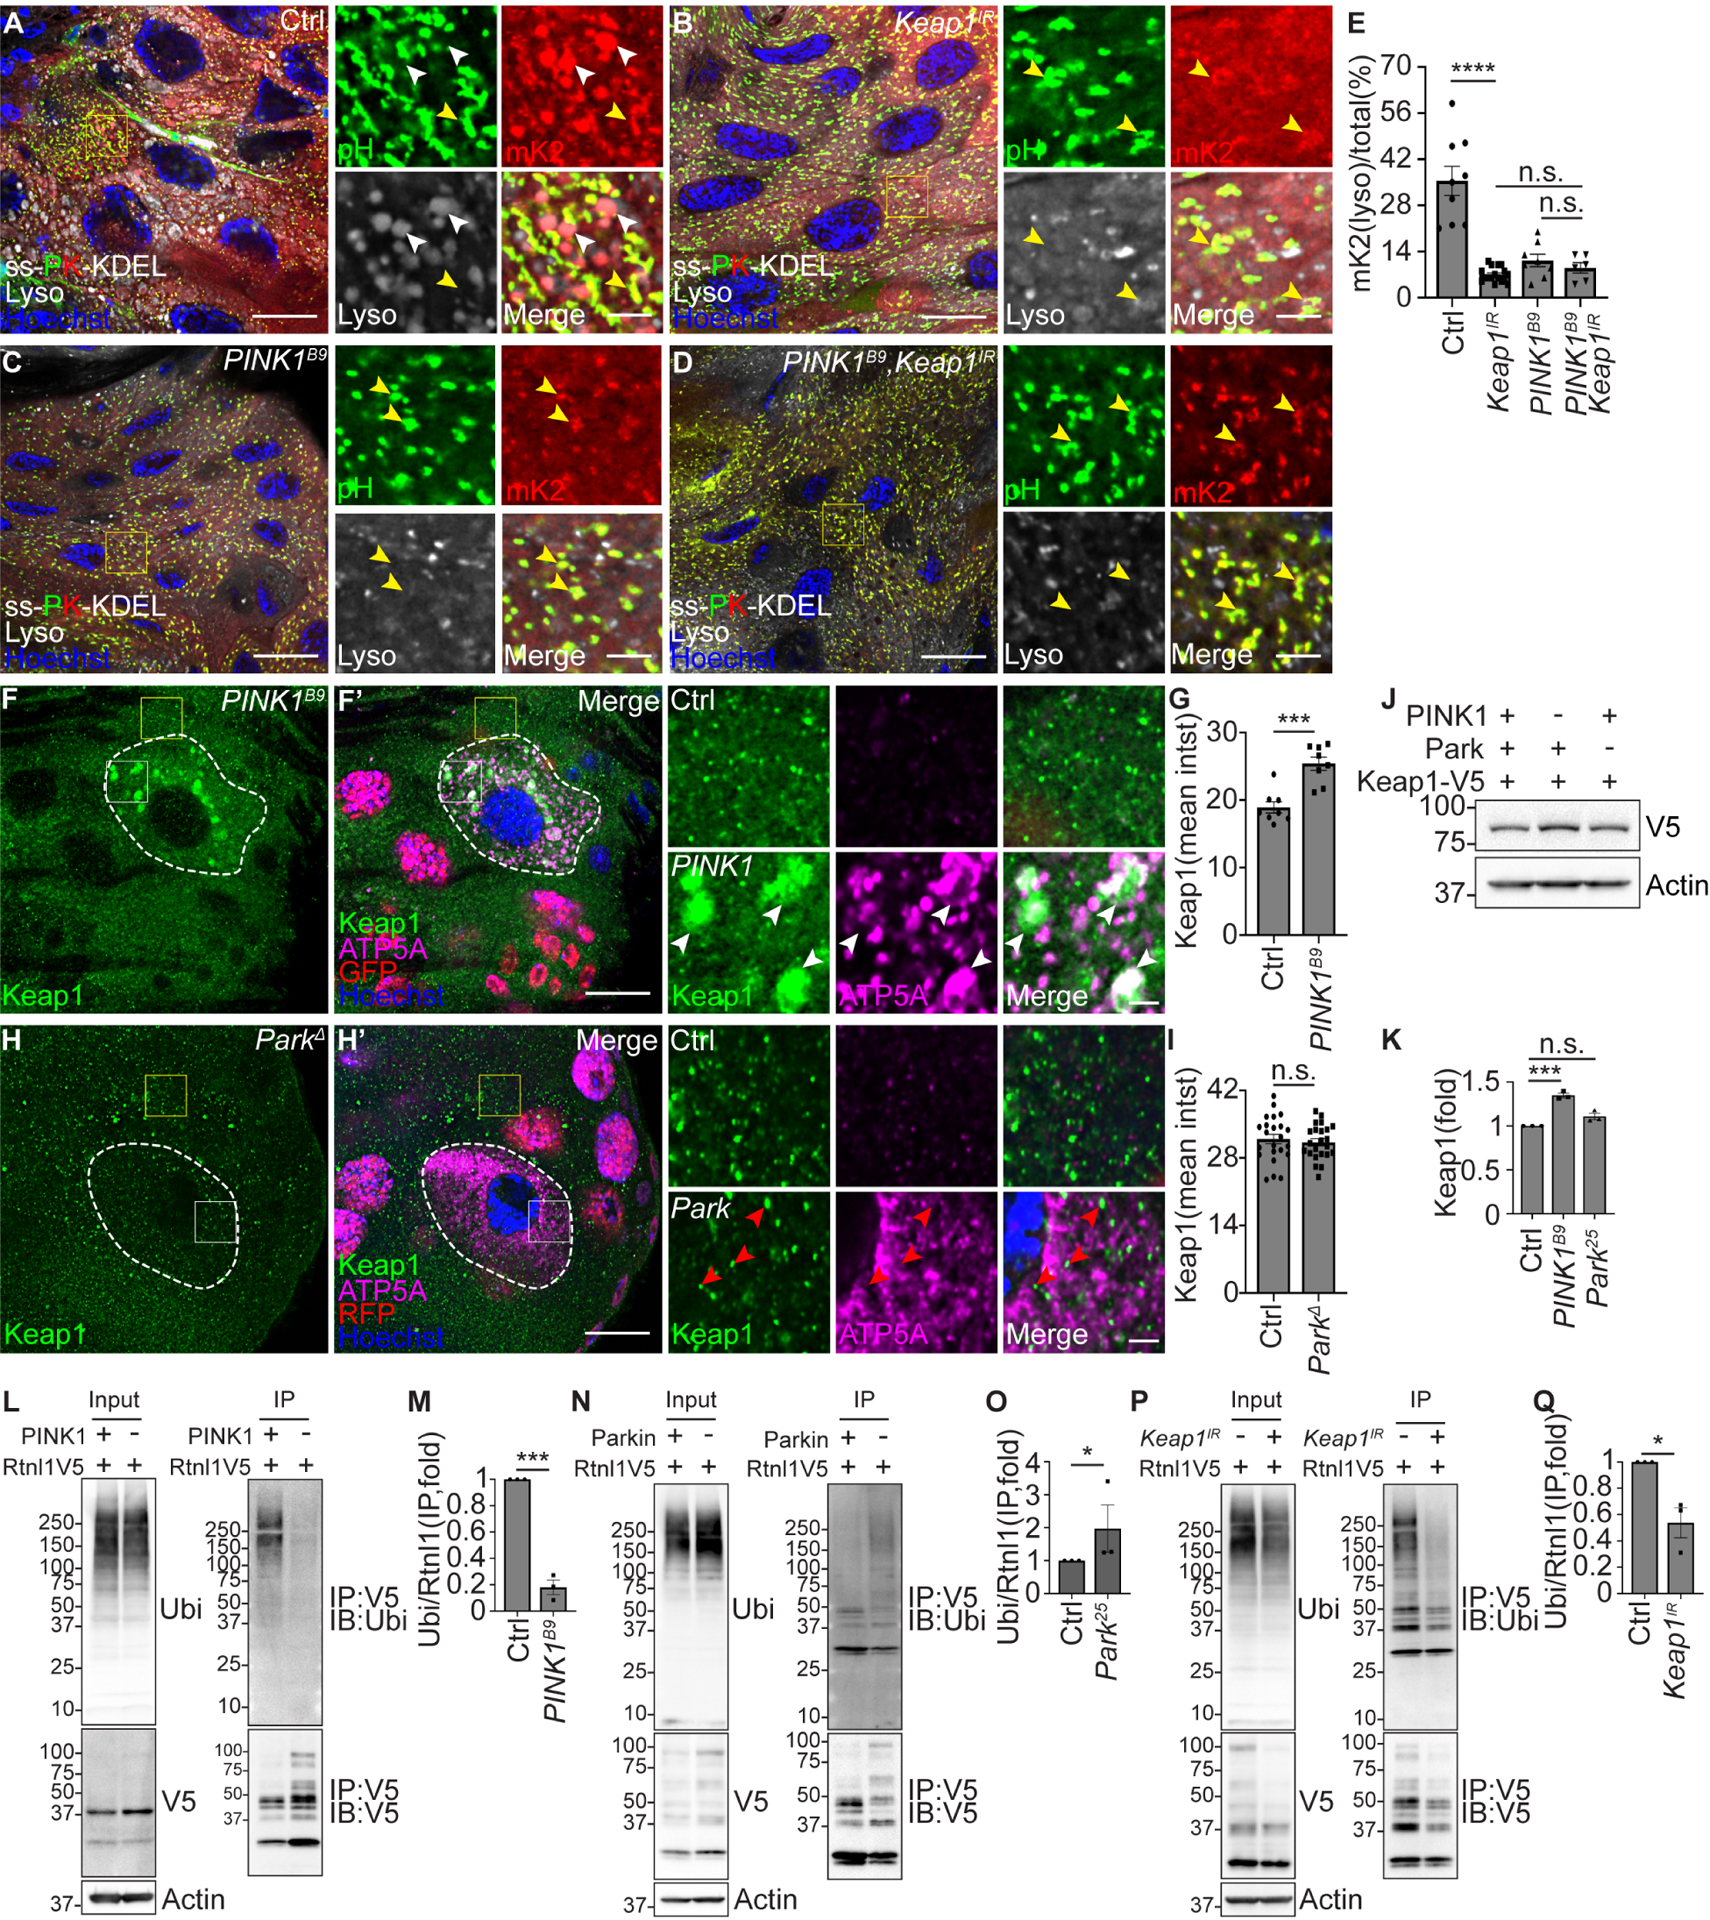
Selective clearance of organelles, including endoplasmic reticulum (ER) and mitochondria, by autophagy plays an important role in cell health. Here, we describe a developmentally programmed selective ER clearance by autophagy. We show that Parkinson's disease-associated PINK1, as well as Atl, Rtnl1, and Trp1 receptors, regulate ER clearance by autophagy. The E3 ubiquitin ligase Parkin functions downstream of PINK1 and is required for mitochondrial clearance while having the opposite function in ER clearance. By contrast, Keap1 and the E3 ubiquitin ligase Cullin3 function downstream of PINK1 to regulate ER clearance by influencing Rtnl1 and Atl. PINK1 regulates a change in Keap1 localization and Keap1-dependent ubiquitylation of the ER-phagy receptor Rtnl1 to facilitate ER clearance. Thus, PINK1 regulates the selective clearance of ER and mitochondria by influencing the balance of Keap1- and Parkin-dependent ubiquitylation of substrates that determine which organelle is removed by autophagy.

Keywords: Drosophila; ER-phagy; Keap1; PINK1; Parkin; Rtnl1.


Conflict of interest statement

Declaration of interests The authors declare no competing interests.

Figures

Figure 1.
Figure 1.. Autophagy regulates ER clearance during development.
(A and B) TEM images of homozygous Atg8aΔ mutant enterocytes exhibit decreased ER in autophagic structures, and reveal increased dilated ER surrounded by ribosomes compared to control (Atg8aΔ/+) cells. Blue masks label ER-autophagosomes. Magenta masks label dilated ER. (C) Quantification of average ER-autophagosomes per μm2 (ERap/μm2) in Atg8a mutant compared to control cells. n = 32 (Ctrl), n = 32 (Atg8aΔ) images from at least 3 animals were quantified. (D and D’) Atg9D51 mutant enterocytes (lacking RFP, white dotted line) exhibit increased Sec61α (green) compared to control cells (red). (E) Quantification of Sec61α mean intensity (mean intst) in Atg9 mutant cells compared to control cells. n = 6 (Ctrl) cells and n = 6 (Atg9D51) cells were measured. (F and F’) Atg16Δ mutant enterocytes (lacking RFP, white dotted line) possess increased Sec61α (green) compared to control cells (red). (G) Quantification of Sec61α mean intensity (mean intst) in Atg16 mutant cells compared to control cells. n = 5 (Ctrl), n = 6 (Atg16Δ) cells were measured. (H) Calnexin and Ref(2)p levels in Atg1 RNAi knockdown (Atg1 IR) intestines, Atg9 RNAi knockdown (Atg9 IR) intestines, and control intestines analyzed by western blot. (I) Quantification of the ratio (fold) of Calnexin (CANX)/Actin normalized to control. n = 3 independent experiments. (J) Calnexin and Ref(2)p levels in homozygous Atg16Δ mutant and control intestines analyzed by western blot. (K) Quantification of the ratio (fold) of Calnexin (CANX)/Actin normalized to control. n = 3 independent experiments. (L) Diagram of ER-phagy sensor. (M) Schematic of ER-phagy detection using the ss-pHluorin-mKate2-KDEL-V5 sensor. (N) Atg9D51 mutant enterocytes (white dotted line) that express ss-pHluorin-mKate2-KDEL-V5 (ss-PK-KDEL) in all cells exhibit increased cell size and decreased ss-mKate2-KDEL puncta (red puncta, mK2) co-localization with lysotracker (gray) compared to control cells (smaller cells). (O) Quantification of ss-mKate2-KDEL puncta co-localized with lysotracker in Atg9 mutant cells compared to control cells. n = 7 (Ctrl), n = 7 (Atg9D51), cells were measured. All animals were staged 2 hours APF. Scale bars in (A) and (B) represent 0.5 μm and scale bars in (A’) and (B’) represent 0.25 μm. Scale bars in (D), (F), and (N) represent 20 μm and scale bar in inset (N) represent 5 μm. Insets in (N) are from indicated rectangles (white rectangle = Atg9 mutant cell, yellow rectangle = control cell). Data are presented as mean ± SEM. *. p<0.05, ***, p<0.001, ****, p<0.0001 from One-way ANOVA corrected by Tukey’s post-hoc test and unpaired, two-tailed t-test. Representative of 3 or more independent biological experiments. See also Figure S1.
Figure 2.
Figure 2.. Atg8a binding and ER-localized proteins regulate ER clearance.
(A and A’) Atl2 mutant intestine enterocytes (lacking RFP) exhibit increased Sec61α (green) compared to control cells (red). (B) Quantification of Sec61α mean intensity (mean intst) in Atl mutant compared to control cells. n = 4 (Ctrl) cells and n = 4 (Atl2) cells were measured. (C and C’) Rtnl11w mutant intestine enterocytes (lacking RFP) possess increased Sec61α (green) compared to control cells (red). (D) Quantification of Sec61α mean intensity (mean intst) in Atl mutant compared to control cells. n = 6 (Ctrl) cells and n = 6 (Rtnl11W) cells were measured. (E and E’) Trp1KG mutant enterocytes (lacking RFP) exhibit increased Sec61α-GFP (green) compared to control cells (red). (F) Quantification of Sec61α mean intensity (mean intst) in Trp1 mutant compared to control cells. n = 7 (Ctrl) cells and n = 4 cells (Trp1KG) were measured. (G) Physical interactions between MBP, MBP-Atl, MBP-Rtnl1 and MBP-Trp1 with GST-Atg8a. (H and H’) Enterocytes expressing Rtnl1–3×Flag-V5 possess increased Rtnl1 (red, detected by anti-V5 antibody) and Ref(2)p puncta (green) in Atg8aΔ mutant compared to control cells. Ref(2)p puncta were used to label Atg8aΔ mutant cells. (I) Quantification of Rtnl1 intensity in Atg8aΔ mutant compared to control cells. n = 12 (Ctrl), n = 13 (Atg8aΔ) cells were measured. (J and J’) Enterocytes expressing Rtnl1–3×Flag-V5 possess increased Rtnl1 (red, detected by anti-V5 antibody) and Ref(2)p puncta (green) in Atg16Δ mutant compared to control cells. Ref(2)p puncta were used to label Atg16Δ mutant cells. (K) Quantification of Rtnl1 intensity in Atg16Δ mutant compared to control cells. n = 8 (Ctrl), n = 9 (Atg16Δ) cells were quantified. (L and L’) Enterocytes expressing Atl-3×Flag-V5 possess increased Atl (red, detected by anti-V5 antibody) and Ref(2)p puncta (green) in Atg9D51 mutant compared to control cells. Ref(2)p puncta were used to label Atg9D51 mutant cells. (M) Quantification of Atl intensity in Atg9D51 mutant compared to control cells. n = 8 (Ctrl), n = 8 (Atg9D51) cells were quantified. (N and N’) Enterocytes expressing Atl-3×Flag-V5 possess increased Atl (red, detected by anti-V5 antibody) and Ref(2)p puncta (green) in Atg8aΔ mutant compared to control cells. Ref(2)p puncta were used to label Atg8aΔ mutant cells. (O) Quantification of Atl intensity in Atg8aΔ mutant compared to control cells. n = 8 (Ctrl), n = 10 (Atg8aΔ) cells were quantified (P-R) TEM images reveal distinct ER structures in homozygous Atl2 and Rtnl11w mutant and control intestine cells. Blue arrowheads indicate ER in autophagic structures. Yellow arrowheads indicate ER structures. Magenta masks in the insets label rough ER structures. (S) Quantification of 3–5 rough ER area per image in Atl and Rtnl1 mutant compared to control cells. n = 132 (Ctrl), n = 39 (Atl2), n = 67 (Rtnl11W) ER structures from 60 (Ctrl), 45 (Atl2), 51 (Rtnl11W) images measured. All animals were staged 2 hours APF. Mutant cells are indicated with white dotted lines. Scale bars in (A), (C), (E), (H), (J), (L) and (N) represent 20 μm. Scale bars in (P) to (R) lower magnification represent 0.5 μm, and scales bars in insets represent 0.25 μm. Data are presented as mean ± SEM. **, p<0.01, ***, p<0.001, ****, p<0.0001 from unpaired, two-tailed t-test and One-Way ANOVA corrected by Tukey’s post-hoc test. Representative of 3 or more independent biological experiments. See also Figure S2.
Figure 3.
Figure 3.. Selective organelle clearance requires both common regulators and distinct autophagy receptors for each organelle.
(A-A”) Vps13DMI mutant cells exhibit increased Mito-GFP (A, green), Calnexin (A’, red, CANX) and Ref(2)p (magenta, inset in A”) compared to control cells. Quantification of average Mito-GFP puncta per μm2 in Vps13D mutant compared to respective control cells. n = 7 (Ctrl), n = 8 (Vps13DMI) cells were measured. Quantification of Calnexin mean intensity (mean intst) in Vps13D mutant cells compared to control cells. n = 10 (Ctrl), n = 10 (Vps13DMI) cells were measured. (D-G) Atg16Δ, Rtnl11w, Trp1KG and Atl2 mutant enterocytes (lacking RFP) exhibit either elevated Mito-GFP (green) puncta (Atg16Δ) or comparable Mito-GFP puncta (Rtnl11w, Trp1KG and Atl) compared to control cells (red). (H) Quantification of Mito-GFP puncta in Atg16, Rtnl1, Trp1 and Atl mutant compared to respective control cells. n = 19 (Ctrl), n = 10 (Atg16Δ), n = 11 (Rtnl11w), n = 7 (Trp1KG), n = 13 (Atl2) cells were measured. (I-I”) Intestine cells expressing Cas9 and dsRed (red) in BNIP3 dual-gRNA (BNIP3WKO) transgenic flies that express Sec61a-GFP in all cells exhibit increased levels of ATP5A puncta (I, magenta) and decreased intensity of Sec61a-GFP (I’, green) compared to control cells. (J) Quantification of average ATP5A puncta per μm2 in BNIP3 mutant cells compared to control cells. n = 7 (Ctrl), n = 7 (BNIP3WKO) cells were measured. (K) Quantification of Sec61α mean intensity (mean intst) in BNIP3 mutant compared to control cells. n = 7 (Ctrl), n = 8 (BNIP3WKO) cells were measured. All animals were staged 2 hours APF. Mutant cells are indicated with white dotted lines. Scale bars in (A”), (D-G), (I) and scale bar in inset (A”) and (I”) represent 20 μm. Data are presented as mean ± SEM. n.s. = not significant, *, p<0.05, **, p<0.01, ****, p<0.0001 from unpaired, twotailed t-test and One-Way ANOVA corrected by Tukey post-hoc test. Representative of 3 or more independent biological experiments. See also Figure S3.
Figure 4.
Figure 4.. PINK1 regulates developmentally programmed ER clearance.
(A to C) PINK1B9 single mutant (A), Atg8aΔ single mutant (B), and PINK1B9 and Atg8aΔ double (C, PINK1B9, Atg8aΔ) mutant intestine cells (lacking RFP, white dotted line) exhibit increased Sec61α (green) compared to respective control cells (red). PINK1B9 and Atg8aΔ (C) double mutant cells possess comparable Sec61α-GFP intensity to either PINK1B9 or Atg8aΔ single mutant icells 2 hours APF. (D) Quantification of relative Sec61α-GFP intensity in PINK1 single, Atg8a single, and PINK1 Atg8a double mutant cells normalized to Sec61α-GFP intensity in respective control cells. n = 14 (Ctrl), n = 14 (PINK1B9), and n = 7 (PINK1B9, Atg8aΔ) cells were measured. (E) Western blot analysis of phospho-ubiquitin (serine 65, p-Ubi), pan-ubiquitin (P4D1), Ref(2)p, Atg8a and Actin in feeding third larval instar (Larva3rd) w1118, w1118 (Ctrl2 hr APF), Atg8aΔ single mutant (2 hr APF), PINK1B9 single mutant (2 hr APF), and PINK1B9 Atg8aΔ double mutant (2 hr APF) intestines. (F) Quantification of the ratio of phospho-ubiquitin (S65)/pan-ubiquitin (P4D1) normalized to larva. n = 3 independent experiments. (G) Quantification of the ratio of Ref(2)p/actin normalized to larva. n = 3 independent experiments. (H) Intestines from animals containing Rtnl1–3×Flag-V5 possess decreased Rtnl1 (red, detected by anti-V5 antibody) in PINK1B9 mutant (white dotted line, non-green nuclei) compared to control cells 2 hours APF. (I) Quantification of Rtnl1 intensity in PINK1B9 mutant compared to control cells. n = 6 (Ctrl), n = 6 (PINK1B9) cells were measured. (J) Intestines from animals containing Atl-3×Flag-V5 possess increased Atl (red, detected by anti-V5 antibody) in PINK1B9 mutant (white dotted line, non-green nuclei) compared to control cells 2 hours APF. (K) Quantification of Atl intensity in PINK1B9 mutant compared to control cells. n = 10 (Ctrl), n = 10 (PINK1B9) cells were measured. (L) Rtnl1 and Atl levels in male homozygous PINK1B9 mutant and control intestines 2 hours APF analyzed by western blot. Rtnl1 and Atl were detected by anti-V5 antibody. (M) Quantification of 28 kDa Rtnl1 in PINK1B9 mutant normalized to control intestines. n = 3 independent experiments. (N) Quantification of 41 kDa Rtnl1 in PINK1B9 mutant normalized to control intestines. n = 3 independent experiments. (O) Quantification of high molecular weight (>100kDa, HW) Rtnl1 in PINK1B9 mutant normalized to control intestines. n = 3 independent experiments. (P) Quantification of Atl in PINK1B9 mutant normalized to control intestines. n = 3 independent experiments. Scales bars in (A to C, H and J) represent 20 μm. Data are presented as mean ± SEM. n.s. = not significant, **, p<0.01, ***, p<0.001, ****, p<0.0001 from One-Way ANOVA Fisher’s LSD test and unpaired, two tailed t-test. Representative of 3 or more independent biological experiments. See also Figure S4.
Figure 5.
Figure 5.. Parkin facilitates mitophagy and inhibits ER-phagy.
(A) ParkΔ mutant cells (white dotted line) exhibit decreased calnexin (green), increased phospho-ubiquitin (serine 65, red, p-Ubi) compared to control cells. p-Ubi was used to locate ParkΔ mutant cells. (B) Quantification of calnexin mean intensity (mean intst) in ParkΔ mutant compared to control cells. n = 8 (Ctrl), n = 8 (ParkΔ) cells were measured. (C) Intestines from animals that contain Rtnl1–3×Flag-V5 possess decreased Rtnl1 intensity (magenta, detected by anti-V5 antibody) with increased fragmented Rtnl1 puncta that partially co-localize with phospho-ubiquitin (serine 65, green, p-Ubi) in ParkΔ mutant (white dotted line, non-red nuclei) compared to control cells. (D) Quantification of co-localized Rtnl1 puncta with phosphorylated-ubiquitin puncta in Park mutant compared to control cells. n = 11 (Ctrl), n = 11 (ParkΔ) cells were quantified. (E-F) Park25 mutant enterocytes (F) that contain Rtnl1–3xFlag-V5 (detected by anti-V5 antibody, red) exhibit increased Atg8a (green) puncta and increased co-localization of Atg8a with Rtnl1 puncta compared to control enterocytes (E). (G) Quantification of the ratio of co-localized Atg8a-Rtnl1 puncta of total Atg8a puncta (%) in Park mutant compared to control intestine cells. n = 17 (Ctrl), n = 14 (Park25) cells were analyzed. (H) Western blot analysis of phospho-ubiquitin (serine 65, p-Ubi), pan-ubiquitin (P4D1), and Actin in Park25 mutant and control (Ctrl) intestines. (I) Quantification of the ratio of phospho-ubiquitin (S65)/pan-ubiquitin (P4D1) in Park mutant normalized to control intestines. n = 3 independent experiments. (J) Quantification of the ratio of pan-ubiquitin/Actin in Park mutant normalized to control intestines. n = 3 independent experiments. (K) Rtnl1 and Atl levels in homozygous Park25 mutant and control intestines analyzed by western blot. Rtnl1 and Atl were detected by anti-V5 antibody. (L) Quantification of 28 kDa Rtnl1 in Park25 mutant intestines normalized to control intestines. n = 3 independent experiments. (M) Quantification of 41 kDa Rtnl1 in Park25 mutant intestines normalized to control intestines. n = 3 independent experiments. (N) Quantification of high molecular weight (>100kDa, HW) Rtnl1 in Park25 mutant intestines normalized to control intestines. n = 3 independent experiments. (O) Quantification of Atl in Park25 mutant intestines normalized to control intestines. n = 3 independent experiments. (P-R) TEM images reveal that control w1118 intestines possess autophagosomes containing both ER and mitochondria (P), male homozygous PINK1B9 mutant intestines exhibit decreased autophagosomes/autolysosomes that contain ER (Q), and homozygous Park25 loss-of-function mutant intestines exhibit comparable autophagosomes containing ER structures (R) compared to control intestines. Blue arrowheads in (P) and (R) indicate ER in autophagic structures. Yellow arrowhead in (Q) indicates ER structures. (S) Quantification of ER-containing autophagosomes (AP) and autolysosomes (ALY) in each image. n = 6 (Ctrl), n = 8 (PINK1B9), n = 7 (Park25) images were quantified. All animals were staged 2 hours APF. Scale bars in (A”), (C), (E) and (F) represent 20 μm. Scale bars in (C), (E) and (F) insets represent 5 μm. Scale bars in (P), (Q) and (R) represent 0.2 μm, and scale bars in the inset represent 0.1 μm. Insets in (C), (E) and (F) are from indicated rectangles (white rectangle = Park mutant cell, yellow rectangle = control cell). Data are presented as mean ± SEM. n.s. = not significant, *, p<0.05, **, p<0.01, ***, p<0.001, ****, p<0.0001 from One-Way ANOVA corrected by Tukey post-hoc test and unpaired, two-tailed ttest. Representative of 3 or more independent biological experiments. See also Figure S5.
Figure 6.
Figure 6.. Keap1 facilitates ER-phagy and inhibits mitophagy.
(A) Keap1036 mutant intestine cells lacking RFP (red, white dotted line) exhibit increased Sec61α (green) and Sec61α puncta co-localization with Ref(2)p (magenta) puncta compared to the control cells. Control insets (yellow rectangle), and Keap1 mutant insets (white rectangle). White arrowheads indicate co-localized Sec61α and Ref(2)p puncta. (B) Quantification of Sec61α-GFP (Sec61α) mean intensity (Sec61α intst) in Keap1036 mutant compared to control cells. n = 9 (Ctrl), n = 9 (Keap1036) cells were measured. (C) Animals that express Sec61α-GFP in all cells exhibit increased Sec61α-GFP (green) in Cul3Δ mutant enterocytes (white dotted line, non-red) compared to control cells. (D) Quantification of Sec61α-GFP intensity in Cul3Δ mutant compared to control cells. n = 7 (Ctrl), n = 7 (Cul3Δ) cells were quantified. (E-E”) Keap1036 mutant intestine cells exhibit increased calnexin (magenta, CANX) and increased Ref(2)p puncta (red), and decreased Mito-GFP (green, Mito) puncta. Ref(2)p was used to label the Keap1 mutant cells. (F) Quantification of calnexin (CANX) mean intensity (CANX intst) in Keap1 mutant compared to control cells. n = 5 (Ctrl), n = 5 (Keap1036) cells were measured. (G) Quantification of average Mito-GFP puncta (Mito) per nm2 (Avg Mito/nm2) in Keap1 mutant compared to control cells. n = 5 (Ctrl), n = 5 (Keap1036) cells were measured. (H) Keap1036 mutant intestine cells possess decreased mitochondrial DNA (dsDNA, magenta) co-localization with Mito-GFP puncta (green), and increased phospho-ubiquitin (serine 65, red, p-Ubi) co-localization with Mito-GFP puncta compared to control cells. Yellow arrowheads indicate co-localized dsDNA puncta and Mito-GFP puncta. White arrowheads indicate co-localized phospho-ubiquitin puncta and Mito-GFP puncta with lack of dsDNA. (I) Quantification of average Mito-GFP co-localization with dsDNA puncta per nm2 (Avg Mito-dsDNA/nm2) in Keap1 mutant compared to control cells. n = 6 (Ctrl), n = 7 (Keap1036) cells were measured. (J) Quantification co-localized phospho-ubiquitin puncta and Mito-GFP puncta ratio of total Mito-GFP puncta (pUbi-Mito/Mito%) in Keap1 mutant compared to control cells. n = 8 (Ctrl), n = 9 (Keap1) cells were measured. (K) Intestines from animals containing Rtnl1–3×Flag-V5 possess decreased Rtnl1 (red, detected by anti-V5 antibody) in Keap1036 mutant (white dotted line) compared to control cells. Ref(2)p was used to label mutant cells. (L) Quantification of Rtnl1 intensity in Keap1 mutant compared to control cells. n = 7 (Ctrl), n = 7(Keap1036) cells were measured. (M) Intestines from animals containing Atl-3×Flag-V5 possess increased Atl (red, detected by anti-V5 antibody) in Keap1 RNAi knockdown enterocytes (white dotted line, non-green nuclei) compared to control cells. (N) Quantification of Atl intensity in Keap1 RNAi cells compared to control cells. n = 6 (Ctrl), n = 6 (Keap1036) cells were measured (O) Rtnl1 and Atl levels in Keap1 RNAi knockdown and control intestines analyzed by western blot. Rtnl1 and Atl were detected by anti-V5 antibody. (P) Quantification of 28 kDa Rtnl1 in Keap1 RNAi intestines normalized to control intestines. n = 3 (Ctrl), n = 3 (Keap1036) independent experiments. (Q) Quantification of 41 kDa Rtnl1 in Keap1 RNAi intestines normalized to control intestines. n = 3 (Ctrl), n = 3 (Keap1036) independent experiments. (R) Quantification of high molecular weight (>100kDa, HW) Rtnl1 in Keap1 RNAi intestines normalized to control intestines. n = 3 (Ctrl), n = 3 (Keap1IR) independent experiments. (S) Quantification of Atl in Keap1 RNAi intestines normalized to control intestines. n = 3 (Ctrl), n = 3 (Keap1IR) independent experiments. All animals were staged 2 hours APF. Scale bars in (A and inset at the right corner), (C and inset), (E”), (H), (K and inset), (M and inset) represent 20 μm. Scale bars in (A, right panel), (H, right panel) insets represent 5 μm. Insets in (A) and (H) are from indicated rectangles (white rectangle = Keap1 mutant cell, yellow rectangle = control cell). Data are presented as mean ± SEM. n.s. = not significant, **, p<0.01, ***, p<0.001, ****, p<0.0001, from One-Way ANOVA corrected by Tukey post-hoc test and unpaired, two-tailed t-test. Representative of 3 or more independent biological experiments. See also Figure S6.
Figure 7.
Figure 7.. PINK1 influences Keap1 localization, Rtnl1 ubiquitylation and ER clearance.
(A-D) Male Keap1 knockdown (Keap1IR, B) intestines expressing Keap1 RNAi, male PINK1B9 loss-of-function intestines (C) and male PINK1B9 mutant intestines expressing Keap1 RNAi (PINK1B9, Keap1IR, D) that express ss-pHluorin-mKate2-KDEL-V5 exhibit decreased red puncta co-localization with lysotracker (gray) compared to control Luciferase RNAi intestine cells (A). PINK1 and Keap1 double mutant intestines exhibit similar decrease in ER-phagy flux measured by the ER-phagy sensor compared to either of the PINK1 or Keap1 single mutant intestines. Insets are from yellow rectangles. White arrowheads indicate co-localized red puncta and lysotracker puncta. Yellow arrowheads indicate co-localized green and red puncta. (E) Quantification of ratio of lysotracker co-localized red with ss-mKate2-KDEL puncta/total ssmKate2-KDEL puncta (mK2(lyso)/total%). n = 9 (Ctrl), n = 17 (Keap1IR), n = 8 (PINK1B9), n = 6 (PINK1B9, Keap1IR) cells were measured. (F and F’) Intestines from animals that contain Keap1–3×Flag-V5 possess increased and large Keap1 puncta (green, detected by anti-V5 antibody) that co-localize with increased ATP5A puncta (magenta) in PINK1B9 mutant (white dotted line) compared to control cells. (G) Quantification of Keap1 intensity in PINK1 mutant compared to neighboring control cells. n = 8 (Ctrl), n = 8 (PINK1B9) cells were measured. (H and H’) Intestines from animals that contain Keap1–3×Flag-V5 exhibit similar Keap1 intensity (green, detected by anti-V5 antibody) and some co-localization with ATP5A puncta (magenta) in ParkΔ mutant enterocytes (white dotted line, non-red in nuclei) compared to control cells. (I) Quantification of Keap1 intensity in Parkin mutant compared to control cells. n = 23 (Ctrl), n = 23 (ParkΔ) cells were analyzed. (J) Keap1 levels in male homozygous PINK1B9, Park25 mutant and control intestines analyzed by western blot. Keap1 was detected by anti-V5 antibody. (K) Quantification of Keap1 in PINK1 and Parkin mutant intestines normalized to control intestines. n = 3 independent experiments. (L) Rtnl1 was immunoprecipitated from either control or PINK1B9 mutant intestines. Whole lysates (Input) and immunoprecipitated proteins (IP) were immunoblotted with anti-ubiquitin (P4D1), anti-V5, and anti-Actin antibodies. (M) Quantification the ratio of ubiquitin (IP)/total Rtnl1-V5 (IP) in PINK1B9 mutant intestines normalized to control intestines. n = 3 independent experiments. (N) Rtnl1 was immunoprecipitated from either control or Park25 mutant intestines. Whole lysates (Input) and immunoprecipitated proteins (IP) were immunoblotted with anti-ubiquitin (P4D1), anti-V5, and anti-Actin antibodies. (O) Quantification of the ratio of ubiquitin (IP)/total Rtnl1-V5 (IP) in Park25 mutant normalized to control intestines. n = 3 (Ctrl), n = 3 (Park25) independent experiments. (P) Rtnl1 was immunoprecipitated from either control or Keap1 RNAi intestines. Whole lysates (Input) and immunoprecipitated proteins (IP) were immunoblotted with anti-ubiquitin (P4D1), anti-V5, and anti-Actin antibodies. (Q) Quantification of the ratio of ubiquitin (IP)/total Rtnl1-V5 (IP) in Keap1 knockdown intestines normalized to control intestines. n = 3 (Ctrl), n = 3 (Keap1IR) independent experiments. All animals were staged 2 hours APF. Scale bars in (A-D), (F’) and (H’) represent 20 μm. Scale bars in (A-D), (F) and (H) insets represent 5 μm. Insets are from indicated rectangles (white rectangle in (F) and (H) = mutant cell, yellow rectangle in (F) and (H) = control cell). Data are presented as mean ± SEM. n.s. = not significant, **, p<0.01, ***, p<0.001, ****, p<0.0001, from One-Way ANOVA corrected by Tukey post-hoc test, Kruskal-Wallis H test and unpaired, two-tailed t-test. Representative of 3 or more independent biological experiments. See also Figure S7.

References

    1. Hubner CA, and Dikic I (2020). ER-phagy and human diseases. Cell Death Differ 27, 833–842. 10.1038/s41418-019-0444-0. - DOI - PMC - PubMed
    1. Pickles S, Vigie P, and Youle RJ (2018). Mitophagy and Quality Control Mechanisms in Mitochondrial Maintenance. Curr Biol 28, R170–R185. 10.1016/j.cub.2018.01.004. - DOI - PMC - PubMed
    1. Jin SM, Lazarou M, Wang C, Kane LA, Narendra DP, and Youle RJ (2010). Mitochondrial membrane potential regulates PINK1 import and proteolytic destabilization by PARL. J Cell Biol 191, 933–942. 10.1083/jcb.201008084. - DOI - PMC - PubMed
    1. Kim Y, Park J, Kim S, Song S, Kwon SK, Lee SH, Kitada T, Kim JM, and Chung J (2008). PINK1 controls mitochondrial localization of Parkin through direct phosphorylation. Biochem Biophys Res Commun 377, 975–980. 10.1016/j.bbrc.2008.10.104. - DOI - PubMed
    1. Shiba-Fukushima K, Imai Y, Yoshida S, Ishihama Y, Kanao T, Sato S, and Hattori N (2012). PINK1-mediated phosphorylation of the Parkin ubiquitin-like domain primes mitochondrial translocation of Parkin and regulates mitophagy. Sci Rep 2, 1002. 10.1038/srep01002. - DOI - PMC - PubMed

Publication types

LinkOut - more resources