. 2023 Oct;30(10):2280-2292.
doi: 10.1038/s41418-023-01216-y. Epub 2023 Aug 26.

The cGAS-STING-YY1 axis accelerates progression of neurodegeneration in a mouse model of Parkinson's disease via LCN2-dependent astrocyte senescence

Affiliations

The cGAS-STING-YY1 axis accelerates progression of neurodegeneration in a mouse model of Parkinson's disease via LCN2-dependent astrocyte senescence

Si-Yuan Jiang et al. Cell Death Differ. 2023 Oct.

Abstract

Recent studies provide clues that astrocyte senescence is correlated with Parkinson's disease (PD) progression, while little is known about the molecular basis for astrocyte senescence in PD. Here, we found that cyclic GMP-AMP synthase (cGAS)/stimulator of interferon genes (STING) was upregulated in senescent astrocytes of PD and aged mice. Strikingly, deletion of astrocytic cGAS significantly prevented senescence of astrocytes and neurodegeneration. Furthermore, we identified LCN2 as the effector of cGAS-STING signal by RNA-Seq analysis. Genetic manipulation of LCN2 expression proved the regulation of cGAS-STING-LCN2 axis in astrocyte senescence. Additionally, YY1 was discovered as the transcription factor of LCN2 by chromatin immunoprecipitation. Binding of STING to YY1 impedes nuclear translocation of YY1. Herein, we determine the involvement of the cGAS-STING-YY1-LCN2 signaling cascade in the control of astrocyte senescence and PD progression. Together, this work fills the gap in our understanding of astrocyte senescence, and provides potential targets for delaying PD progression.


Conflict of interest statement

The authors declare no competing interests.

Figures
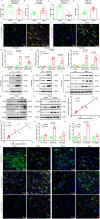
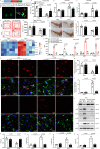
Fig. 1
Fig. 1. cGAS-STING signal is activated in senescent astrocytes of MPTP treated mice and aged mice.
Time was recorded in the rotarod test and pole test in aged mice (A, B), n = 13 animals for each group) and MPTP treated mice (C, D, n = 12 animals for each group). Representative double-immunostaining for p16Ink4a (red) and astrocytic marker GFAP (green) in the SNpc of aged mice (E) and MPTP treated mice (F). qPCR measurement of mitochondrial DNA (mtDNA-ND1 and mtDNA-ND2) and nuclear DNA (nDNA) in astrocytes cultured for 40 days (G, six independent experiments), treated with α-Syn PFF (H, six independent experiments), or treated MPP+ (I, six independent experiments). Representative immunoblots of relative expression of cGAS and p-STING in astrocytes cultured for 40 days (J), treated with α-Syn PFF (K), or treated MPP+ (L). Representative immunoblots of relative expression of cGAS and p-STING in the SNpc of aged mice (M) and MPTP treated mice (N). O, P The cGAS-STING protein is positively correlated with p16 protein in the SNpc in aged mice. Quantification of the cGAS level in GFAP/TH/IBA positive cells in MPTP treated mice (Q, n = 4-6 animals for each group) and in aged mice (R, n = 4-5 animals for each group). Representative double-immunostaining for cGAS (red) and astrocytic marker GFAP (green), DA neuron marker TH (green) or microglia marker IBA (green) in the SNpc of MPTP treated mice (S) and aged mice (T). DAPI stains nucleus (blue). The data shown are the mean ± SEM. Unpaired t test was used (AD, GI, Q, R) and correlation was analyzed by Pearson’s correlation coefficient (O, P).
Fig. 2
Fig. 2. cGAS-STING knockdown prevents senescence of astrocytes in vitro.
A Heatmap of relative indicated mRNA levels of SASP in astrocytes transfected with cGAS siRNA and then treated with MPP+. B The levels of IL-6, IL-1α, IL-1β, MMP3, and MMP9 in astrocytes measured by ELISA (Six independent experiments). C Astrocytes were analyzed by flow cytometry to evaluate cell cycle distribution (Three independent experiments). D, E Immunofluorescence and quantification of lamin B1 in GFAP+ astrocytes (Four independent experiments). DAPI stains nucleus (blue). F Representative immunoblots of relative expression of p-STING, p16 and p21 in astrocytes. G Quantification of the percentage of SA-β-gal+ astrocytes over total astrocytes (Six independent experiments). H Representative immunoblots of relative expression of p16 in astrocytes transfected with STING siRNA and then treated with MPP+ (Four independent experiments). I, J Immunofluorescence and quantification of lamin B1 in GFAP+ astrocytes (Four independent experiments). K Representative immunoblots of relative expression of cGAS, p-STING and p16 in astrocytes transfected with cGAS siRNA and then treated with α-Syn PFF (Three independent experiments). L Representative immunoblots of relative expression of p16 in astrocytes transfected with STING siRNA and then treated with α-Syn PFF (Three independent experiments). M Representative immunoblots of relative expression of cGAS, p-STING and p16 in astrocytes transfected with cGAS siRNA and cultured for 7 days or 40 days in vitro (Four independent experiments). N The levels of IL-6, IL-1α, IL-1β, MMP3, and MMP9 in astrocytes measured by ELISA (Six independent experiments). O Astrocytes were analyzed by flow cytometry to evaluate cell cycle distribution (Three independent experiments). P Quantification of the percentage of SA-β-gal+ astrocytes over total astrocytes (Six independent experiments). Q Representative immunoblots of relative expression of p16 in astrocytes transfected with STING siRNA and cultured for 7 days or 40 days in vitro (Three independent experiments). The data shown are the mean ± SEM. Two-way ANOVA with Tukey’s post-hoc tests were used.
Fig. 3
Fig. 3. Astrocytic cGAS ablation alleviates PD like pathology via delay of the senescence of astrocytes in MPTP treated mice.
A Diagram of the experimental design. B IHC results confirm that AAV-cGAS shRNA (EGFP) is expressed, mainly in GFAP+ astrocytes (red). C Time on the rod was measured by the rotarod test (n = 9 animals for each group). D, E the time taken to turn around (Time-turn) and descend a pole (Time-total) was recorded in pole test (n = 9 animals for each group). F, G Movement distance within 5 min was recorded by open field test (n = 9 animals for each group). H Microphotographs of TH-positive neurons in the SNpc. I Stereological counts of TH-positive neurons in the SNpc (n = 6 animals for each group). J Heatmap of relative mRNA levels of SASP as indicated. K The levels of IL-6, IL-1α, IL-1β, MMP3, and MMP9 in astrocytes measured by ELISA (n = 6 animals for each group). L Representative double-immunostaining for lamin B1 or p16 (red) and EGFP (green) in astrocytes in the SNpc. Quantification of lamin B1 immunofluorescence intensity (M) and p16 immunofluorescence intensity (N) in GFAP+ astrocytes in the SNpc (n = 6–8 animals for each group). DAPI stains nucleus (blue). Representative immunoblots (O) and quantification of relative expression of TH (P), p-STING (Q), p-p65 (R) and p16 (S) in the SNpc (n = 4 animals for each group). The data shown are the mean ± SEM. Two-way ANOVA with Tukey’s post-hoc tests were used.
Fig. 4
Fig. 4. Identification of LCN2 as an effector target for cGAS-STING-mediated astrocyte senescence.
A Volcano plot of downregulated (down) or upregulated (up) genes in the SNpc of AAV-cGAS shRNA PD mice compared to AAV-control PD mice by RNA-seq analysis (n = 3 animals for each group). B Heatmap of top 17 up- or downregulated genes indicated between the SNpc of AAV-control and AAV-cGAS shRNA PD mice. qPCR analysis measuring the mRNA levels of indicated genes in the SNpc (C, n = 3 animals for each group) and in astrocytes (D, four independent experiments). Representative immunoblots of relative protein level of LCN2 in the SNpc (E) and in astrocytes treated with MPP+ (F) and cultured for 7 days or 40 days in vitro (G). H Representative immunoblots of relative expression of p16 in astrocytes transfected with LCN2 siRNA (si-LCN2) and then treated with MPP+ (Three independent experiments). I Quantification of the percentage of SA-β-gal+ astrocytes over total astrocytes (Four independent experiments). J, K Immunofluorescence and quantification of lamin B1 in GFAP+ astrocytes (Four independent experiments). DAPI stains nucleus (blue). L Representative immunoblots of p16 expression in astrocytes transfected with LCN2 siRNA and cultured for 7 days or 40 days in vitro (Three independent experiments). M Quantification of the percentage of SA-β-gal+ astrocytes over total astrocytes (Four independent experiments). The astrocytes were co-transfected with LCN2 plasmid and cGAS siRNA (STING siRNA) for 48 h. N, O Immunofluorescence and quantification of lamin B1 in GFAP+ astrocytes (Four independent experiments). DAPI stains nucleus (blue). P, Q Representative images of SA-β-gal staining and quantification of the percentage of SA-β-gal+ astrocytes over total astrocytes in astrocytes treated with MPP+ and in astrocytes cultured for 7 days or 40 days in vitro (Four independent experiments). Representative immunoblots of p16 expression in astrocytes treated with MPP+ (R) and in astrocytes cultured for 7 days or 40 days in vitro (S). The data shown are the mean ± SEM. Two-way ANOVA with Tukey’s post-hoc tests were used.
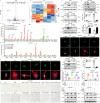
Fig. 5
Fig. 5. STING directly binds to YY1 and prevents YY1 nuclear translocation to increase LCN2 transcription.
A p-STING-bound protein YY1 in astrocytes is identified by LC-MS/MS. B The Venn diagram presents the overlap of the predicted transcription factors of LCN2 between the PROMO, UCSC, and Animal TFDB datasets. C Binding of YY1 to LCN2 promoter was analyzed using ChIP-qPCR in HEK293 cells (Five independent experiments). IgG, immunoglobulin G. D Luciferase reporter activity of LCN2 in HEK293 cells transfected with YY1-expressing plasmid or vector (Five independent experiments). E Representative immunoblots of LCN2 expression and YY1 in astrocytes transfected with YY1 siRNA (si-YY1) or control siRNA (si-control) (Four independent experiments). F Immunoprecipitation and immunoblot analysis of the interaction of p-STING with YY1 in astrocytes treated with MPP+ using anti-p-STING and anti-YY1 antibodies (Three independent experiments). G Immunoprecipitation and immunoblot analysis of the interaction of p-STING with YY1 in astrocytes cultured for 7 days or 40 days (Three independent experiments). H Representative images showing the localization of p-STING (red) and YY1 (green) in astrocytes. I Representative Immunoblot of YY1 expression in the nucleus and the cytoplasm from astrocytes treated with MPP+. J Representative Immunoblot of YY1 expression in the nucleus and the cytoplasm from astrocytes cultured for 7 days or 40 days. K Representative images of immunofluorescence staining on YY1 (green) and DAPI (blue) in astrocytes transfected with cGAS/STING siRNA and then treated with MPP+. The data shown are the mean ± SEM. Unpaired t test was used (C, D).
Fig. 6
Fig. 6. LCN2 is required for cGAS-STING-mediated astrocyte senescence and neurodegeneration in MPTP treated mice.
A Representative pictures of MAP2 (green) immunostaining. DAPI stains nucleus (blue). Quantification of relative the number of neurons (B, four independent experiments) and mean total neuritis length (C, four independent experiments). D The time taken to descend a pole (Time-total) was recorded in pole test (n = 14 animals for each group). E Time on the rod was measured in the rotarod test (n = 10 animals for each group). F, G Movement distance within 5 min was recorded in open field test (n = 13 animals for each group). H Microphotographs of TH-positive neurons in the SNpc. I Stereological counts of TH-positive neurons in the SNpc (n = 6 animals for each group). Representative immunoblots (J) and quantification of TH (K) and p16 expression (L) in the SNpc (n = 5 animals for each group). qPCR measurement of IL-1α (M), IL-1β (N), IL-6 (O), and MMP9 (P) mRNA expression in the SNpc (n = 6 animals for each group). Q Representative double-immunostaining for lamin B1 (red) and EGFP (green) in astrocytes in the SNpc. R Quantification of lamin B1 immunofluorescence intensity in GFAP+ astrocytes in the SNpc (n = 6 animals for each group). DAPI stains nucleus (blue).The data shown are the mean ± SEM. Two-way ANOVA with Tukey’s post-hoc tests were used.
Fig. 7
Fig. 7. cGAS-STING-LCN2 pathway mediates age-related neurodegeneration in aged mice.
A The time taken to descend a pole (Time-total) was recorded in pole test (n = 14 animals for each group). B Time on the rod was measured in the rotarod test (n = 10 animals for each group). C, D Movement distance within 5 min was recorded in open field test (n = 10 animals for each group). E Microphotographs of TH-positive neurons in the SNpc. F Stereological counts of TH-positive neurons in the SNpc (n = 6 animals for each group). G Microphotographs of TH staining of striatum (n = 6 animals for each group). Representative immunoblots (H) and quantification of relative expression of TH (I) and p16 (J) in the SNpc (n = 4 animals for each group). qPCR measurement of IL-6 (K), IL-1α (L), and MMP9 (M) mRNA expression in the SNpc (n = 6-8 animals for each group). N, O Representative double-immunostaining and quantification of lamin B1 immunofluorescence intensity in GFAP+ astrocytes in the SNpc (n = 6 animals for each group). DAPI stains nucleus (blue). Quantification of relative expression of p-sting (P) and LCN2 (Q) in the SNpc (n = 4 animals for each group). R Proposed model depicting the crucial role of cGAS-STING-YY1-LCN2 in mediating astrocyte senescence, consequently, contributing to neurodegeneration in brain aging and PD. The data shown are the mean ± SEM. One-way ANOVA with Tukey’s post-hoc tests were used.

References

    1. Simon DK, Tanner CM, Brundin P. Parkinson disease epidemiology, pathology, genetics, and pathophysiology. Clin Geriatr Med. 2020;36:1–12. doi: 10.1016/j.cger.2019.08.002. - DOI - PMC - PubMed
    1. Gomez Arevalo G, Jorge R, Garcia S, Scipioni O, Gershanik O. Clinical and pharmacological differences in early- versus late-onset Parkinson’s disease. Mov Disord. 1997;12:277–84. doi: 10.1002/mds.870120303. - DOI - PubMed
    1. Diederich NJ, Moore CG, Leurgans SE, Chmura TA, Goetz CG. Parkinson disease with old-age onset: a comparative study with subjects with middle-age onset. Arch Neurol. 2003;60:529–33. doi: 10.1001/archneur.60.4.529. - DOI - PubMed
    1. Hur EM, Lee BD. LRRK2 at the crossroad of aging and Parkinson’s disease. Genes. 2021;12:505. doi: 10.3390/genes12040505. - DOI - PMC - PubMed
    1. Kritsilis M, V Rizou S, Koutsoudaki PN, Evangelou K, Gorgoulis VG, Papadopoulos D. Ageing, cellular senescence and neurodegenerative disease. Int J Mol Sci. 2018;19:2937. doi: 10.3390/ijms19102937. - DOI - PMC - PubMed

Publication types

MeSH terms