. 2023 Oct;30(10):2201-2212.
doi: 10.1038/s41418-023-01209-x. Epub 2023 Aug 26.

Netrin-1 blockade inhibits tumor associated Myeloid-derived suppressor cells, cancer stemness and alleviates resistance to chemotherapy and immune checkpoint inhibitor

Affiliations

Netrin-1 blockade inhibits tumor associated Myeloid-derived suppressor cells, cancer stemness and alleviates resistance to chemotherapy and immune checkpoint inhibitor

Benjamin Ducarouge et al. Cell Death Differ. 2023 Oct.

Abstract

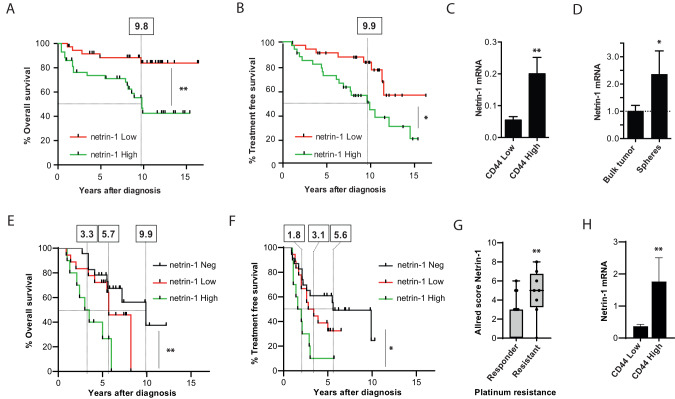
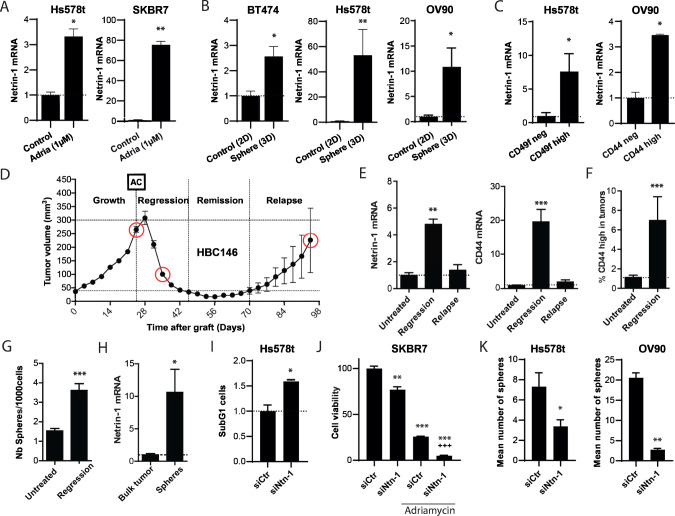
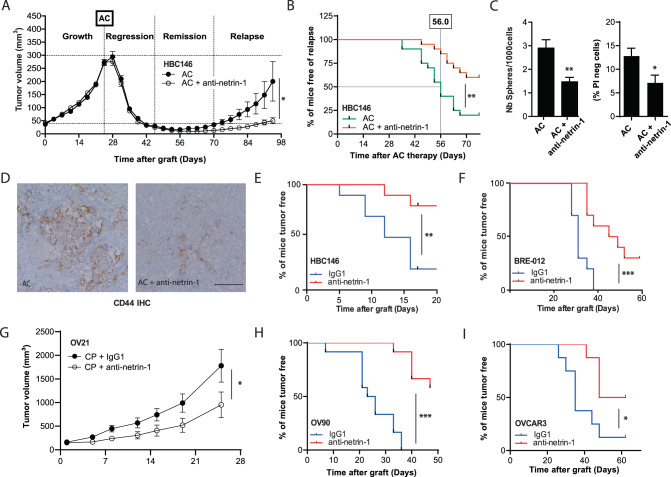
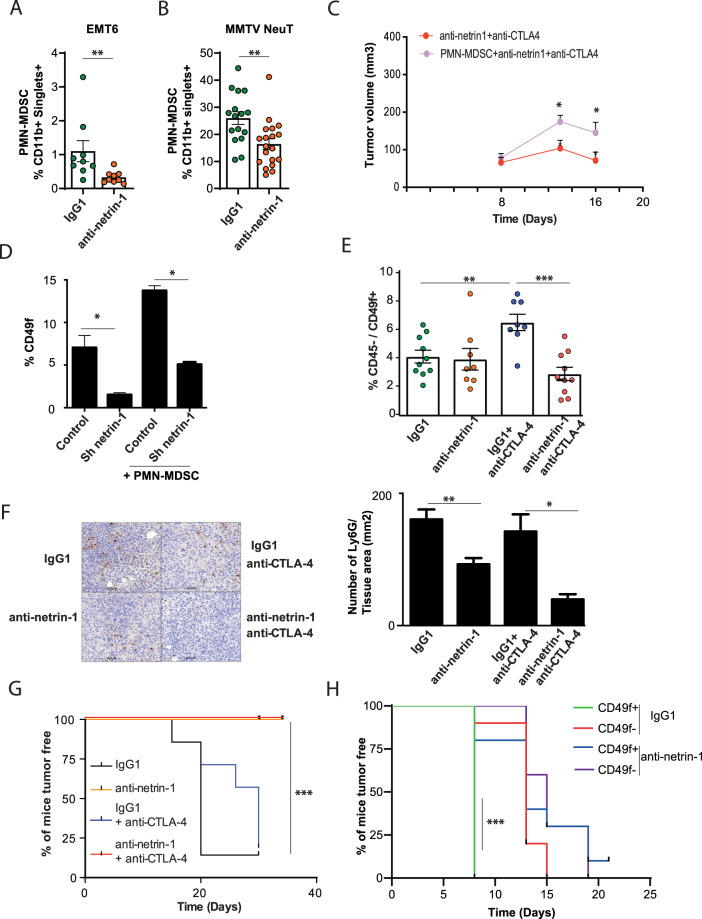
Drug resistance and cancer relapse represent significant therapeutic challenges after chemotherapy or immunotherapy, and a major limiting factor for long-term cancer survival. Netrin-1 was initially identified as a neuronal navigation cue but has more recently emerged as an interesting target for cancer therapy, which is currently clinically investigated. We show here that netrin-1 is an independent prognostic marker for clinical progression of breast and ovary cancers. Cancer stem cells (CSCs)/Tumor initiating cells (TICs) are hypothesized to be involved in clinical progression, tumor relapse and resistance. We found a significant correlation between netrin-1 expression and cancer stem cell (CSC) markers levels. We also show in different mice models of resistance to chemotherapies that netrin-1 interference using a therapeutic netrin-1 blocking antibody alleviates resistance to chemotherapy and triggers an efficient delay in tumor relapse and this effect is associated with CSCs loss. We also demonstrate that netrin-1 interference limits tumor resistance to immune checkpoint inhibitor and provide evidence linking this enhanced anti-tumor efficacy to a decreased recruitment of a subtype of myeloid-derived suppressor cells (MDSCs) called polymorphonuclear (PMN)-MDSCs. We have functionally demonstrated that these immune cells promote CSCs features and, consequently, resistance to anti-cancer treatments. Together, these data support the view of both a direct and indirect contribution of netrin-1 to cancer stemness and we propose that this may lead to therapeutic opportunities by combining conventional chemotherapies and immunotherapies with netrin-1 interfering drugs.


Conflict of interest statement

BD, CV, JL, DN, DG, SD, AB and PM declare to have a conflict of interest as respectively employees (BD, DN, DG, CV, JL and SD) and shareholders (AB and PM) of NETRIS Pharma.

Figures

Fig. 1
Fig. 1. Netrin-1 expression is a poor prognosis marker and correlates with stem cells marker in human breast and ovary cancers.
A, B Kaplan-Meier curves representing the percentage of overall survival of breast cancer patients (A, n = 89) or treatment-free survival among patients with localized disease (B, n = 67). The cohort has been split in netrin-1 High (green) and Low (red) by the median expression in their tumors. C Netrin-1 mRNA expression level within tumors segmented in High and Low by the median expression of CD44 mRNA (n = 89). Bars are mean values +/− s.e.m. D Netrin-1 mRNA expression level measured in fresh human tumors obtained at the diagnosis by q-RT-PCR. Each tumor was split to analyze the bulk or their corresponding derived mammospheres (Spheres, n = 12) after dissociation. Bars are mean values +/− s.e.m. normalized with the tumor bulk group. E, F Kaplan-Meier curves representing the percentage of overall survival (E) or treatment free survival (F) of high-grade ovarian carcinoma patients (n = 51) with netrin-1 High (green), Low (red) Negative (black) expression in their tumors (Netrin-1 was measured by immunohistochemistry (IHC)). Median netrin-1 expression was used as a cutoff between groups. G Boxplot presenting Allred score combining the percentage of positive cells and signal intensity of netrin-1 measured by IHC in responder patients (n = 17) vs patients resistant to platinum treatment (n = 8). H Netrin-1 mRNA expression level in tumors segmented on the CD44 mRNA expression from a cohort of High grade serous ovarian carcinomas (n = 31). High and Low have been determined respectively by the upper and lower values separated by the median of mRNA expression measured by q-RT-PCR. Bars are mean values +/− s.e.m. In all panels statistics are presented as *p < 0.05; **p < 0.01.
Fig. 2
Fig. 2. Netrin-1 expression is associated with CSCs features in human cell lines and in a PDX model of breast cancer resistance to chemotherapy.
A Netrin-1 mRNA expression level was measured by q-RT-PCR in HS578t (n = 3) or SKBR7 (n = 3) cell lines treated 48 h with 1 µM Adriamycin (Adria). Bars are mean values +/− s.e.m., normalized with the control group. B Netrin-1 mRNA expression level was measured by q-RT-PCR in BT474 (n = 4 vs 5), Hs578t (n = 5) or OV90 (n = 6 vs 3) cell lines comparing standard 2D culture and mammosphere (Sphere) 3D. Bars are mean values +/− s.e.m., normalized with the control 2D group. C Netrin-1 mRNA expression level was measured by q-RT-PCR in CD49flow and CD49fhigh Hs578t (n = 4) sorted breast cell population and in CD44low and CD44high OV90 ovary cell line (n = 6 vs 3). Bars are mean values +/− s.e.m., normalized with the control Low group. D Tumor volume was measured along the different phases of the HBC146 PDX breast cancer model [33] treated with chemotherapy Adriamycin-Cyclophosphamide (AC): Growth, Regression, Remission and Relapse (n = 20). Samples were collected at the different phases (red circles). E Netrin-1 and CD44 mRNA expression levels were measured by q-RT-PCR in the different phases (untreated n = 8, regression n = 8 and relapse n = 10). Bars are mean values +/− s.e.m., normalized with the untreated group. F Percentage of CD44high cells counted by FACS analysis in untreated tumors compared to regressing tumors (n = 9 vs 3). G Number of mammospheres formed by 1000 viable cells isolated from untreated HBC146 tumors or at the regression phase (n = 5 vs 9). Bars are mean values +/− s.e.m. H Netrin-1 mRNA expression level measured by q-RT-PCR in untreated bulk tumors and mammospheres (n = 7). Bars are mean values +/− SEM, normalized to the bulk tumor group. I SubG1 cell present in Hs578t cell line treated with siRNA control (siCtr) or siRNA against Netrin-1(siNtn-1) (n = 3). J Cell viability measured by WST1 assay in SKBR7 (n = 3) cell lines treated with siCtr and siNetrin-1 alone or in combination with Adriamycin. Bars are mean values +/− SEM, normalized to the siCtr group (* are statistics against siCtr and + against siCtr + Adriamycin). K Number of mammospheres formed by 1000 viable cells of Hs578t (n = 5) and OV90 (n = 3) cell lines treated with siCtr and siNetrin-1. Bars are mean values +/− SEM. In all panels statistics are presented as *p < 0.05; **p < 0.01; +++ or ***p < 0.001.
Fig. 3
Fig. 3. Netrin-1 blockade delays cancer relapse and impact CSCs features.
A Tumor volume was measured along the different phases of the HBC146 PDX model: Growth, Regression after chemotherapy (Adriamycin-Cyclophosphamide: AC), Remission and Relapse. At day 21, the mice were randomized into two groups which were intraperitoneally treated either by vehicle (n = 20) or with 10 mg/kg of anti-netrin1 antibody weekly (n = 20). p = 0.0002 by ANOVA on the tumor volume at the regression. B Kaplan-Meier curves representing the percent of mice free of relapse in vehicle (green) and anti-netrin-1 mAb (red) treated groups. The relapse volume threshold has been determined at 40 mm3. Median of relapse are respectively 56.0 and 80.5 days after chemotherapy for the vehicle and anti-netrin-1 groups, p = 0.0078 by Gehan-Breslow-Wilcoxon test. C Number of mammospheres formed by 1000 viable cells (left) or viable PI negative cells (right) isolated from HBC146 tumors treated with chemotherapy alone or associated with anti-netrin-1 mAb. Samples were collected in regressing tumors, below the volume threshold of 40 mm3 (n = 5 vs 9). Bars are mean values +/− s.e.m. D Representative CD44 immunohistochemistry analysis of HBC146 tumors treated with chemotherapy alone or associated with the anti-netrin-1 mAb. Samples were collected in regressing tumors. Scale bar (represented by a line): 50 µm. E, F Serial transplantation experiments of HBC146 (n = 10 per group) and BRE-012 (n = 10 per group) breast PDX. First, tumors were treated with the anti-netrin-1 mAb or with a control IgG1 and then regrafted in other mice. Secondary recipient were not treated after the re-engraftment, the percentage of mice free of tumor is presented in both groups. G Tumor volume was measured in mice bearing the OV21 ovarian PDX model and treated with Carboplatin/Paclitaxel (CP) chemotherapy and randomly separated in two groups intraperitoneally treated either with control IgG1 (n = 8) or with 10 mg/kg of anti-netrin1 antibody (n = 8). (p = 0.0101; ANOVA test). H, I Serial transplantation experiments of ovarian cancer cell lines OV90 (n = 12) or OVCAR3 (n = 8). First, grafted tumors were treated with the anti-netrin-1 mAb or with a IgG1 control and after dissociation, 1 × 106 living cells were regrafted in new recipient mice. Results are presented as the percentage of mice free of tumor take. In all panels statistics are presented as *p < 0.05; **p < 0.01; ***p < 0.001.
Fig. 4
Fig. 4. Netrin-1 blockade alleviates resistance to immune checkpoint inhibitor anti-CTLA-4.
A Tumor growth quantification of syngeneic EMT6 mammary carcinoma, in mice treated with control IgG1 or anti-netrin-1 mAb, in combination with anti-CTLA-4 mAb. B Kaplan-Meier survival analysis of the mice of (A) after 80 days. C Spider graph presenting flow cytometry analysis of the immune infiltrate. All components of the lymphoid panel were detected and quantified after EMT6 tumor dissociation and isolation of cell population using Lymphocytes specific antibodies. D Analysis of CD8+ lymphocytes by flow cytometry infiltrating tumors treated with either anti-CTLA-4 mAb combined or not with anti-netrin-1 mAb and compared to a IgG1 control (n = 17 per group). Results are the mean of 2 different experiments presented in (C) and are presented as a ratio on total CD45+ cells singlets for each tumor. E Analysis of tumor associated macrophages defined as CD11b+ LY6C- F4/80+ cells (n = 16 per group). Results where the mean of 2 different experiments and are presented as a ratio on total CD45+ cells singlets for each tumor. In all panels statistic are presented as *p < 0.05; **p < 0.01.
Fig. 5
Fig. 5. Netrin-1 blockade efficiently impacts CSCs/TICs untargeted by anti-CTLA-4 mAb.
A, B Flow cytometry analysis of PMN-MDSC obtained after dissociation of EMT6 (n = 9 per group) or MMTV/NeuT (n = 16 vs 19) tumors treated with either control isotype IgG1 or anti-netrin-1 mAb. PMN-MDSC are defined as CD11b+ Singlets+ cells among the CD45+ (CD11b+ Ly6G+ Ly6Cinterm) population. C EMT-6 tumor implanted in syngeneic BALBc/J mice were treated with anti-netrin-1 and anti-CTLA4 and injected/not with PMN-MDSC cells. D Flow cytometry analysis of CD49f+ EMT6 cells in control parental cells, or netrin-1 silenced by shRNA (Sh netrin-1) cocultured, or not, with PMN-MDSC (n = 3). E Flow cytometry analysis of EMT6 cancer cells obtained after dissociation of tumors treated with either three treatments of control IgG1, anti-netrin-1 mAb alone or in combination with anti-CTLA-4 (respectively n = 10, 8, 8 and 10). CSC markers are defined as CD49f+ cells among the CD45neg (CD45) population. F Immunohistochemistry analysis and quantification of Ly6G+ cells in EMT6 obtained after fixation of tumors treated with either three treatments of control IgG1, anti-netrin-1 mAb with or without anti-CTLA-4. n = 8 field/tumor. G Serial transplantation experiments with EMT6 cells in syngeneic BALBc/J mice. 5.104 living cells, obtained after the dissociation of tumors from mice treated with either control IgG1 vs. anti-netrin-1 mAb alone; or in combination with anti-CTLA4 (respectively n = 7, 8, 8 and 8) were grafted into recipient mice. Results are presented as percentage of mice free of tumor. H Serial transplantation of EMT6 cells were used as an indicator of tumor initiating potential of CD49f+/− populations. Tumors were dissociated from EMT6 tumors of mice treated with control IgG1 or anti-netrin-1 mAb. After dissociation, cells were sorted based on CD49f expression and 5.104 living cells of each positive or negative populations were regrafted in new recipient animals (n = 10 per group). Results are presented as the percentage of mice free of tumor. In all panels statistics are presented as *p < 0.05; **p < 0.01; ***p < 0.001.

References

    1. Serafini T, Colamarino SA, Leonardo ED, Wang H, Beddington R, Skarnes WC, et al. Netrin-1 is required for commissural axon guidance in the developing vertebrate nervous system. Cell. 1996;87:1001–14. doi: 10.1016/S0092-8674(00)81795-X. - DOI - PubMed
    1. Chédotal A. Roles of axon guidance molecules in neuronal wiring in the developing spinal cord. Nat Rev Neurosci. 2019;20:380–96. doi: 10.1038/s41583-019-0168-7. - DOI - PubMed
    1. Mehlen P, Delloye-Bourgeois C, Chédotal A. Novel roles for slits and netrins: axon guidance cues as anticancer targets? Nat Rev Cancer. 2011;11:188–97. doi: 10.1038/nrc3005. - DOI - PubMed
    1. Mehlen P, Bredesen DE. Dependence receptors: from basic research to drug development. Sci Signal. 2011;4:mr2. doi: 10.1126/scisignal.2001521. - DOI - PubMed
    1. Bongo JB, Peng DQ. The neuroimmune guidance cue netrin-1: a new therapeutic target in cardiovascular disease. J Cardiol. 2014;63:95–8. doi: 10.1016/j.jjcc.2013.10.006. - DOI - PubMed

Publication types

MeSH terms

LinkOut - more resources