. 2023 Aug 26;14(1):5220.
doi: 10.1038/s41467-023-40859-w.

Assembly landscape for the bacterial large ribosomal subunit

Affiliations

Assembly landscape for the bacterial large ribosomal subunit

Kai Sheng et al. Nat Commun. .

Abstract

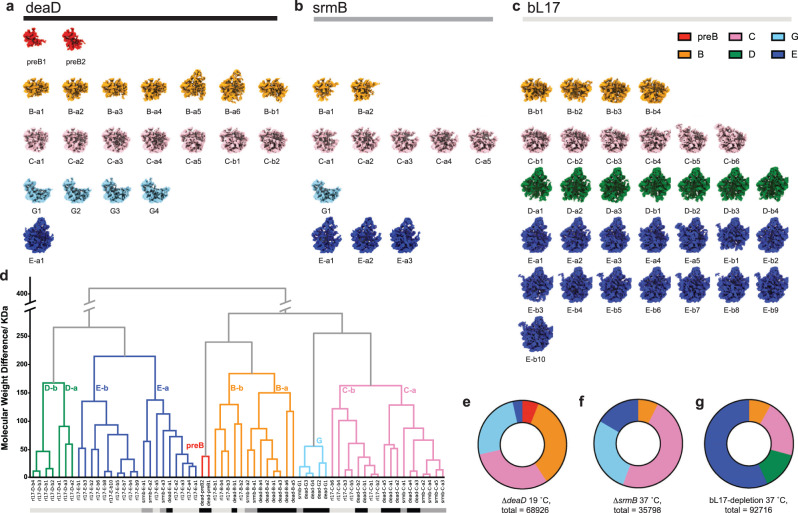
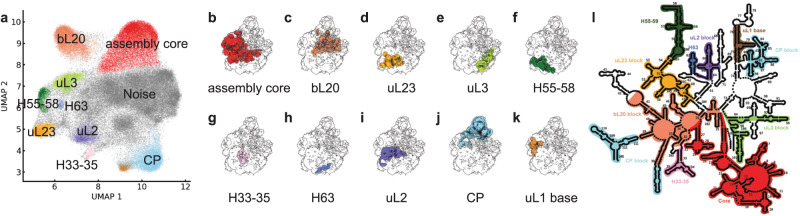
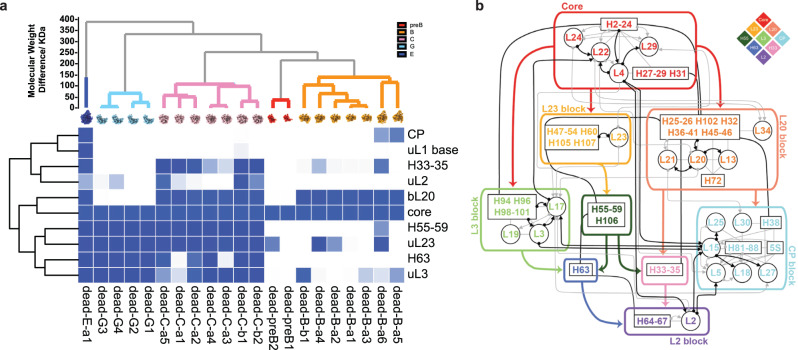
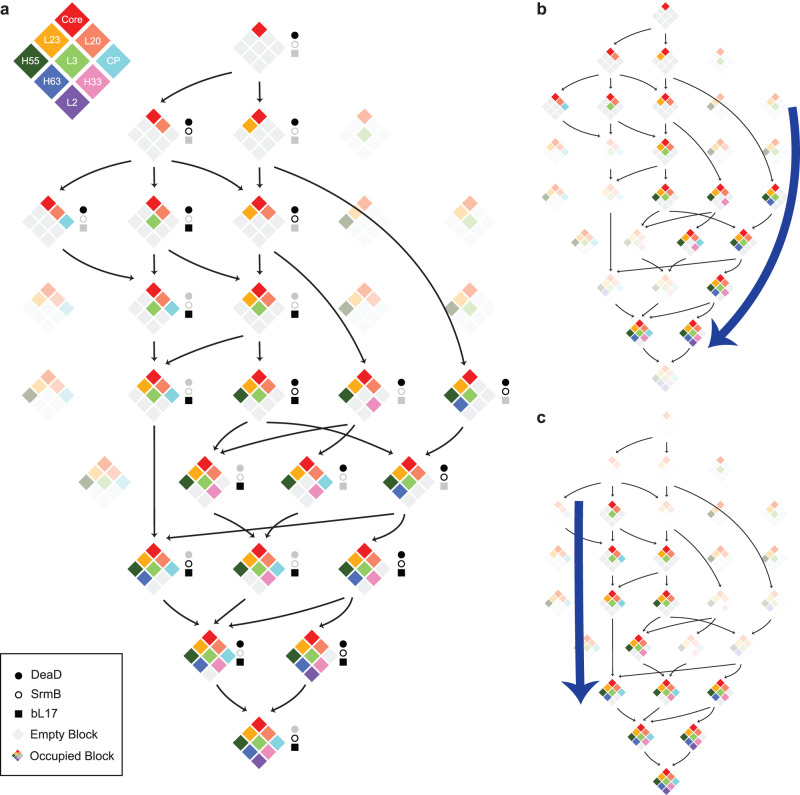
Assembly of ribosomes in bacteria is highly efficient, taking ~2-3 min, but this makes the abundance of assembly intermediates very low, which is a challenge for mechanistic understanding. Genetic perturbations of the assembly process create bottlenecks where intermediates accumulate, facilitating structural characterization. We use cryo-electron microscopy, with iterative subclassification to identify intermediates in the assembly of the 50S ribosomal subunit from E. coli. The analysis of the ensemble of intermediates that spans the entire biogenesis pathway for the 50 S subunit was facilitated by a dimensionality reduction and cluster picking approach using PCA-UMAP-HDBSCAN. The identity of the cooperative folding units in the RNA with associated proteins is revealed, and the hierarchy of these units reveals a complete assembly map for all RNA and protein components. The assembly generally proceeds co-transcriptionally, with some flexibility in the landscape to ensure efficiency for this central cellular process under a variety of growth conditions.


Conflict of interest statement

The authors declare no competing interests.

Figures

Fig. 1
Fig. 1. Assembly intermediate density maps from three datasets.
Density maps reconstructed from adeaD, bsrmB, and c bL17-depletion datasets, colored according to classes obtained from hierarchical analysis in (d). The Euclidean distance matrix, based on the molecular weight in kDa, was calculated among density maps, and the dendrogram resulting from hierarchical clustering is displayed, with the six main class branches colored accordingly. The bottom color bars are corresponding to (ac), black = ∆deaD, dark gray = ∆srmB, and light gray = bL17-depletion. eg Particle distribution among the main classes for the three datasets.
Fig. 2
Fig. 2. Assembly blocks derived from segmentation using PCA-UMAP-HDBSCAN.
a Voxels above a 99-percentile threshold are well organized in UMAP space, with 10 contiguous volume blocks extracted by clustering with HDBSCAN colored (see Methods/SI). bk Projections of the clusters into 3D space overlaid on the 50S subunit 99-percentile threshold mask (black outline), colored according to (a). l The 23S rRNA helices are colored according to the assembly blocks.
Fig. 3
Fig. 3. Occupancy matrix of assembly blocks with the resulting block dependency map.
a Occupancy of 21 intermediate density maps from ∆deaD in terms of the 10 assembly blocks used for dependency analysis. b Block dependencies were determined using a quadrant analysis of the occupancy matrix in (a) (see SI). The blue color intensity ranges from white (no occupancy) to blue (full occupancy). All of the 23S and 5S rRNA helices are outlined in black boxes, with connections between elements in primary structure in solid black lines. Black/gray arrows show dependencies from the Nierhaus map as strong/weak interactions. The major block dependencies inferred from (a) are shown as bold-colored arrows. The diamond schematic diagram of the blocks, used in Fig. 4, is shown as an inset at the upper right.
Fig. 4
Fig. 4. Schematic comparison of assembly pathways.
a From the block dependencies in Fig. 3b, 29 possible intermediates are arranged from top to bottom, based on increasing block number. Intermediates observed within the datasets are shown in color, and unoccupied blocks are shown in gray. The presence of an intermediate in ∆deaD, ∆srmB, or bL17-depletion datasets is indicated by black closed circles, open circles, and squares, respectively. There are eight combinations consistent with the block dependencies that are not observed, indicated by faded intensities. Arrows connect the nearest precursors, with disassembly not allowed, requiring the assembly core as the parent node. Display of intermediate found in ∆deaD (b) and bL17-depletion (c) datasets. Blue bold arrows highlight the change in flux through the same set of intermediates in the different datasets. (See SI for the ∆srmB intermediate pathway, which is similar to ∆deaD).

References

    1. Chen SS, Sperling E, Silverman JM, Davis JH, Williamson JR. Measuring the dynamics of E. coli ribosome biogenesis using pulse-labeling and quantitative mass spectrometry. Mol. Biosyst. 2012;8:3325–3334. doi: 10.1039/c2mb25310k. - DOI - PMC - PubMed
    1. Lindahl L, Jaskunas SR, Dennis PP, Nomura M. Cluster of genes in Escherichia coli for ribosomal proteins, ribosomal RNA, and RNA polymerase subunits. Proc. Natl Acad. Sci. USA. 1975;72:2743–2747. doi: 10.1073/pnas.72.7.2743. - DOI - PMC - PubMed
    1. Britton RA. Role of GTPases in bacterial ribosome assembly. Annu Rev. Microbiol. 2009;63:155–176. doi: 10.1146/annurev.micro.091208.073225. - DOI - PubMed
    1. Karbstein K. Role of GTPases in ribosome assembly. Biopolymers. 2007;87:1–11. doi: 10.1002/bip.20762. - DOI - PubMed
    1. Shajani Z, Sykes MT, Williamson JR. Assembly of bacterial ribosomes. Annu Rev. Biochem. 2011;80:501–526. doi: 10.1146/annurev-biochem-062608-160432. - DOI - PubMed

Publication types

LinkOut - more resources