. 2023 Aug 26;14(8):567.
doi: 10.1038/s41419-023-06070-x.

FSP1 confers ferroptosis resistance in KEAP1 mutant non-small cell lung carcinoma in NRF2-dependent and -independent manner

Affiliations

FSP1 confers ferroptosis resistance in KEAP1 mutant non-small cell lung carcinoma in NRF2-dependent and -independent manner

Jong Woo Kim et al. Cell Death Dis. .

Abstract

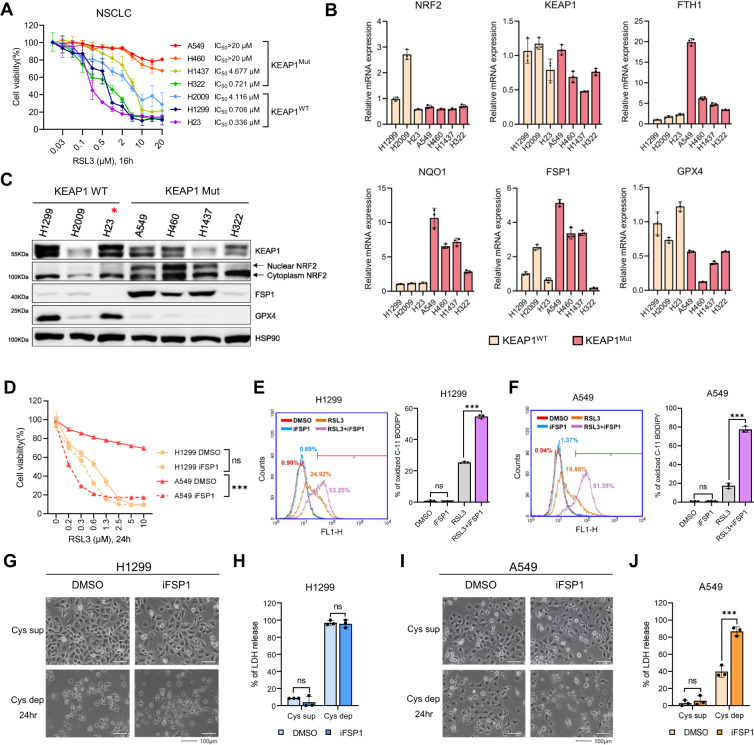
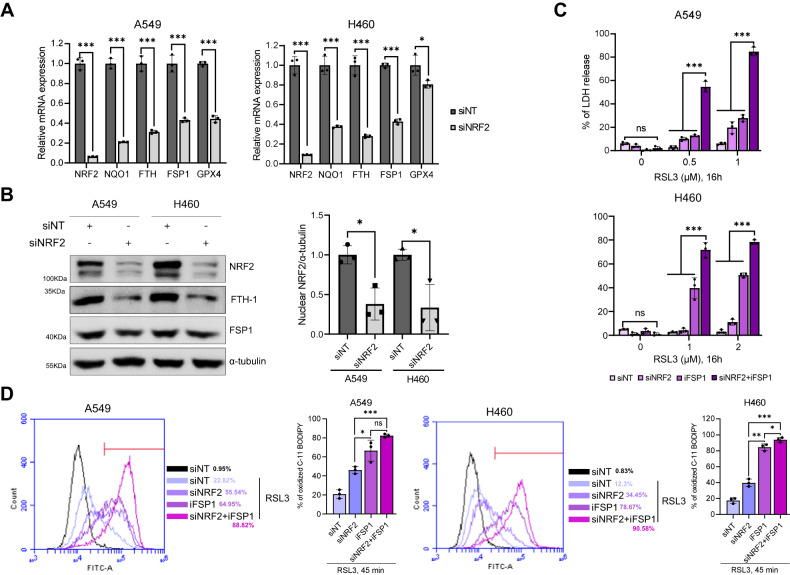
Ferroptosis, a type of cell death induced by lipid peroxidation, has emerged as a novel anti-cancer strategy. Cancer cells frequently acquire resistance to ferroptosis. However, the underlying mechanisms are poorly understood. To address this issue, we conducted a thorough investigation of the genomic and transcriptomic data derived from hundreds of human cancer cell lines and primary tissue samples, with a particular focus on non-small cell lung carcinoma (NSCLC). It was observed that mutations in Kelch-like ECH-associated protein 1 (KEAP1) and subsequent nuclear factor erythroid 2-related factor 2 (NRF2, also known as NFE2L2) activation are strongly associated with ferroptosis resistance in NSCLC. Additionally, AIFM2 gene, which encodes ferroptosis suppressor protein 1 (FSP1), was identified as the gene most significantly correlated with ferroptosis resistance, followed by multiple NRF2 targets. We found that inhibition of NRF2 alone was not sufficient to reduce FSP1 protein levels and promote ferroptosis, whereas FSP1 inhibition effectively sensitized KEAP1-mutant NSCLC cells to ferroptosis. Furthermore, we found that combined inhibition of FSP1 and NRF2 induced ferroptosis more intensely. Our findings imply that FSP1 is a crucial suppressor of ferroptosis whose expression is partially dependent on NRF2 and that synergistically targeting both FSP1 and NRF2 may be a promising strategy for overcoming ferroptosis resistance in cancer.


Conflict of interest statement

The authors declare no competing interests.

Figures

Fig. 1
Fig. 1. NRF2 activation following KEAP1 mutations led to ferroptosis resistance in NSCLC.
AF Observations in the NSCLC cell line datasets obtained from the DepMap portal. A Gene raking based on the significance of mutation enrichment in cell lines resistant to the indicated FINs. B, C RSL3 drug sensitivity of cell lines grouped by the mutation status of KEAP1 (B) and KRAS, TP53, and EGFR (C), with each data point representing a single cell line and lower AUC values indicating higher sensitivity to FIN treatment. D The top ten significantly enriched pathways in KEAP1 mutant cells compared to wild-type cells identified by performing GSEA. E GSEA plots showing the enrichment of NRF2 targets in gene rank based on differential expression between KEAP1 mutant vs. wild-type cells. F mRNA expression levels (log2TPM + 1) of key antioxidant response element (ARE) genes in cell lines grouped by KEAP1 mutation status. WT, wild type; Mut, mutant. GI Observations from patient samples in the TCGA LUAD cohort obtained from the GDC data portal. G The top ten significantly enriched pathways in KEAP1 mutant samples compared to wild-type samples by performing GSEA. H GSEA plots displaying the enrichment of genes involved in the nuclear receptors metapathway, NRF2 pathway, and NRF2 targets in KEAP1 mutant vs. wild-type samples. I mRNA expression levels of key ARE genes in samples grouped by KEAP1 mutational status.
Fig. 2
Fig. 2. Ferroptosis resistance in cancer is closely associated with increased FSP1 expression level.
A Gene ranking by Spearman correlation with RSL3 sensitivity based on mRNA expression (left) or protein expression (right) across over 700 cancer cell lines. B Correlation between RSL3 sensitivity and FSP1 abundance (mRNA expression, left; protein expression, right) in NSCLC cell lines. C Conserved ARE motifs and positions in NRF2 target genes and FSP1. Human genome references are GRCh38 and GRCh37, and mouse references are GRCm39. D Correlation between RSL3 sensitivity and FSP1 mRNA level in KEAP1 wild-type (left) and KEAP1 mutant cells (right) across pan-cancer cell lines. E FSP1 mRNA and protein expression levels in pan-cancer and NSCLC cell lines grouped by KEAP1 mutation status. F FIN sensitivity grouped by FSP1 mRNA expression levels. FSP1-high and FSP1-low groups were defined based on the median value of FSP1 expression level across pan-cancer cells. G Statistical significance of FIN sensitivity differences in cell lines grouped by KEAP1 mutation status (red) and FSP1 expression (blue) in pan-cancer cell lines. p-value was estimated by the Student’s t test. H The top ten significantly enriched pathways in FSP1-high cells compared to FSP1-low cells identified by performing GSEA. I GSEA plots for gene sets involved in transcriptional activation by NRF2, glutathione metabolism, or NRF2 targets in FSP1-high vs. FSP1-low cells. J FSP1 mRNA expression levels in TCGA pan-cancer and LUAD samples grouped by KEAP1 mutational status. K The top ten significantly enriched pathways in FSP1-high compared to FSP1-low TCGA LUAD samples identified by performing GSEA.
Fig. 3
Fig. 3. FSP1 inhibition increases the sensitivity of KEAP1 mutant NSCLC to ferroptosis.
A Relative cell viability of NSCLCs treated with an increasing concentration of RSL3 (μM) for 16 h. IC50 was calculated by GraphPad Prism 9 software. B The relative mRNA expression levels of ferroptosis-related genes in KEAP1 wild-type and mutant NSCLC were measured by qRT-PCR. All mRNA expression levels were normalized to β –Actin mRNA expression levels. C Western blot analysis in NSCLC was classified according to KEAP1 mutation status. The red star marks that H23 cells were exceptionally classified as KEAP1 wild-type because they harbor a mutation that does not affect KEAP1 protein function. D Relative cell viability of NSCLCs treated with the various concentrations of RSL3 ranging from 0 μM to 10 μM for 24 h. Cells were co-treated with RSL3 and DMSO or 3 μM of iFSP1. (E and F) Lipid peroxidation assessment in H1299 (E) and A549 (F) cells at 45 min after RSL3 (1 μM) or/and iFSP1 (3 μM) treatments using C-11 BODIPY (2.5 μM). The results are summarized as a bar graph showing relative levels in the right panel. G Microscopic morphology of H1299 cultured in cystine-deficient medium in the presence of iFSP1 (3 μM) for 24 h. The white line represents a 100 μm scale bar. H Relatively released LDH levels of H1299 cells treated with iFSP1 (3 μM) in cystine-deficient medium for 24 h. I, J Morphology and released LDH levels of A549 cells treated and measured as in G, H. All data are presented as the mean ± S.D (n = 3 independent experiments). The p-value is significant for p < 0.05 and the measurement of the value was according to the Student’s t test and one-way ANOVA.
Fig. 4
Fig. 4. FSP1 inhibition renders cells more susceptible to ferroptosis than NRF2 downregulation.
A Relative mRNA expression of NRF2 target genes in A549 and H460 upon NRF2 knockdown. Cells were transfected with a non-targeting siRNA pool (siNT) or an NRF2 siRNA pool (siNRF2) for 48 h, followed by RT-PCR analysis. All mRNA expression levels were normalized to β-Actin mRNA expression levels. B Western blot analysis showing NRF2, FTH-1, and FSP1 in A549 and H460 upon NRF2 knockdown for 48 h as in A. Representative western blots are shown in the left panel, and three independent analyses are shown as a bar graph in the right panel. Each target protein was quantified by α-tubulin. C Cell death measured by the LDH release of A549 and H460 cells transfected with siNRF2 for 48 h, followed by the treatment with RSL3 (0.5 and 1 μM) and iFSP1 (3 μM) for 16 h. D A histogram showing lipid peroxidation levels of control- and NRF2-depleted A549 and H460 cells treated with RSL3 (1 μM) and iFSP1 (3 μM) for 45 min. A bar graph quantifying lipid peroxidation was presented in the right panel. Analysis was performed 15 min after C-11 BODIPY (2.5 μM) treatment. All data are presented as the mean ± S.D (n = 3 independent experiments). The p-value is significant for p < 0.05 and the measurement of the value was according to Student’s t test.

References

    1. Dixon SJ, Lemberg KM, Lamprecht MR, Skouta R, Zaitsev EM, Gleason CE, et al. Ferroptosis: an iron-dependent form of nonapoptotic cell death. Cell. 2012;149:1060–72. doi: 10.1016/j.cell.2012.03.042. - DOI - PMC - PubMed
    1. Yang WS, Kim KJ, Gaschler MM, Patel M, Shchepinov MS, Stockwell BR. Peroxidation of polyunsaturated fatty acids by lipoxygenases drives ferroptosis. Proc Natl Acad Sci USA. 2016;113:E4966–75. doi: 10.1073/pnas.1603244113. - DOI - PMC - PubMed
    1. Stockwell BR. Ferroptosis turns 10: emerging mechanisms, physiological functions, and therapeutic applications. Cell. 2022;185:2401–21. doi: 10.1016/j.cell.2022.06.003. - DOI - PMC - PubMed
    1. Yang WS, SriRamaratnam R, Welsch ME, Shimada K, Skouta R, Viswanathan VS, et al. Regulation of ferroptotic cancer cell death by GPX4. Cell. 2014;156:317–31. doi: 10.1016/j.cell.2013.12.010. - DOI - PMC - PubMed
    1. Ursini F, Maiorino M. Lipid peroxidation and ferroptosis: the role of GSH and GPx4. Free Radic Biol Med. 2020;152:175–85. doi: 10.1016/j.freeradbiomed.2020.02.027. - DOI - PubMed

Publication types

MeSH terms