. 2023 Oct;42(41):3047-3061.
doi: 10.1038/s41388-023-02813-4. Epub 2023 Aug 26.

Polyploidy, EZH2 upregulation, and transformation in cytomegalovirus-infected human ovarian epithelial cells

Affiliations

Polyploidy, EZH2 upregulation, and transformation in cytomegalovirus-infected human ovarian epithelial cells

Ranim El Baba et al. Oncogene. 2023 Oct.

Abstract

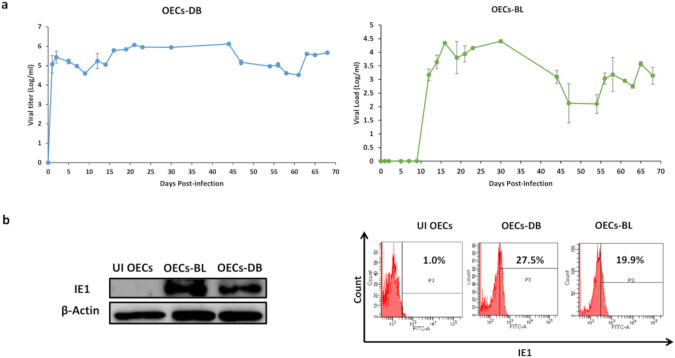
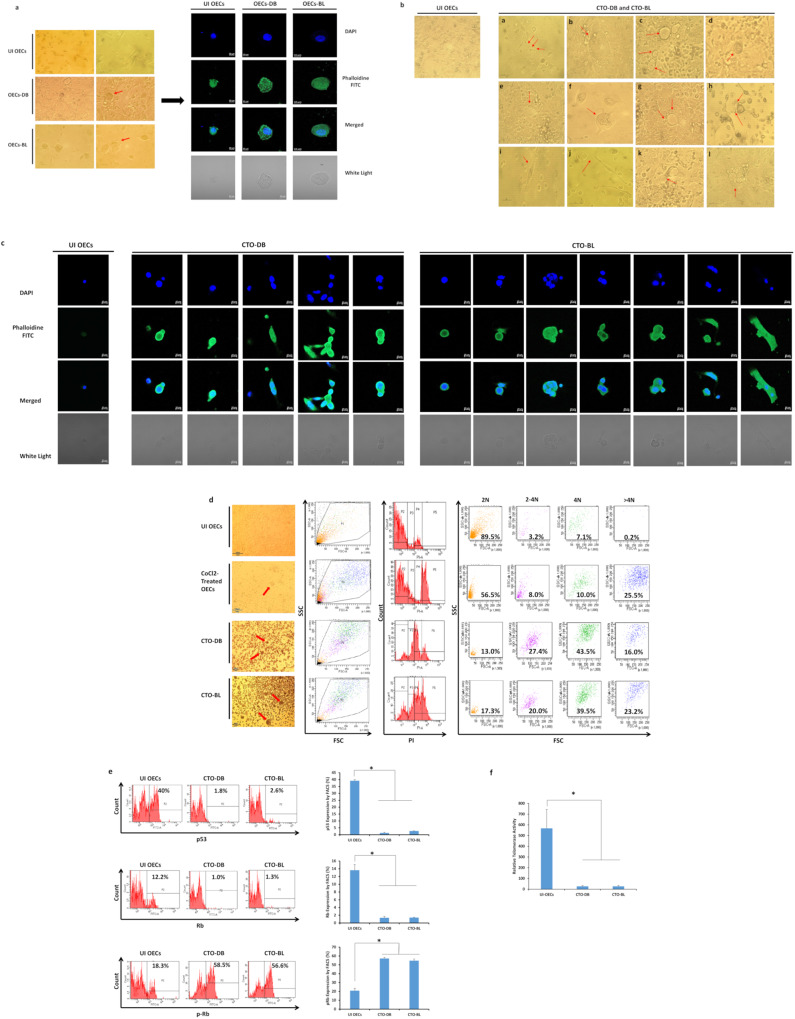
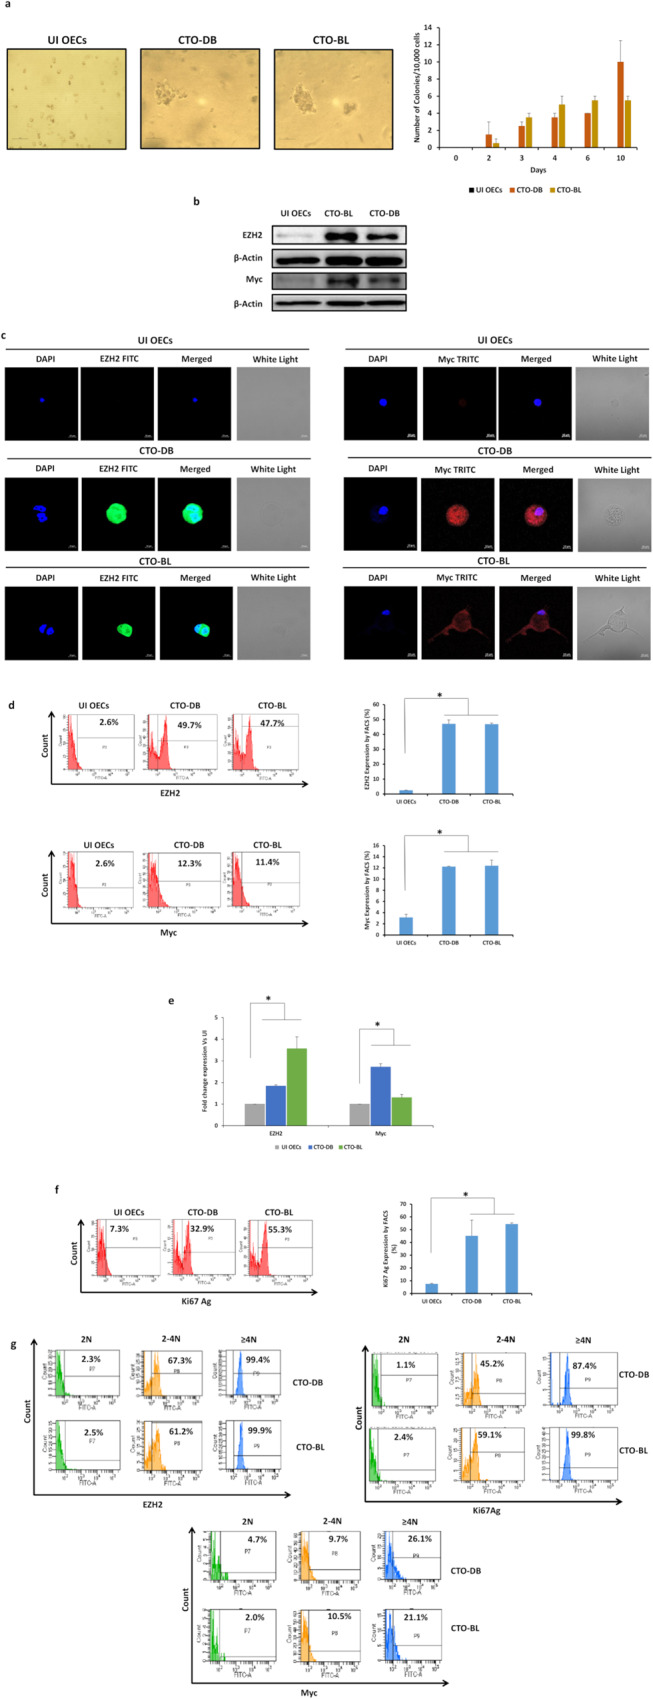
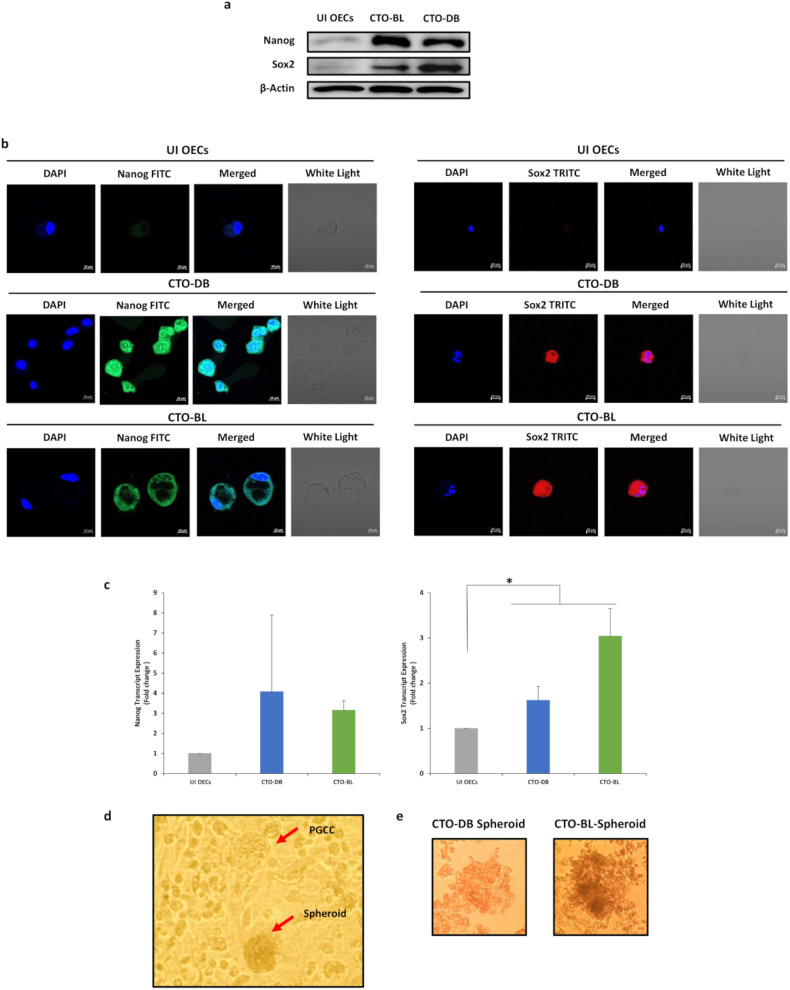
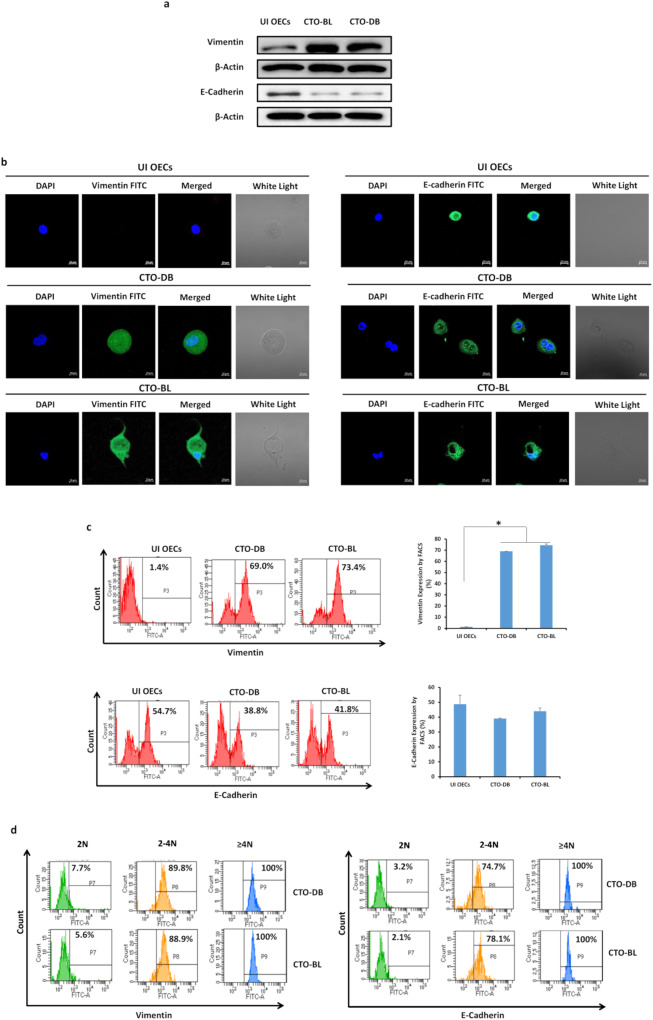
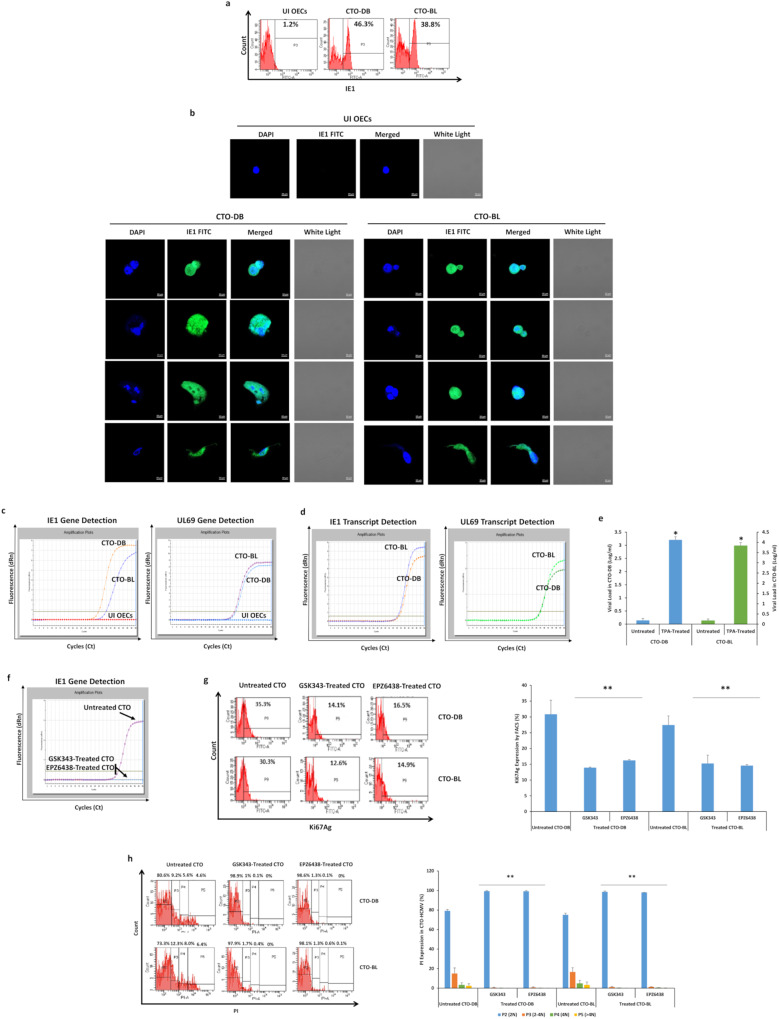
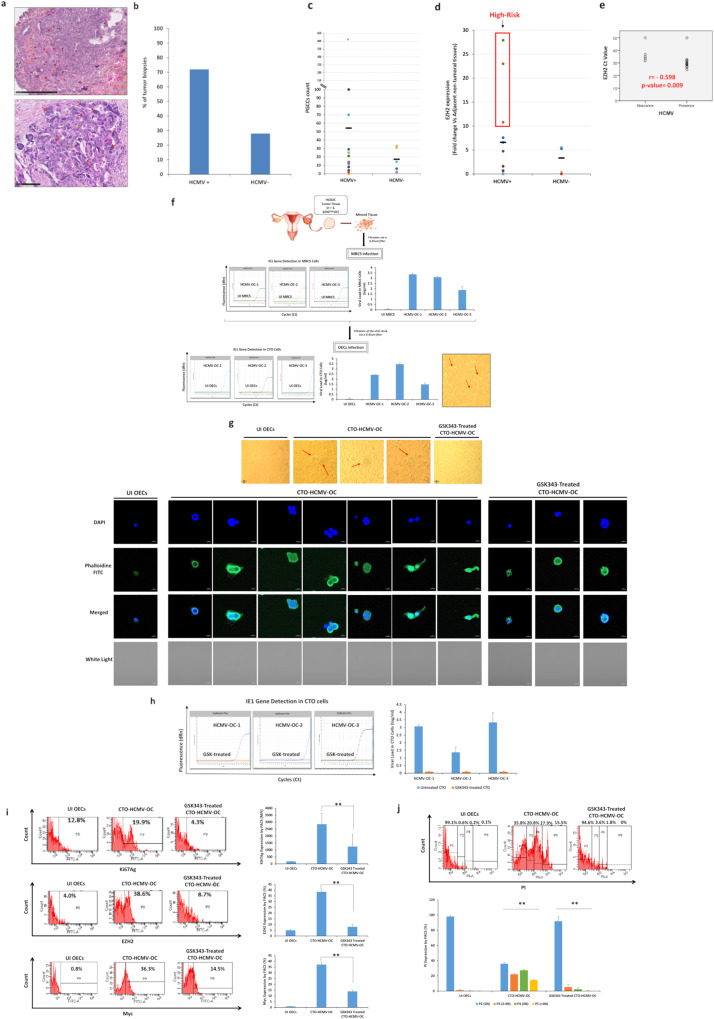
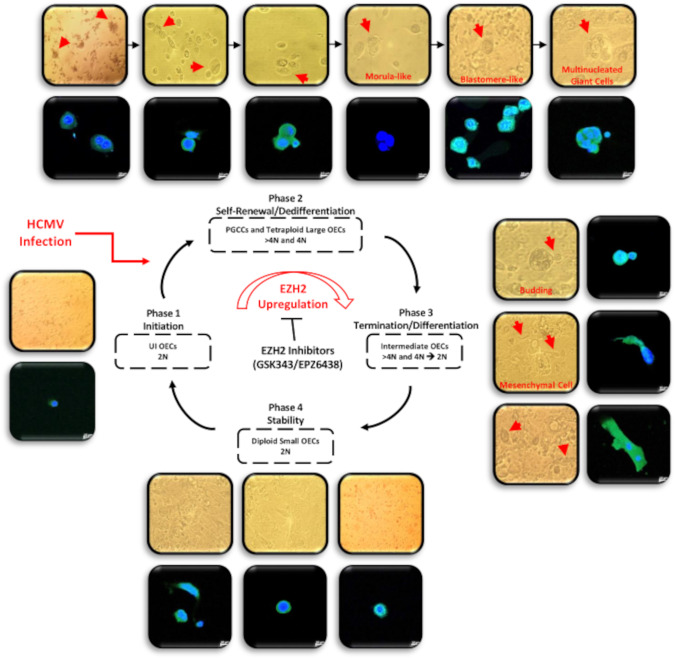
Human cytomegalovirus (HCMV) infection has been implicated in epithelial ovarian cancer (OC). Polyploidy giant cancer cells (PGCCs) have been observed in high-grade serous ovarian carcinoma (HGSOC); they possess cancer stem cell-like characteristics and give rise to progeny cells expressing epithelial-mesenchymal transition (EMT) markers. EZH2 plays a potential oncogenic role, correlating with high proliferative index and tumor grade in OC. Herein, we present the experimental evidence for HCMV as a reprogramming vector that elicited human ovarian epithelial cells (OECs) transformation leading to the generation of "CMV-transformed Ovarian cells" (CTO). The infection with the two high-risk clinical strains, namely HCMV-DB and BL provoked a distinct cellular and molecular mechanisms in infected OECs. EZH2 upregulation and cellular proliferation were curtailed by using EZH2 inhibitors. The HGSOC biopsies were characterized by an elevated EZH2 expression, possessing a strong positive correlation between the aforementioned marker and HCMV. From HGSOC biopsies, we isolated three HCMV clinical strains that transformed OECs generating CTO cells which displayed proliferative potentials in addition to EZH2 upregulation and PGCCs generation; these features were reduced upon EZH2 inhibition. High-risk HCMV strains transformed OECs confirming an HCMV-induced epithelial ovarian cancer model and highlighting EZH2 tumorigenic properties. Our findings might be highly relevant in the pathophysiology of ovarian tumors thereby nominating new targeted therapeutics.


Conflict of interest statement

The authors declare no competing interests.

Figures

Fig. 1
Fig. 1. Replication of high-risk HCMV strains in OECs cultures.
a Time-course of the viral titer in the supernatant of OECs infected with HCMV-DB and BL as measured by IE1-qPCR. b Immunoblotting data of IE1 in uninfected OECs lysates and OECs infected with HCMV-DB and BL (day 5 post-infection). β-actin was used as loading control. IE1 expression by FACS in acutely infected OECs-DB and BL; UI OECs were used as a control.
Fig. 2
Fig. 2. Chronic infection of OECs with the high-risk HCMV clinical isolates and polyploidy detection in OECs cultures.
a Microscopic images including confocal images of DAPI and phalloidine staining in OECs infected with HCMV-DB and BL; uninfected OECs were used as a negative control. Left panel: magnification ×100 and ×200, scale bar 100 and 50 μm; Right panel: magnification ×63, scale bar 10 μm. Red arrows showing the PGCCs detected in OECs cultures. b The appearance of distinct cellular morphologies of the giant cell cycle including (a) filopodia, (b, c, d) blastomeres and blastocytes, (e) lipid droplets-filled cells, (f) multinucleated, (g, h) budding, (i) mesenchymal cells as well as (j, k, l) few atypical morphologies; magnification ×100, scale bar 100 μm. Uninfected OECs were used as a control. c Confocal microscopic images of DAPI and phalloidine staining in CTO-DB and BL. Uninfected OECs were used as a negative control; magnification ×63, scale bar 10 μm. d Propidium iodide (PI) staining for polyploidy detection in HCMV-transformed OECs. Cobalt chloride (CoCl2)-treated OECs (450 μM) were used as a positive control. Microscopic images of uninfected OECs as well as the PGCCs generated in CTO-DB and BL cultures and post-CoCl2 treatment; magnification ×100, scale bar 100 μm. e p53, Rb, and p-Rb expression in uninfected OECs and CTO-DB and BL by FACS. f Histograms representing the relative telomerase activity in uninfected OECs as well as CTO-DB and BL. Data are represented as mean ± SD of two independent experiments. *p-value ≤ 0.05.
Fig. 3
Fig. 3. Colony formation in soft agar and the phenotypic characterization of HCMV-transformed OECs.
a Colony formation in soft agar seeded with CTO-DB and BL (MOI = 1); UI OECs were used as a negative control. Formed colonies were observed under an inverted light microscope (Magnification ×200, scale bar 50 µm). Histogram representing the colony quantification/10,000 cells over days. b Immunoblotting data of EZH2 and Myc in uninfected OECs lysates and CTO-DB and BL. β-actin was used as loading control. c Confocal microscopic images of EZH2, Myc, and DAPI staining in CTO-DB and BL. UI OECs were used as controls; magnification ×63, scale bar 10 μm. d FACS staining of EZH2 and Myc in uninfected OECs as well as CTO-DB and BL. e EZH2 and Myc transcripts detection by RT-qPCR. f FACS staining of Ki67Ag in uninfected OECs as well as CTO-DB and BL. g EZH2, Myc, and Ki67Ag expression in CTO-DB and BL subpopulations (2 N, 2–4 N, and ≥4 N). Data are represented as mean ± SD of two independent experiments. *p-value ≤ 0.05.
Fig. 4
Fig. 4. HCMV-transformed OECs display an embryonic stemness phenotype and possess spheroid-forming potential.
a Immunoblotting data of Nanog and Sox2 in uninfected OECs lysates and CTO-DB and BL. β-actin was used as loading control. b Confocal microscopic images of Nanog, Sox2, and DAPI staining in CTO-DB and BL. UI OECs were used as controls; magnification ×63, scale bar 10 μm. c Nanog and Sox2 transcripts detection by RT-qPCR. Data are represented as mean ± SD of two independent experiments. d Spontaneous spheroid formation and PGCCs were detected under an inverted light microscope in HCMV-transformed OECs cultures. Magnification ×100, scale bar 100 μm. e Spheroid generation from the chronically infected DB and BL OECs in methyl-cellulose assay; magnification ×100, scale bar 100 µm. *p-value ≤ 0.05.
Fig. 5
Fig. 5. HCMV infection of OECs enhances EMT/MET hybrid traits.
Vimentin and E-cadherin expression by western blot (a), confocal microscopy (b), and FACS (c) in CTO-DB and BL. Uninfected OECs were used as controls. d Vimentin and E-cadherin expression in CTO-DB and BL subpopulations (2 N, 2–4 N, and ≥4 N). Data are represented as mean ± SD of two independent experiments. *p-value ≤ 0.05.
Fig. 6
Fig. 6. Sustained HCMV replication in chronically HCMV-infected OECs.
a IE1 expression by FACS in chronically infected OECs-DB and BL cultures. b IE1 expression by confocal microscopy in CTO-DB and BL; uninfected OECs were used as a control. Nuclei were counterstained with DAPI; magnification ×63, scale bar 10 μm. c IE1 and UL69 gene detection in chronically infected OECs-DB and BL as measured by qPCR. Uninfected OECs were used as a negative control. d IE1 and UL69 transcripts detection as measured by RT-qPCR. e Histogram representing the viral load post-TPA treatment in CTO-DB and BL cultures as measured by IE1-qPCR. f IE1 gene detection by qPCR in untreated CTO-DB, and CTO-DB treated with two EZH2 inhibitors (0.1 µM of GSK34 and EPZ6438). Ki67Ag expression (g) and PI staining (h) in untreated CTO-DB/BL and CTO-DB/BL treated with 0.1 µM of GSK34 and EPZ6438 by FACS. Data are represented as mean ± SD of two independent experiments. *p-value ≤ 0.05; **p-value ≤ 0.01.
Fig. 7
Fig. 7. HCMV detection, PGCCs presence as well as EZH2 expression in ovarian cancer biopsies.
a Ovarian cancer tissue HES staining; magnification ×400, scale bar 250 µm (upper panel) and 100 µm (lower panel). Red arrow representing the PGCCs while the yellow arrow represents the diploid carcinoma cells. b Histogram representing HCMV presence in the ovarian tumor biopsies. c Scattered plots showing the PGCCs count in HCMV-positive and negative ovarian tumor biopsies. d Scattered plots representing EZH2 expression in HCMV-positive and negative ovarian tumor biopsies by RT-qPCR. Red box indicates the high-risk HCMV strains with high EZH2 expression. e Correlation test between Ct value of EZH2 and HCMV presence p-values were determined by Spearman’s correlation test. f Isolation protocol of the three high-risk HCMV-ovarian cancer strains from HGSOC tissues; histogram representing the viral replication of the isolated HCMV strains in MRC5 cells and CTO cultures by IE-qPCR. CTO cells were observed under an inverted light microscope (magnification ×200, scale bar 50 µm). g Light microscopic images (magnification ×200, scale bar 50 µm) as well as confocal images of DAPI and phalloidine staining in CTO-HCMV-OC and GSK343-treated CTO cells (magnification ×63, scale bar 10 μm); uninfected OECs were used as a negative control. h IE1 gene detection in CTO-HCMV-OC and GSK343-treated CTO cells by IE-qPCR. i, j Ki67Ag, EZH2, Myc expression (i) and PI staining (j) in CTO-HCMV-OC, GSK343-treated CTO cells, and uninfected OECs by FACS. Data are represented as mean ± SD of two independent experiments. **p-value ≤ 0.01.
Fig. 8
Fig. 8. A schematic representing the giant cell cycling following HCMV infection of OECs.
Giant cell cycle representing four distinct phases including initiation, self-renewal, termination and stability. Upon HCMV infection, the 2 N OECs go into the initiation phase through endoreplication. Polyploid cells ( > 4 N) and tetraploid cells (4 N) generate in the self-renewal/dedifferentiation stage due to HCMV infection and the subsequent EZH2 upregulation. Cell budding takes place from multinucleated or mononucleated giant cells generating intermediate 2–4 N OECs during the termination/differentiation phase. Intermediate OECs gradually reach stability and are converted into diploid small OECs (2 N).

Similar articles

Cited by

References

    1. Cox M, Kartikasari AER, Gorry PR, Flanagan KL, Plebanski M. Potential Impact of Human Cytomegalovirus Infection on Immunity to Ovarian Tumours and Cancer Progression. Biomedicines. 2021;9:351.. doi: 10.3390/biomedicines9040351. - DOI - PMC - PubMed
    1. Dangaj Laniti D, Coukos G. Genetics and anatomy sculpt immune-cell partners of ovarian cancer. Nature. 2022;612:634–6. doi: 10.1038/d41586-022-04169-3. - DOI - PubMed
    1. Leary A, Tan D, Ledermann J. Immune checkpoint inhibitors in ovarian cancer: where do we stand? Ther Adv Med Oncol. 2021;13:175883592110398.. doi: 10.1177/17588359211039899. - DOI - PMC - PubMed
    1. Wysocki PJ, Łobacz M, Potocki P, Kwinta Ł, Michałowska-Kaczmarczyk A, Słowik A, et al. Metronomic Chemotherapy Based on Topotecan or Topotecan and Cyclophosphamide Combination (CyTo) in Advanced, Pretreated Ovarian Cancer. Cancers. 2023;15:1067.. doi: 10.3390/cancers15041067. - DOI - PMC - PubMed
    1. Lim P-Q, Han I-H, Seow K-M, Chen K-H. Hyperthermic Intraperitoneal Chemotherapy (HIPEC): An Overview of the Molecular and Cellular Mechanisms of Actions and Effects on Epithelial Ovarian Cancers. IJMS. 2022;23:10078.. doi: 10.3390/ijms231710078. - DOI - PMC - PubMed