. 2023 Oct;10(30):e2301868.
doi: 10.1002/advs.202301868. Epub 2023 Aug 27.

Generation of Human Endometrial Assembloids with a Luminal Epithelium using Air-Liquid Interface Culture Methods

Affiliations

Generation of Human Endometrial Assembloids with a Luminal Epithelium using Air-Liquid Interface Culture Methods

Jiwen Tian et al. Adv Sci (Weinh). 2023 Oct.

Abstract

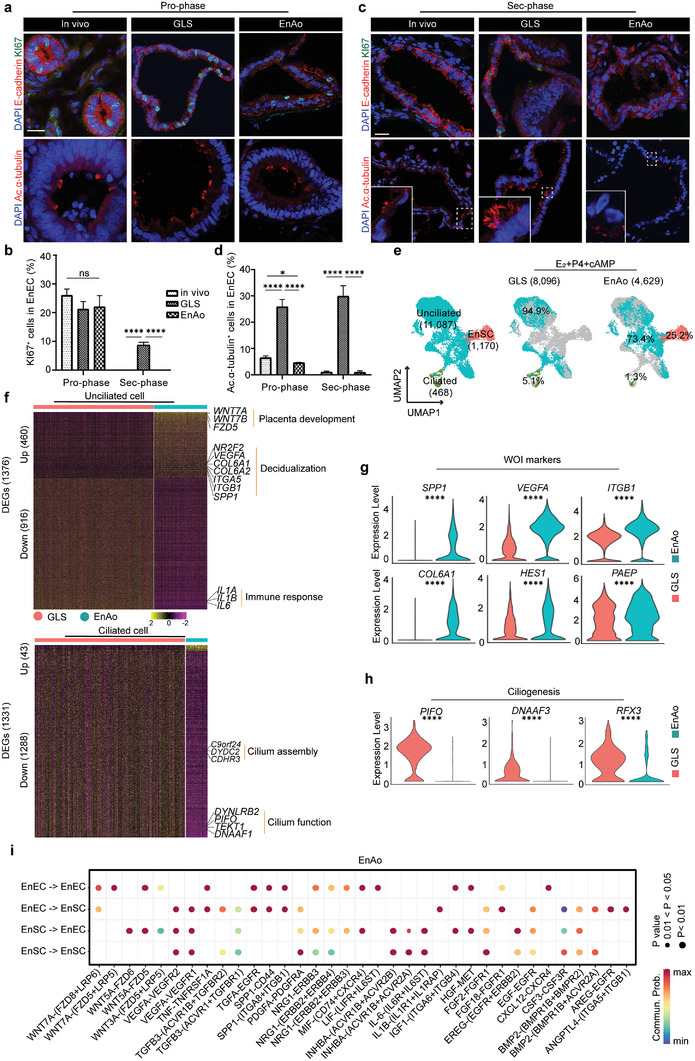
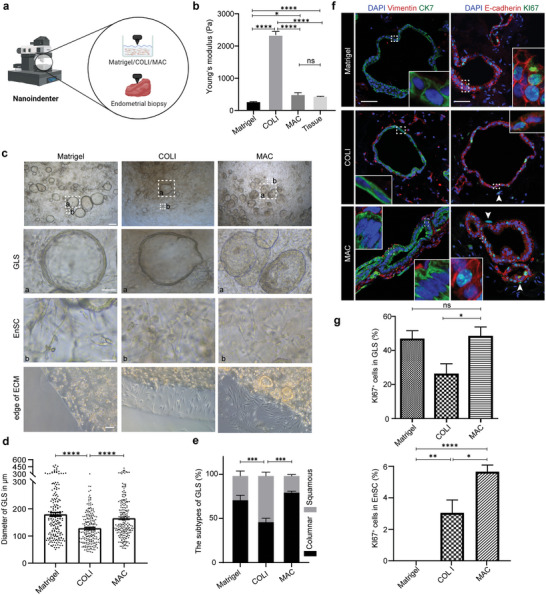
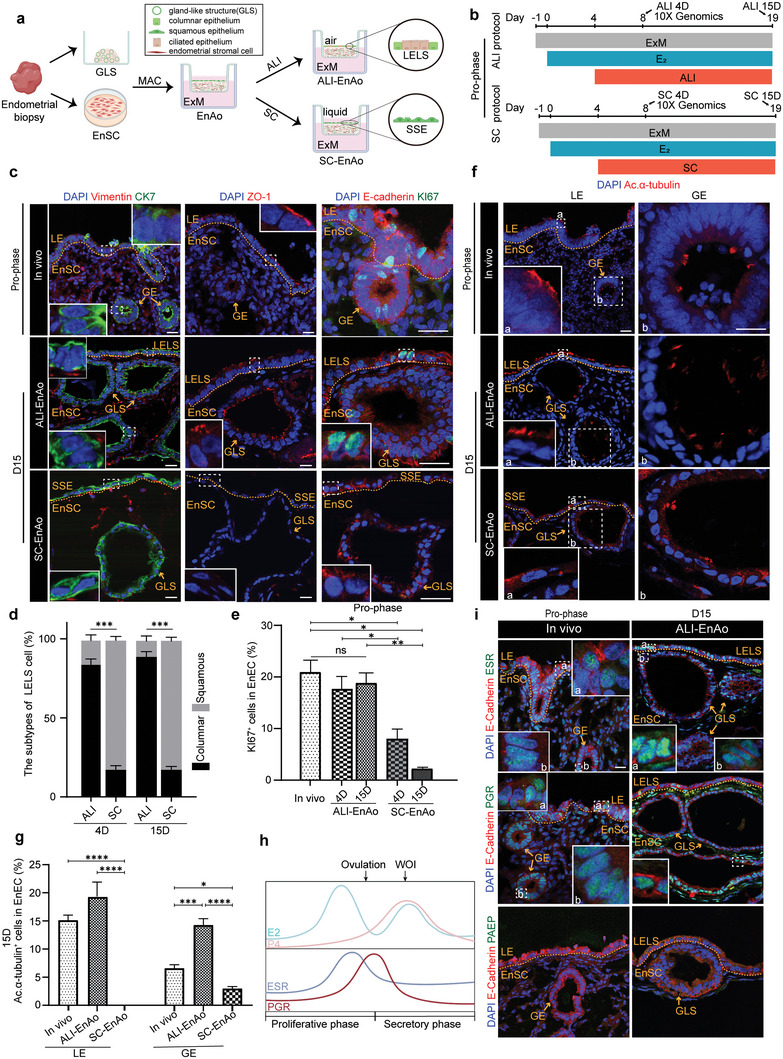
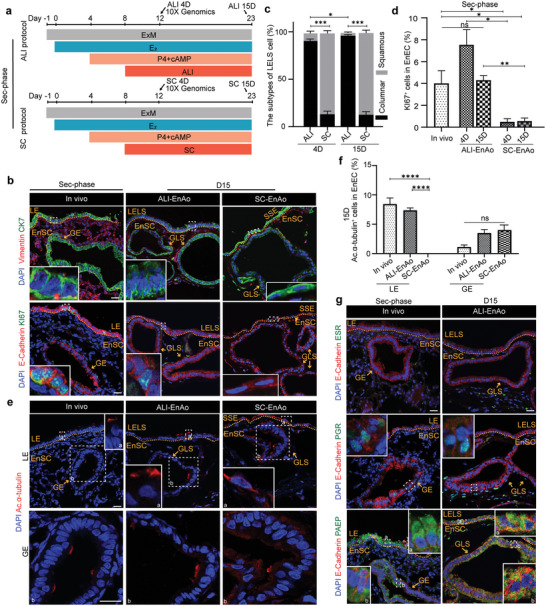
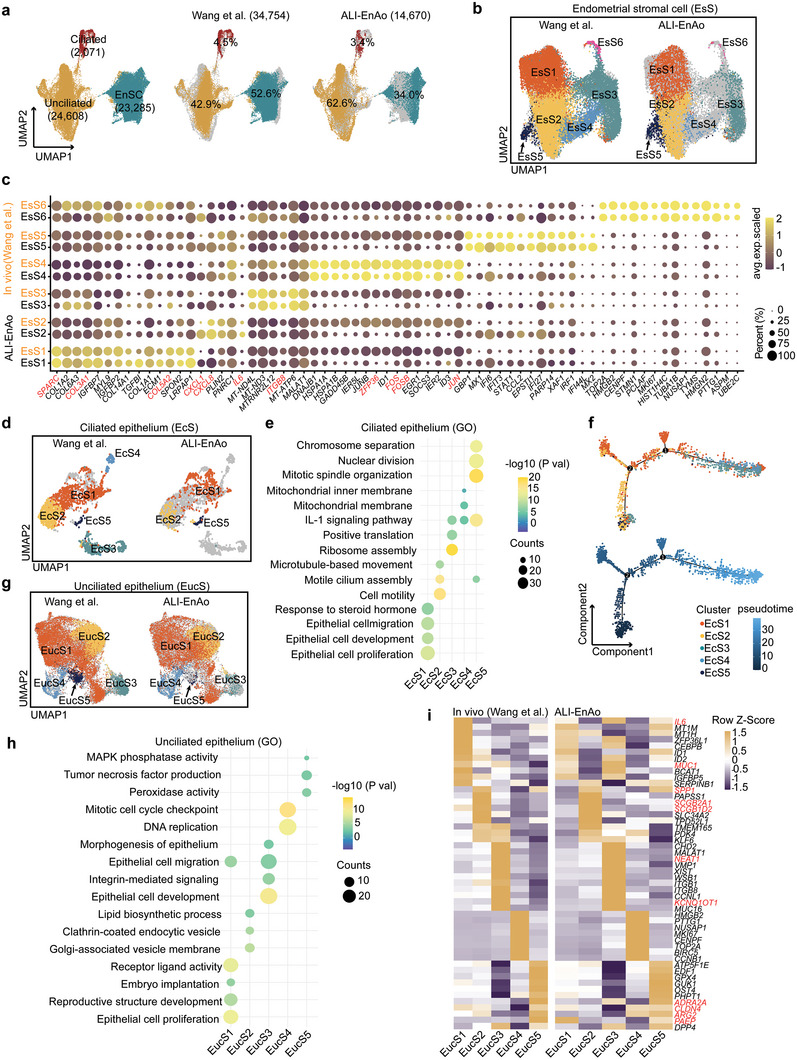
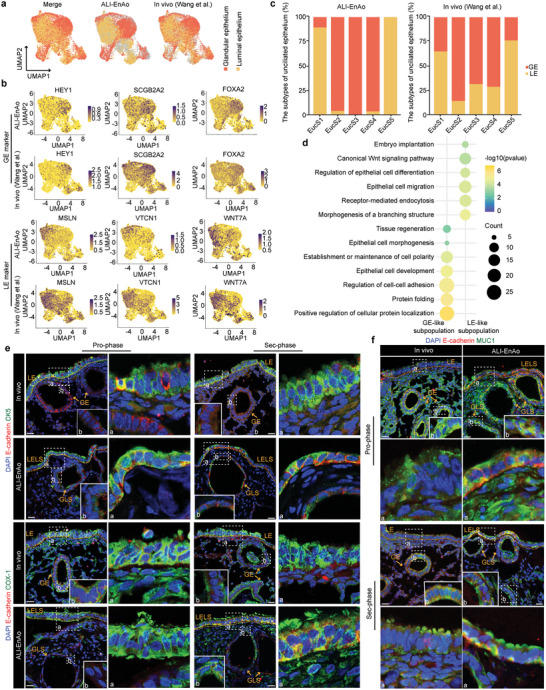
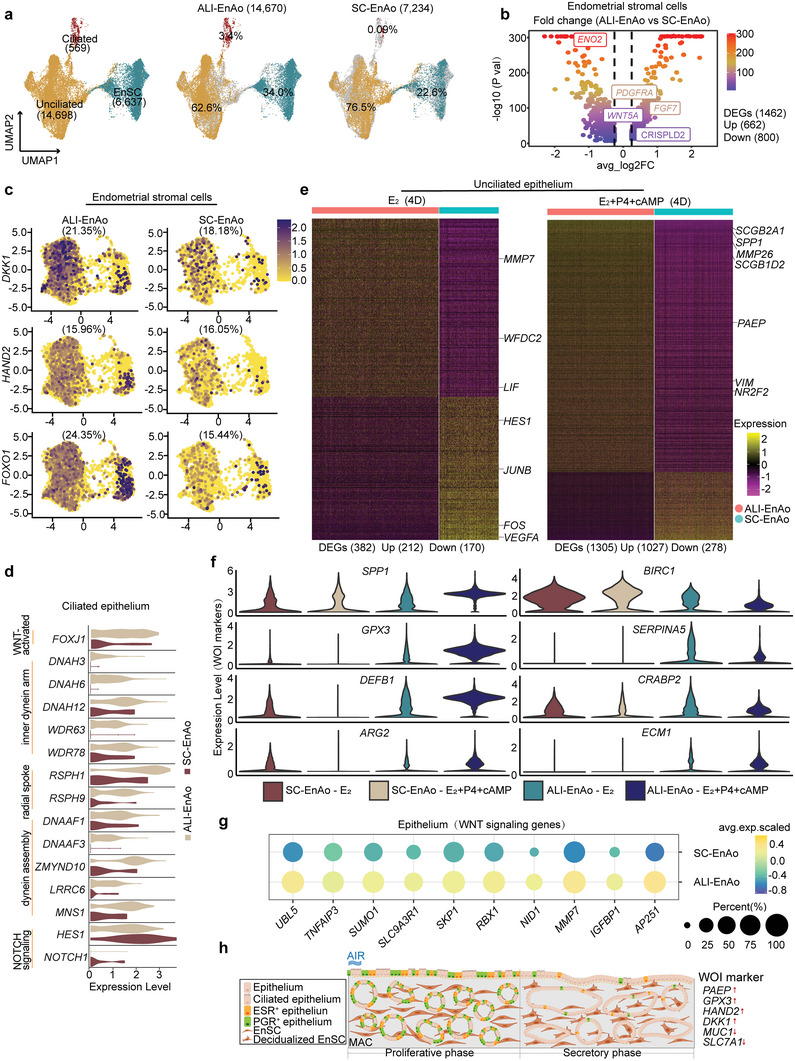
The endometrial lining of the uterus is essential for women's reproductive health and consists of several different types of epithelial and stromal cells. Although models such as gland-like structures (GLSs) and endometrial assembloids (EnAos) are successfully established, they lack an intact luminal epithelium, which makes it difficult to recapitulate endometrial receptivity. Here, a novel EnAo model (ALI-EnAo) is developed by combining endometrial epithelial cells (EnECs) and stromal cells (EnSCs) and using an improved matrix and air-liquid interface (ALI) culture method. ALI-EnAos exhibit intact EnSCs and glandular and luminal epithelia, which recapitulates human endometrium anatomy, cell composition, hormone-induced menstrual cycle changes, gene expression profiles, and dynamic ciliogenesis. The model suggests that EnSCs, together with the extracellular matrix and ALI culture conditions, contribute to EnAo phenotypes and characteristics reflective of the endometrial menstrual cycle. This enables to transcriptionally define endometrial cell subpopulations. It anticipates that ALI-EnAos will facilitate studies on embryo implantation, and endometrial growth, differentiation, and disease.

Keywords: air-liquid interface; endometrial assembloids; luminal epithelium; organoid.


Conflict of interest statement

The authors declare no conflict of interest.

Figures

Figure 1
Figure 1
Endometrial stromal cells (EnSCs) contribute to gland‐like epithelium activity. GLS especially indicates gland‐like structures without EnSC incorporation. a) Representative staining of KI67 and acetylated‐α‐tubulin (Ac.α‐tubulin) in the endometrium, gland‐like structure (GLS), and endometrial assembloid (EnAo) at proliferative phase (Pro‐phase). Scale bars: 25 µm. b) Quantification of KI67+ cells in EnECs of glandular epithelium across menstrual phases. c) Representative staining of KI67 and Ac.α‐tubulin in the endometrium, GLS and EnAo at secretory phase (Sec‐phase). Scale bars: 25 µm. d) Quantification of Ac.α‐tubulin+ ciliated cells in EnECs across menstrual phases. e) UMAP visualization of integrated single‐cell RNA‐Seq from GLSs and EnAos at D9 after E2+P4+cAMP treatment (as the protocol of Figure S1d, Supporting Information). f) Heat maps of differentially expressed genes (DEGs) in unciliated cells (top) and ciliated cells (bottom) between GLSs and EnAos. Gene expression levels were normalized. Red represents GLSs and green represents EnAos. g) Violin plots showing expression levels of WOI marker genes in epithelial unciliated cells of GLSs and EnAos. Gene expression levels were normalized. Red represents GLS and green represents EnAo. h) Violin plots showing expression levels of marker genes related ciliogenesis in ciliated cells of GLSs and EnAos. Gene expression levels were normalized. Red represents GLS and green represents EnAo. i) Dot plots of representative ligand‐receptor interactions between EnECs and EnSCs in EnAos. Circle size indicates P value and the color means the average expression of the interacting molecules, respectively. b,d) All data were obtained from three different donors. Data are presented as means ± SEMs; Wilcoxon test was used to perform gene expression in scRNA‐seq and two‐sided unpaired Student's t‐test was used to perform the statistical analyses of staining; * p ≤ 0.05; ** p ≤ 0.01; *** p ≤ 0.001; **** p ≤ 0.0001; ns, no significance.
Figure 2
Figure 2
A combination of Matrigel and collagen facilitates physiological EnAo formation. a) Schematic diagram for testing Young's modulus (stiffness) of different culture extracellular matrices (ECMs) containing cells and endometrial biopsies. b) Young's modulus of different ECMs containing cells and endometrium tissue from Pro‐phase. (N = 3 donors). c) Representative contrast‐phase images of EnAos growing in different ECMs. Scale bars: 250 µm (low magnification); 100 µm (GLS); 50 µm (EnSC); 100 µm (edge of ECM). d) Quantification of the diameter in µm of GLS growing in different ECMs after hormone treatment on Day 4. At least >180 GLSs were quantified each experiment. Repeated experiments from three donors were assessed, yielding similar results. e) Quantification of columnar‐ and squamous‐Type GLS in EnAos growing in different ECMs. At least >100 GLSs were quantified each experiment. f) Representative double staining of Vimentin/CK7 (left) and KI67/E‐cadherin (right) in EnAos grown in different ECMs. Scale bars: 25 µm. Arrows, KI67+ EnSCs. g) Quantification of KI67+ cells in GLSs and EnSCs grown in different ECMs. e,g) All data were obtained based on three different donor cells; b,d,e,g), data are presented as means ± SEMs; Chi‐square test was used to analyze percentage of GLS subtypes and two‐sided unpaired Student's t‐test was used to perform the statistical analyses of staining and stiffness; * p ≤ 0.05; ** p ≤ 0.01; *** p ≤ 0.001; **** p ≤ 0.0001; ns, no significance.
Figure 3
Figure 3
Air–Liquid Interface culture methods improve EnAo features at the Pro‐phase. a) Scheme of the air–liquid interface (ALI) and submerged culture (SC) of EnAos. b) Protocol of ALI‐EnAo and SC‐EnAo to mimic Pro‐phase. The time point at which samples were collected for scRNA‐seq and staining analysis is highlighted with arrows. c) Representative staining of indicated endometrial markers. CK7 for EnECs; Vimentin for EnSCs; ZO1 for cell polarity; KI67 for cell proliferation; and E‐cadherin for epithelium. Scale bars: 25 µm. d) Quantification of columnar and squamous cells in the superficial layer of EnAos cultured in the ALI or SC condition on Day 4 and 15, respectively. At least >150 cells were quantified each experiment. e) Quantification of KI67+ EnECs in endometrium in vivo and EnAos cultured in the ALI and SC condition. At least >200 cells were quantified each experiment. f,g) Representative staining f) and quantification g) of ciliated cell marker Ac.α‐tubulin in LE and GE of endometrium, ALI‐EnAos, and SC‐EnAos on D15. Scale bars: 25 µm. h) Dynamic expression changes of estrogen receptor (ESR) and progesterone receptor (PGR) along with E2 and P4 change during menstrual cycle. i) Representative staining of indicated markers in endometrium and ALI‐EnAo on D15 at Pro‐phase. Scale bars: 25 µm. d,e,g) All data were obtained based on three different donor cells. Data are presented as means ± SEMs; Chi‐square test was used to analyze percentage of cell subtypes and two‐sided unpaired Student's t‐test was used to perform the statistical analyses of staining; * p ≤ 0.05; ** p ≤ 0.01; *** p ≤ 0.001; **** p ≤ 0.0001; ns, no significance. LELS, luminal epithelium‐like structure; GLS, gland‐like structure; SSE, simple squamous epithelium. Endometrium in vivo was obtained from donors during mid‐late Pro‐phase in Figure 3.
Figure 4
Figure 4
Air–Liquid Interface culture methods improve EnAo features at the Sec‐phase. a) Protocol of ALI‐EnAos and SC‐EnAos to mimic the secretory endometrium in vivo. The time point at which samples were collected for scRNA‐seq and staining analysis are highlighted with arrows. b) Representative staining of endometrial markers in endometrium, ALI‐EnAos, and SC‐EnAos. CK7 for EnECs; and Vimentin for EnSCs; KI67 for cell proliferation; and E‐cadherin for epithelium. Scale bars: 25 µm. c) Quantification of columnar and squamous cells in the superficial layer of ALI‐EnAos and SC‐EnAos on Day 4 and 15, respectively. At least >150 cells were quantified each experiment. d) Quantification of KI67+ EnECs in endometrium in vivo, ALI‐EnAos, and SC‐EnAos. At least >200 cells were quantified each experiment. e,f) Representative staining e) and quantification f) of ciliated cell marker Ac.α‐tubulin in LE and GE from endometrium in vivo, ALI‐EnAos and SC‐EnAos on D15. Scale bars: 25 µm. g) Representative staining of E‐cadherin, ESR, PGR, and PAEP in endometrium in vivo and ALI‐EnAo on D15. Scale bars: 25 µm. c,d,f) All data were obtained based on three different donor cells. Data are presented as means ± SEMs; Chi‐square test was used to analyze percentage of cell subtypes and a two‐sided unpaired Student's t‐test was used to perform the statistical analyses of staining; * p ≤ 0.05; ** p ≤ 0.01; *** p ≤ 0.001; **** p ≤ 0.0001; ns, no significance. LELS, luminal epithelium‐like structure; GLS, gland‐like structure; SSE, simple squamous epithelium. Endometrium in vivo was obtained from donors during the mid‐late Sec‐phase in Figure 4.
Figure 5
Figure 5
ALI‐EnAos has a similar transcriptome to the in vivo endometrium. a) UMAP analysis of integrated scRNA‐Seq from both Pro‐ and Sec‐phase ALI‐EnAos and human endometrium across menstrual cycle (EnSCs and EnECs from the whole Pro‐ and Sec‐phase).[ 19 ] b) EnSCs were subclustered into six subtypes, exhibiting high similarity in cell composition between ALI‐EnAos and endometrium. c) Dot plots of some representative genes specific for each subtype in EnSCs of ALI‐EnAos and endometrium in vivo. Dot size indicates proportion of cells expressing the gene in the cluster, and shading indicates the average expression scaled (low to high reflected as light to dark). d) Ciliated cells were subclustered into five subtypes, with high similarity between ALI‐EnAos and endometrium. e) Representative GO terms related to biological processes enriched in different ciliated cell subpopulations. f) Pseudotime showing the differentiation trend of ciliated cell subpopulations. g) Unciliated cells were subclustered into five subtypes, exhibiting high similarity in cell composition between ALI‐EnAos and endometrium. h) Representative GO terms related to biological processes enriched in different unciliated cell subpopulations. i) Composite heatmaps showing relative expression (Z‐scores) of marker genes in unciliated cells subpopulations of ALI‐EnAos and endometrium in vivo.
Figure 6
Figure 6
Identification of luminal and glandular epithelium in ALI‐EnAos. a) Annotated unciliated epithelia into luminal and glandular epithelia populations of ALI‐EnAo in the integrative analysis data with in vivo endometrium according to LE and GE specific markers expression. Distribution of LE and GE of in vivo endometrium was shown based on a previous report.[ 19 ] b) Similar expression pattern of LE (WNT7A, MSLN, and VTCN1) and GE‐specific markers (HEY1, SCGB2A2, and FOXA2) between ALI‐EnAo and in vivo. c) The relationship between EucS1‐EucS5 and LE/GE membership defined in ALI‐EnAo and in vivo, respectively. d) Representative GO terms of genes enriched in LE/GE‐like subpopulation of ALI‐EnAos, respectively. e) Representative staining of indicated luminal epithelium markers for ALI‐EnAos and in vivo endometrium. E‐cadherin for epithelium; CK5 and COX‐1 for luminal epithelium. Scale bars: 25 µm. f) Representative staining of indicated secreted mucus proteins. E‐cadherin for epithelium; MUC1 for mucus protein. Scale bars: 25 µm. LELS, luminal epithelium‐like structure; GLS, gland‐like structure.
Figure 7
Figure 7
ALI promotes physiologically‐relevant gene expression patterns in EnAos. a) UMAP analysis of integrated scRNA‐Seq data from ALI‐EnAos and SC‐EnAos (both under E2 and E2+P4+cAMP treatment with ALI 4D). b) Volcano plot of differentially expressed genes (DEGs) in EnSCs between ALI‐EnAos and SC‐EnAos. c) UMAP plots of representative decidualization genes in EnSCs of ALI‐EnAos and SC‐EnAos (The percentage represents the proportion of positively expressed cells). d) Violin plots of ciliogenesis‐related genes in ciliated cells of ALI‐EnAos and SC‐EnAos. e) Heat maps of DEGs in unciliated cells of ALI‐EnAos and SC‐EnAos under E2 and E2+P4+cAMP treatment to minic different phases. Some representative genes were shown. Gene expression levels were normalized. f) Differential expressions of some representative window of implantation (WOI) genes in ALI‐EnAos and SC‐EnAos under E2 (D4) and E2+P4+cAMP (D4) treatment to minic Pro‐phase and Sec‐phase. Gene expression levels were normalized. g) Related genes of WNT signaling pathway in epithelium of ALI‐EnAos and SC‐EnAos. h) Schematic diagram of the ALI‐cultured EnAos mimicking proliferative and secretory endometrium.

Similar articles

Cited by

References

    1. a) Finn C. A., Q. Rev. Biol. 1998, 73, 163; - PubMed
    2. b) Evans J., Salamonsen L. A., Winship A., Menkhorst E., Nie G., Gargett C. E., Dimitriadis E., Nat. Rev. Endocrinol. 2016, 12, 654. - PubMed
    1. a) Norwitz E. R., Schust D. J., Fisher S. J., N. Engl. J. Med. 2001, 345, 1400; - PubMed
    2. b) Paria B. C., Reese J., Das S. K., Dey S. K., Science 2002, 296, 2185. - PubMed
    1. a) Psychoyos A., Ann. N. Y. Acad. Sci. 1986, 476, 36; - PubMed
    2. b) Ma W.‐g., Song H., Das S. K., Paria B. C., Dey S. K., Proc. Natl. Acad. Sci. USA 2003, 100, 2963. - PMC - PubMed
    1. a) Aplin J. D., Ruane P. T., J. Cell Sci. 2017, 130, 15; - PubMed
    2. b) James J. L., Carter A. M., Chamley L. W., Placenta 2012, 33, 327; - PubMed
    3. c) Gellersen B., Brosens J. J., Endocr. Rev. 2014, 35, 851. - PubMed
    1. a) Lancaster M. A., Knoblich J. A., Science 2014, 345, 1247125; - PubMed
    2. b) Nakano T., Ando S., Takata N., Kawada M., Muguruma K., Sekiguchi K., Saito K., Yonemura S., Eiraku M., Sasai Y., Cell Stem Cell 2012, 10, 771; - PubMed
    3. c) Spence J. R., Mayhew C. N., Rankin S. A., Kuhar M. F., Vallance J. E., Tolle K., Hoskins E. E., Kalinichenko V. V., Wells S. I., Zorn A. M., Shroyer N. F., Wells J. M., Nature 2011, 470, 105. - PMC - PubMed

Publication types

LinkOut - more resources