

Adaptation of Ocular Opponency Neurons Mediates Attention-Induced Ocular Dominance Plasticity
- PMID: 37635196
- PMCID: PMC10912405
- DOI: 10.1007/s12264-023-01103-z
Adaptation of Ocular Opponency Neurons Mediates Attention-Induced Ocular Dominance Plasticity
Abstract
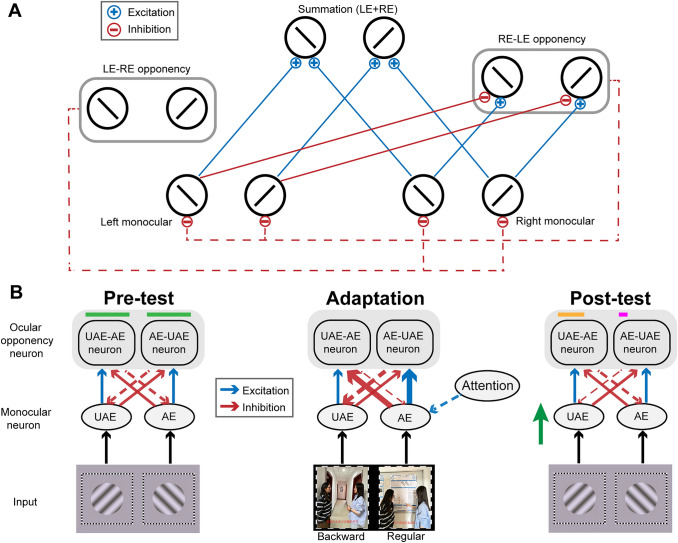
Previous research has shown that ocular dominance can be biased by prolonged attention to one eye. The ocular-opponency-neuron model of binocular rivalry has been proposed as a candidate account for this phenomenon. Yet direct neural evidence is still lacking. By manipulating the contrast of dichoptic testing gratings, here we measured the steady-state visually evoked potentials (SSVEPs) at the intermodulation frequencies to selectively track the activities of ocular-opponency-neurons before and after the "dichoptic-backward-movie" adaptation. One hour of adaptation caused a shift of perceptual and neural ocular dominance towards the unattended eye. More importantly, we found a decrease in the intermodulation SSVEP response after adaptation, which was significantly greater when high-contrast gratings were presented to the attended eye than when they were presented to the unattended eye. These results strongly support the view that the adaptation of ocular-opponency-neurons contributes to the ocular dominance plasticity induced by prolonged eye-based attention.
Keywords: Adaptation; Attention; Ocular dominance; Opponency neuron; Steady-state visually evoked potential.
© 2023. Center for Excellence in Brain Science and Intelligence Technology, Chinese Academy of Sciences.
Conflict of interest statement
The authors claim that there are no conflicts of interest.
Figures


Similar articles
-
Negligible contribution of adaptation of ocular opponency neurons to the effect of short-term monocular deprivation.Front Psychol. 2024 Jan 11;14:1282113. doi: 10.3389/fpsyg.2023.1282113. eCollection 2023. Front Psychol. 2024. PMID: 38274682 Free PMC article.
-
Attention enhances short-term monocular deprivation effect.Psych J. 2025 Feb;14(1):84-93. doi: 10.1002/pchj.806. Epub 2024 Oct 13. Psych J. 2025. PMID: 39396922 Free PMC article.
-
The role of eye-specific attention in ocular dominance plasticity.Cereb Cortex. 2023 Feb 7;33(4):983-996. doi: 10.1093/cercor/bhac116. Cereb Cortex. 2023. PMID: 35332915 Free PMC article.
-
Causal role of the frontal eye field in attention-induced ocular dominance plasticity.Elife. 2024 Mar 13;12:RP93213. doi: 10.7554/eLife.93213. Elife. 2024. PMID: 38478405 Free PMC article.
-
A role for ocular dominance in binocular integration.Curr Biol. 2023 Sep 25;33(18):3884-3895.e5. doi: 10.1016/j.cub.2023.08.019. Epub 2023 Aug 31. Curr Biol. 2023. PMID: 37657450 Free PMC article.
Cited by
-
Negligible contribution of adaptation of ocular opponency neurons to the effect of short-term monocular deprivation.Front Psychol. 2024 Jan 11;14:1282113. doi: 10.3389/fpsyg.2023.1282113. eCollection 2023. Front Psychol. 2024. PMID: 38274682 Free PMC article.
-
Ocular Dominance Plasticity: A Mini-Review.Eye Brain. 2025 Jun 10;17:37-48. doi: 10.2147/EB.S532627. eCollection 2025. Eye Brain. 2025. PMID: 40519698 Free PMC article. Review.
-
Attention enhances short-term monocular deprivation effect.Psych J. 2025 Feb;14(1):84-93. doi: 10.1002/pchj.806. Epub 2024 Oct 13. Psych J. 2025. PMID: 39396922 Free PMC article.
-
An anti-Hebbian model for binocular visual plasticity and its attentional modulation.Commun Biol. 2025 Mar 12;8(1):418. doi: 10.1038/s42003-025-07833-2. Commun Biol. 2025. PMID: 40075123 Free PMC article.
References
-
- Treisman AM. Strategies and models of selective attention. Psychol Rev. 1969;76:282–299. - PubMed
-
- Wolfe JM, Cave KR, Franzel SL. Guided search: An alternative to the feature integration model for visual search. J Exp Psychol Hum Percept Perform. 1989;15:419–433. - PubMed
-
- Corbetta M, Miezin FM, Dobmeyer S, Shulman GL, Petersen SE. Attentional modulation of neural processing of shape, color, and velocity in humans. Science. 1990;248:1556–1559. - PubMed
-
- He X, Liu W, Qin N, Lyu L, Dong X, Bao M. Performance-dependent reward hurts performance: The non-monotonic attentional load modulation on task-irrelevant distractor processing. Psychophysiology. 2021;58:e13920. - PubMed
-
- Mangun GR. Neural mechanisms of visual selective attention. Psychophysiology. 1995;32:4–18. - PubMed
MeSH terms
LinkOut - more resources
Full Text Sources
