

The relationship of tongue fat content and efficacy of uvulopalatopharyngoplasty in Chinese patients with obstructive sleep apnea
- PMID: 37635206
- PMCID: PMC10463434
- DOI: 10.1186/s12893-023-02144-x
The relationship of tongue fat content and efficacy of uvulopalatopharyngoplasty in Chinese patients with obstructive sleep apnea
Abstract
Background: To investigate the relationship between tongue fat content and severity of obstructive sleep apnea (OSA) and its effects on the efficacy of uvulopalatopharyngoplasty (UPPP) in the Chinese group.
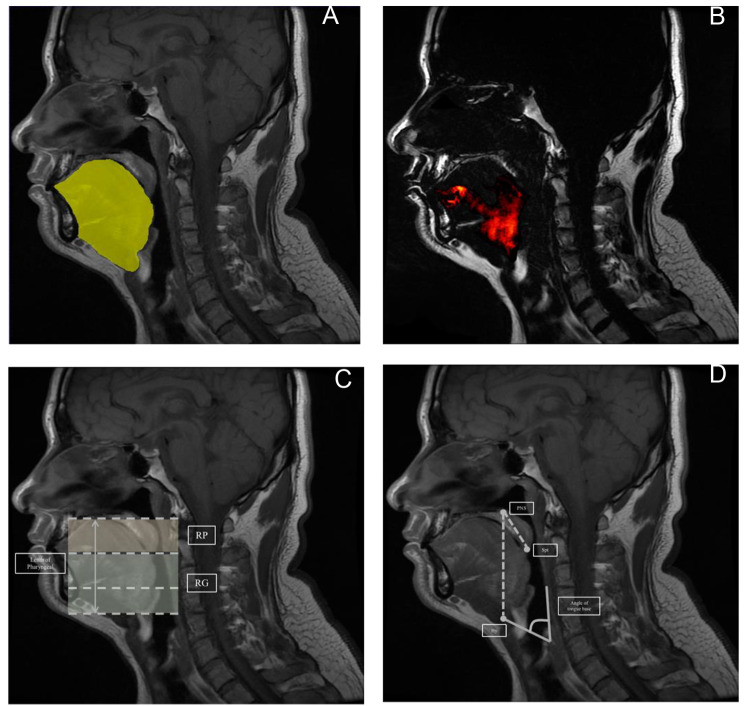
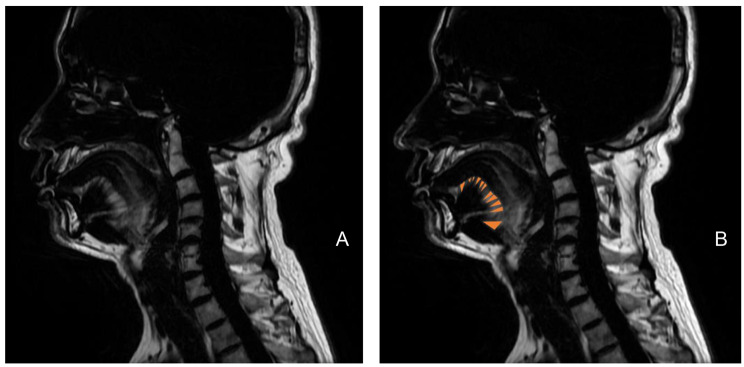
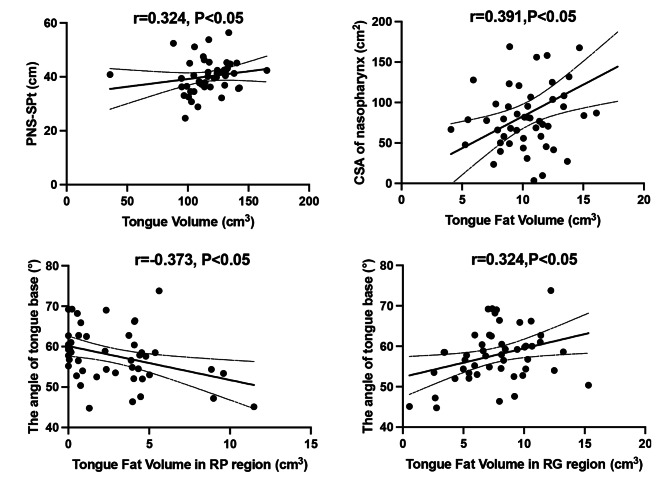
Method: Fifty-two participants concluded to this study were diagnosed as OSA by performing polysomnography (PSG) then they were divided into moderate group and severe group according to apnea hypopnea index (AHI). All of them were also collected a series of data including age, BMI, height, weight, neck circumference, abdominal circumference, magnetic resonance imaging (MRI) of upper airway and the score of Epworth Sleepiness Scale (ESS) on the morning after they completed PSG. The relationship between tongue fat content and severity of OSA as well as the association between tongue fat content in pre-operation and surgical efficacy were analyzed.Participants underwent UPPP and followed up at 3rd month after surgery, and they were divided into two groups according to the surgical efficacy.
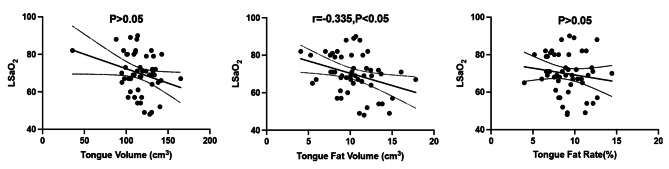
Results: There were 7 patients in the moderate OSA group and 45 patients in the severe OSA group. The tongue volume was significantly larger in the severe OSA group than that in the moderate OSA group. There was no difference in tongue fat volume and tongue fat rate between the two groups. There was no association among tongue fat content, AHI, obstructive apnea hypopnea index, obstructive apnea index and Epworth sleepiness scale (all P > 0.05), but tongue fat content was related to the lowest oxygen saturation (r=-0.335, P < 0.05). There was no significantly difference in pre-operative tongue fat content in two different surgical efficacy groups.
Conclusions: This study didn't show an association between tongue fat content and the severity of OSA in the Chinese group, but it suggested a negative correlation between tongue fat content and the lowest oxygen saturation (LSaO2). Tongue fat content didn't influence surgical efficacy of UPPP in Chinese OSA patients.
Trial registration: This study didn't report on a clinical trial, it was retrospectively registered.
Keywords: Magnetic resonance imaging; Obstructive sleep apnea; Tongue fat; Upper airway; Uvulopalatopharyngoplasty.
© 2023. BioMed Central Ltd., part of Springer Nature.
Conflict of interest statement
The authors declare no competing interests.
Figures
Similar articles
-
Effect of Multilevel Upper Airway Surgery vs Medical Management on the Apnea-Hypopnea Index and Patient-Reported Daytime Sleepiness Among Patients With Moderate or Severe Obstructive Sleep Apnea: The SAMS Randomized Clinical Trial.JAMA. 2020 Sep 22;324(12):1168-1179. doi: 10.1001/jama.2020.14265. JAMA. 2020. PMID: 32886102 Free PMC article. Clinical Trial.
-
Volumetric magnetic resonance imaging analysis of multilevel upper airway surgery effects on pharyngeal structure.Sleep. 2021 Dec 10;44(12):zsab183. doi: 10.1093/sleep/zsab183. Sleep. 2021. PMID: 34283220 Free PMC article. Clinical Trial.
-
Tongue-base suspension in conjunction with uvulopalatopharyngoplasty for treatment of severe obstructive sleep apnea: long-term follow-up results.Laryngoscope. 2006 Jul;116(7):1223-7. doi: 10.1097/01.mlg.0000224498.09015.d9. Laryngoscope. 2006. PMID: 16826064
-
Uvulopalatopharyngoplasty with or without tonsillectomy in the treatment of adult obstructive sleep apnea - A systematic review.Sleep Med. 2018 Oct;50:152-165. doi: 10.1016/j.sleep.2018.05.004. Epub 2018 May 12. Sleep Med. 2018. PMID: 30056286
-
Continuous Positive Airway Pressure vs Mandibular Advancement Devices in the Treatment of Obstructive Sleep Apnea: An Updated Systematic Review and Meta-Analysis.Cureus. 2022 Jan 31;14(1):e21759. doi: 10.7759/cureus.21759. eCollection 2022 Jan. Cureus. 2022. PMID: 35251830 Free PMC article. Review.
Cited by
-
Symptom and comorbidity burden in hypertensive patients with obstructive sleep apnea.Front Endocrinol (Lausanne). 2024 Mar 4;15:1361466. doi: 10.3389/fendo.2024.1361466. eCollection 2024. Front Endocrinol (Lausanne). 2024. PMID: 38501097 Free PMC article.
References
Publication types
MeSH terms
Grants and funding
LinkOut - more resources
Full Text Sources
Miscellaneous
