. 2023 Aug 28;18(1):52.
doi: 10.1186/s13062-023-00408-3.

Opening of Cx43-formed hemichannels mediates the Ca2+ signaling associated with endothelial cell migration

Affiliations

Opening of Cx43-formed hemichannels mediates the Ca2+ signaling associated with endothelial cell migration

Hilda Espinoza et al. Biol Direct. .

Abstract

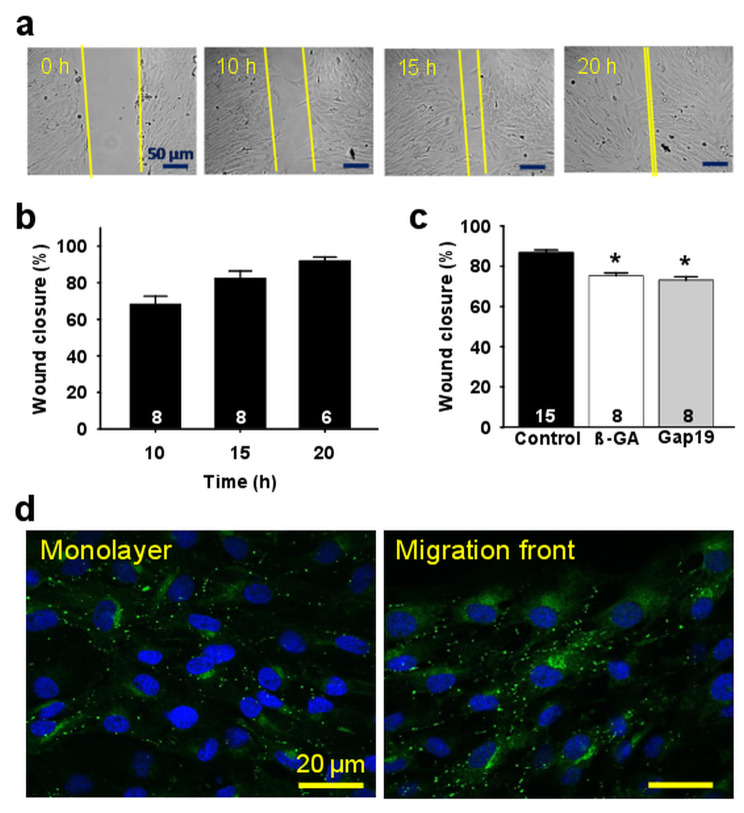
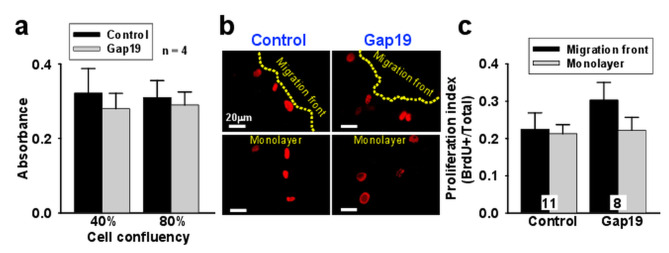
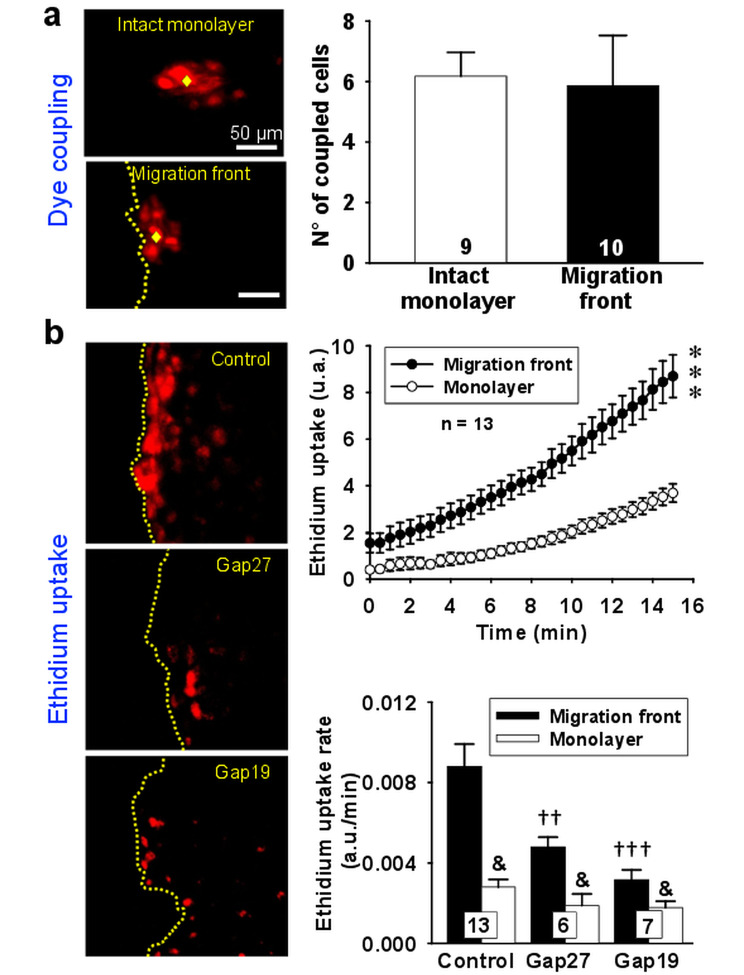
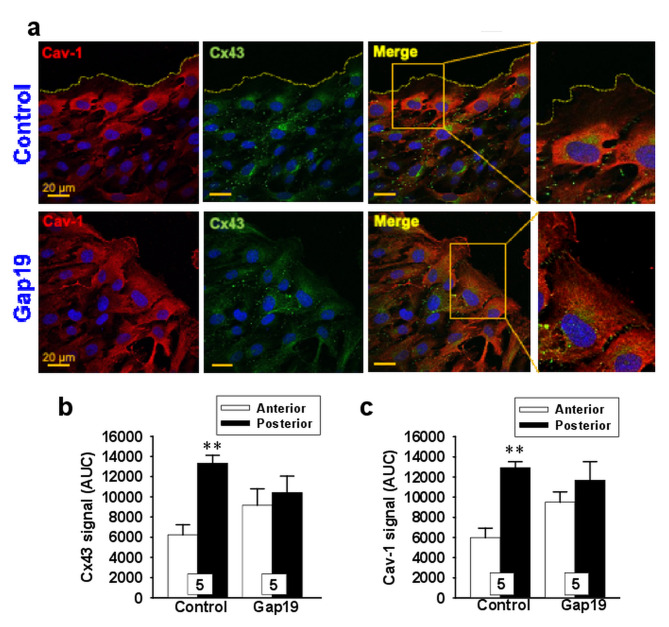
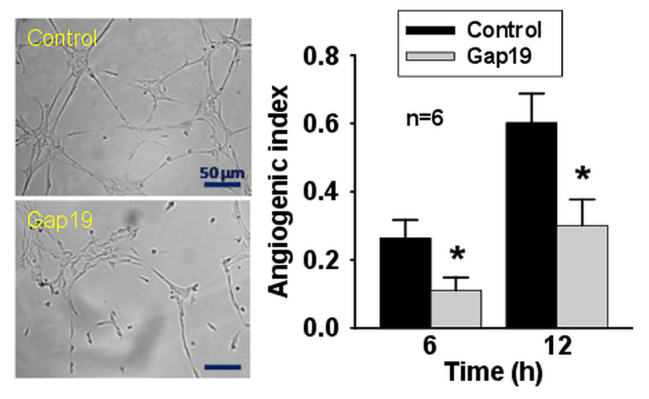
Endothelial cell migration is a key process in angiogenesis. Progress of endothelial cell migration is orchestrated by coordinated generation of Ca2+ signals through a mechanism organized in caveolar microdomains. Connexins (Cx) play a central role in coordination of endothelial cell function, directly by cell-to-cell communication via gap junction and, indirectly, by the release of autocrine/paracrine signals through Cx-formed hemichannels. However, Cx hemichannels are also permeable to Ca2+ and Cx43 can be associated with caveolin-1, a structural protein of caveolae. We proposed that endothelial cell migration relies on Cx43 hemichannel opening. Here we show a novel mechanism of Ca2+ signaling in endothelial cell migration. The Ca2+ signaling that mediates endothelial cell migration and the subsequent tubular structure formation depended on Cx43 hemichannel opening and is associated with the translocation of Cx43 with caveolae to the rear part of the cells. These findings indicate that Cx43 hemichannels play a central role in endothelial cell migration and provide new therapeutic targets for the control of deregulated angiogenesis in pathological conditions such as cancer.

Keywords: Angiogenesis; Ca2+ signaling; Connexin hemichannels; Endothelial cells; Migration.


Conflict of interest statement

The authors have no relevant financial or non-financial interests to disclose.

Figures

Fig. 1
Fig. 1
Cx43 hemichannels are involved in endothelial cell migration. a, Representative images of the endothelial cell migration observed in the wound-healing assay in control conditions. Primary cultures of mesenteric endothelial cells were prepared for wound-healing assay and cell migration was analyzed at 0, 10, 15 or 20 h after scratching the monolayer. Yellow lines are only intended to highlight the migration front and are not a reference for migration analysis. b, Quantitative analysis of the endothelial cells movement in control conditions into the cell-free scratched area at different time points (10, 15 and 20 h). c, Quantitative analysis of the endothelial cell migration observed before (Control) and after the treatment with 50 µM 18-ß-Glycyrrhetenic acid (ß-GA), a general Cx-formed channel inhibitor, or 300 µM TAT-Gap19 (Gap19), a specific Cx43 hemichannel blocking peptide. d, Representative images of immunofluorescence analysis of Cx43 expression in primary cultures of mesenteric endothelial cells in control conditions (monolayer) and in the migration front 4 h after scratching the monolayer. Cell nuclei are highlighted by the staining with DAPI (blue). Numbers inside the bars indicate the n value. Values are means ± SEM. *, P < 0.05 vs. Control by one-way ANOVA plus Bonferroni post hoc test
Fig. 2
Fig. 2
Cx43 hemichannels are not involved in endothelial cell proliferation. a, Analysis of endothelial cell proliferation by the bromodeoxyuridine (BrdU) incorporation assay in control conditions and after the treatment with the Cx43 hemichannel blocking peptide TAT-Gap19 (Gap19, 300 µM). Cell proliferation was evaluated in primary cultures of mesenteric endothelial cells at 40% or at 80% of confluence. b, Representative images of the immunofluorescence detection of BrdU incorporation into endothelial cells of the migration front and the monolayer in control conditions or in the presence of Gap19. c, Fluorescence intensity analysis of the experiments shown in b. BrdU+ denotes endothelial cells positive for BrdU. Numbers inside the bars indicate the n value. Values are means ± SEM
Fig. 3
Fig. 3
Cx43-formed hemichannels, but not gap junction channels, are associated with endothelial cell migration. a, Representative images of dye coupling assay (left) and the analysis of the number of coupled cells via gap junction communication (right) attained in the intact monolayer and in the migration front after scratching the monolayer. Dye coupling was assessed by measuring after 2 min the diffusion to neighboring cells (coupled cells) of the ethidium bromide microinjected into a single endothelial cell. The yellow diamond indicates the microinjected cell. b, Representative images of the ethidium uptake observed in primary cultures of mesenteric endothelial cells in control conditions and in the presence of the Cx blocking peptide 37,43Gap27 (200 µM) or the Cx43 hemichannel inhibitor TAT-Gap19 (Gap19, 300 µM) (left). Ethidium uptake was evaluated 15 min after scratching the monolayer and cells were incubated with the dye for 15 min, as shown in the time course of ethidium uptake observed in the intact monolayer and in the migration front (b, right top). Dot yellow lines depict the edge of the migration front. In addition, the analysis of the ethidium uptake rate achieved in the intact monolayer and in the migration front in control conditions and in the presence of 37,43Gap27 or Gap19 is also shown (b, right bottom). The rate of ethidium uptake was assessed by calculating the slope of the increase in fluorescence intensity along the time. Changes in ethidium-fluorescence signal are expressed in arbitrary units (a.u.). Numbers inside the bars indicate the n value. Values are means ± SEM. ***, P < 0.001 vs. Monolayer by two-way ANOVA. ††, P < 0.01 and †††, P < 0.001 vs. Migration front in control conditions (Control) by one-way ANOVA plus Bonferroni post hoc test. &, P < 0.001 vs. Migration front by paired Student’s t-test
Fig. 4
Fig. 4
Endothelial cell migration depends on a Cx43-formed channel-mediated increase in intracellular Ca2+ concentration ([Ca2+]i). a, Representative images (left) and fluorescence intensity analysis (right) of the increase in [Ca2+]i observed in endothelial cells of the migration front 15 min after scratching the monolayer in control conditions and in the presence of 50 µM 18-β-Glycyrrhetenic acid (ß-GA), a general Cx-formed channel blocker, or 200 µM 37,43Gap27, a peptide designed to block channels formed by Cx37 or Cx43. Variations in the levels of [Ca2+]i were assessed with the fluorescent Ca2+ indicator Fluo-4. b, Representative images of the changes in [Ca2+]i of endothelial cells (left) in which the differences in the subcellular distribution of the Ca2+ signal attained in a cell of the migration front (Cell 2) and a cell within the monolayer (Cell 1) are highlighted in a 3D analysis (middle and right). c, Fluorescence intensity analysis of the Fluo-4 signal measured along the endothelial cells length (from back to front) in the migration front and the monolayer. d, Analysis of the changes in [Ca2+]i levels attained in the rear and anterior edge of endothelial cells of the migration front in control conditions and after the treatment with ß-GA or 37,43Gap27. Changes in Fluo-4 signal are expressed as the area under the curve (AUC). Note that cells were treated with the Cx blocking peptide 37,43Gap27 for only 10 min to inhibit Cx hemichannels, without affecting gap junction channels. Dot red lines depict the edge of the migration front. Numbers inside the bars or in parentheses indicate the n value. Values are means ± SEM. ***, P < 0.001 vs. Control by one-way ANOVA plus Bonferroni post hoc test. †††, P < 0.001 vs. Anterior by paired Student’s t-test
Fig. 5
Fig. 5
Cx43 hemichannel activation leads to subcellular re-distribution of caveolin-1 (Cav-1) and Cx43 in migrating endothelial cells. a, Immunofluorescence analysis of the subcellular distribution of Cav-1 (red) and Cx43 (green) in control conditions and after the treatment with 300 µM TAT-Gap19 (Gap19), a specific blocker of Cx43 hemichannels. Cell nuclei are highlighted by the staining with DAPI (blue). The square indicatres the area that was enlarged on the right. b and c, Densitometric analysis of Cx43 (b) and Cav-1 (c) signal in the rear and anterior part of endothelial cells of the migration front in control conditions and in the presence of Gap19. Numbers inside the bars indicate the n value. Values are means ± SEM. **, P < 0.01 vs. Anterior by paired Student’s t-test
Fig. 6
Fig. 6
Activation of Cx43-formed hemichannels is involved in the progress of angiogenesis in vitro. Representative images of the formation of tubular-like structures in Matrigel by primary cultures of mesenteric endothelial cells after 12 h in control conditions or in the presence of 300 µM TAT-Gap19 (Gap19), a specific blocker of Cx43 hemichannels (left). In addition, the analysis of the development of tubular-like structure formation by the calculation of the angiogenic index observed after 6 and 12 h in control conditions and in the presence of Gap19 is also shown (right). Values are means ± SEM. *, P < 0.05 vs. Control by unpaired Student’s t-test
Fig. 7
Fig. 7
Activation of Cx43-formed hemichannels in endothelial cells of migration front depends on NO-mediated S-nitrosylation. a, Representative images of ethidium uptake in primary cultures of mesenteric endothelial cells (left) and the analysis of ethidium uptake rate observed in the migration front and in the monolayer in control conditions and after the treatment with 100 µM NG-nitro-L-arginine (L-NA) or 50 µM ascorbic acid (AA). The rate of ethidium uptake was assessed by calculating the slope of the increase in fluorescence intensity along the time. b, Representative images (left) and fluorescence intensity analysis (right) of the increase in [Ca2+]i observed in endothelial cells of the migration front in control conditions and in the presence of 100 µM L-NA or 50 µM AA. Variations in the levels of [Ca2+]i were assessed with the fluorescent Ca2+ indicator Fluo-4. c, Representative images (left) and quantitative analysis (right) of the endothelial cell migration observed in the wound-healing assay just after scratching the monolayer (0 h) and after 15 h in control conditions and in the presence of L-NA or AA. Yellow lines are only intended to highlight the migration front and are not a reference for migration analysis. d, Detection of total protein S-nitrosylation by immunofluorescence (left) and densitometric analysis of the fluorescence intensity (right) observed in the migration front and the monolayer of primary cultures of endothelial cells in control conditions and after the treatment with L-NA or AA. Cell nuclei are highlighted by the staining with DAPI (blue). Numbers inside the bars indicate the n value. Values are means ± SEM. *, P < 0.05 and **, P < 0.01 vs. Control by one-way ANOVA plus Bonferroni post hoc test

Similar articles

Cited by

References

    1. Herbert SP, Stainier DY. Molecular control of endothelial cell behaviour during blood vessel morphogenesis. Nat Rev Mol Cell Biol. 2011;12:551–64. doi: 10.1038/nrm3176. - DOI - PMC - PubMed
    1. Betsholtz C. 2018. medicine10, e8610. - DOI
    1. Carmeliet P. Angiogenesis in health and disease. Nat Med. 2003 doi: 10.1038/nm0603-653. - DOI - PubMed
    1. Lamalice L, Le Boeuf F, Huot J. Endothelial cell migration during angiogenesis. Circ Res100. 2007;782–94. 10.1161/01.RES.0000259593.07661.1e. - PubMed
    1. Moccia F, Negri S, Shekha M, Faris P, Guerra G. Endothelial Ca2+ signaling, angiogenesis and vasculogenesis: just what it takes to make a blood vessel. Int J Mol. 2019;20. 10.3390/ijms20163962. Sci. - PMC - PubMed

Publication types

LinkOut - more resources