. 2023 Dec 1;146(12):5070-5085.
doi: 10.1093/brain/awad249.

Hypomyelination, hypodontia and craniofacial abnormalities in a Polr3b mouse model of leukodystrophy

Affiliations

Hypomyelination, hypodontia and craniofacial abnormalities in a Polr3b mouse model of leukodystrophy

Mackenzie A Michell-Robinson et al. Brain. .

Abstract

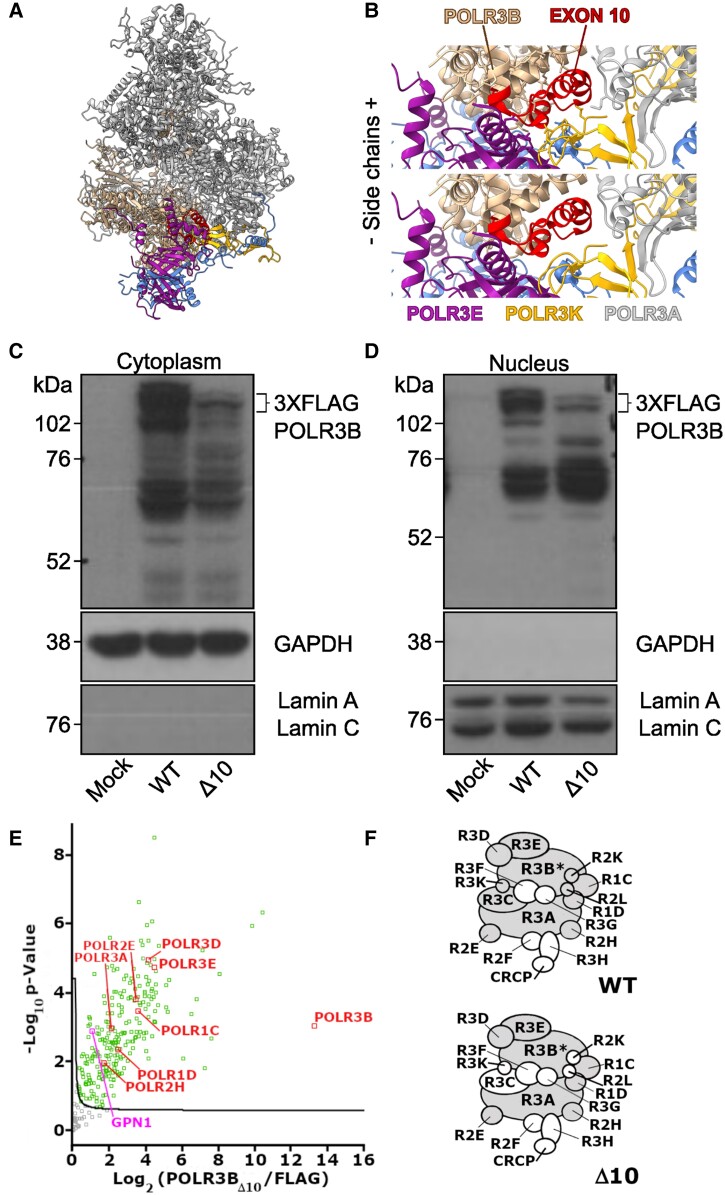
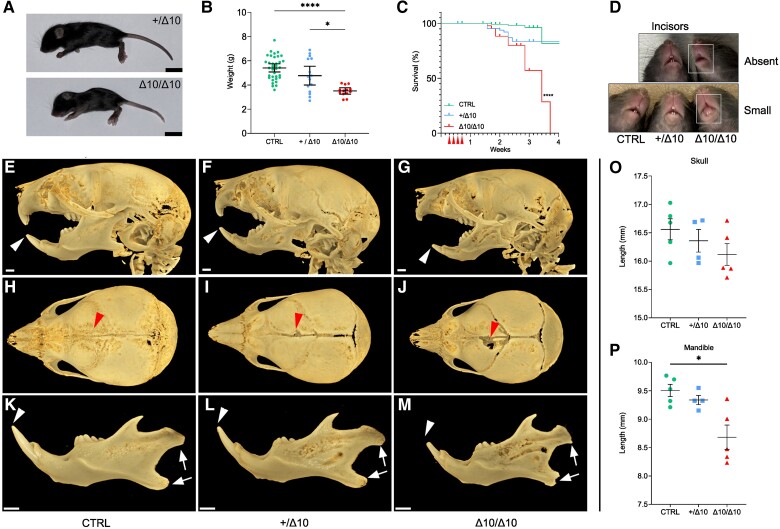
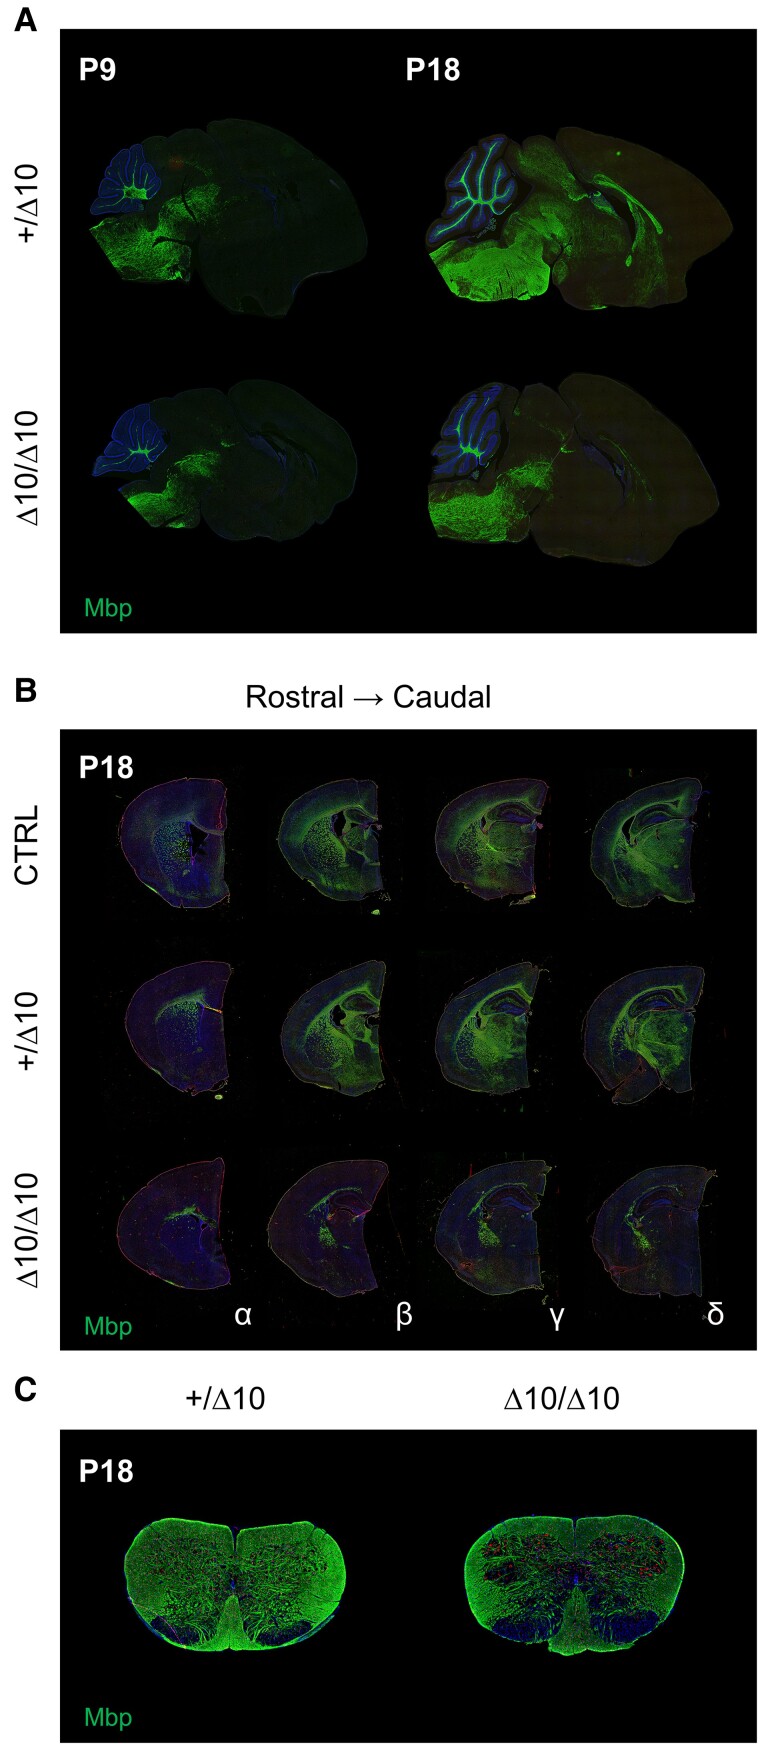
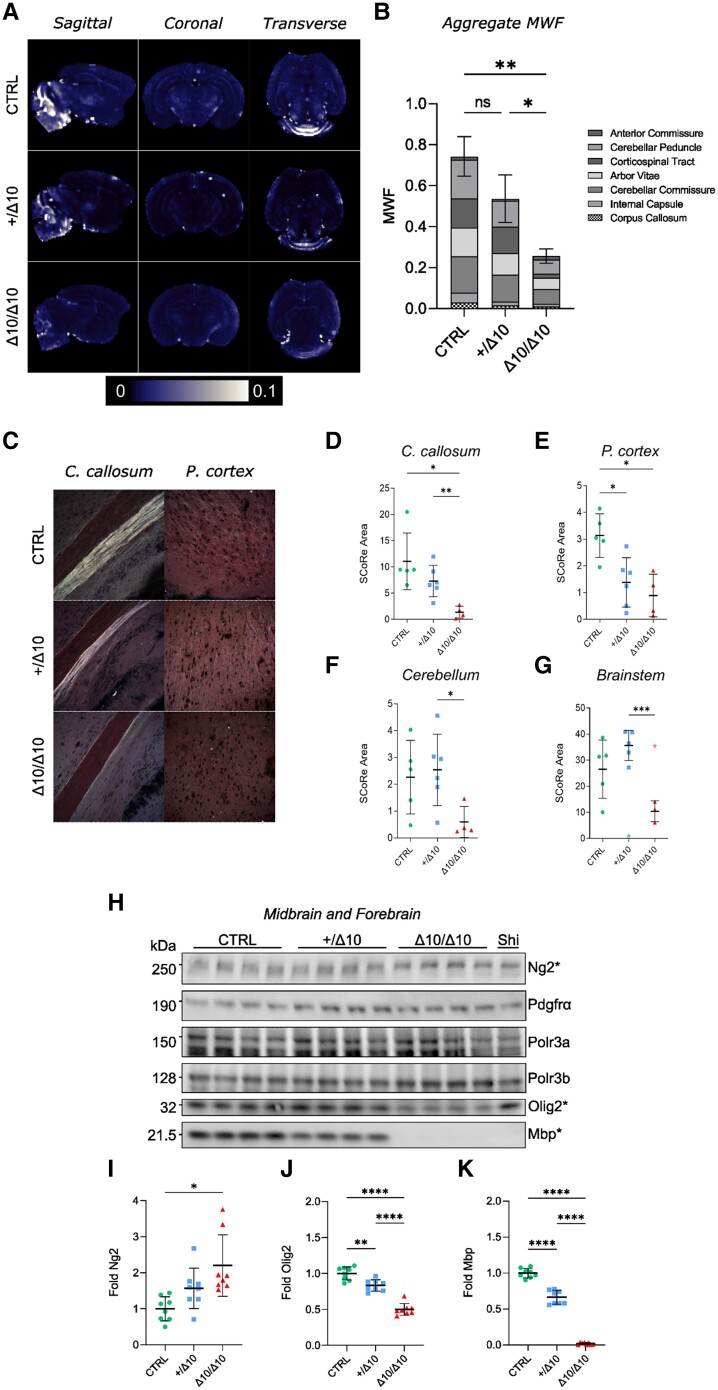
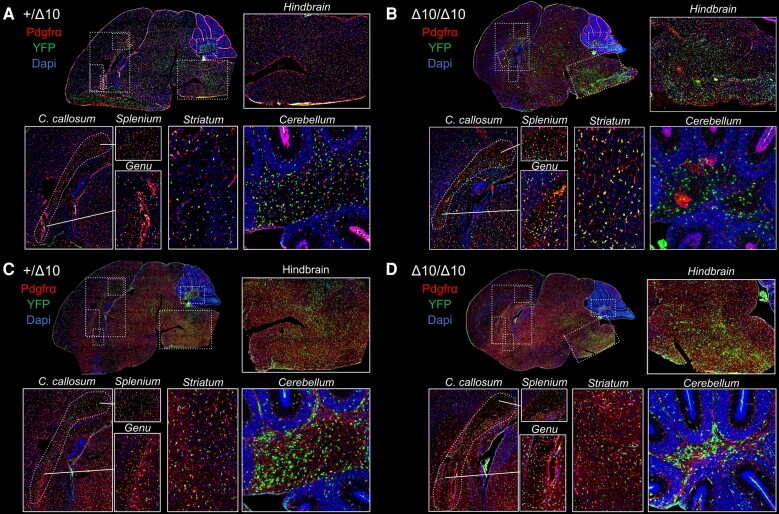
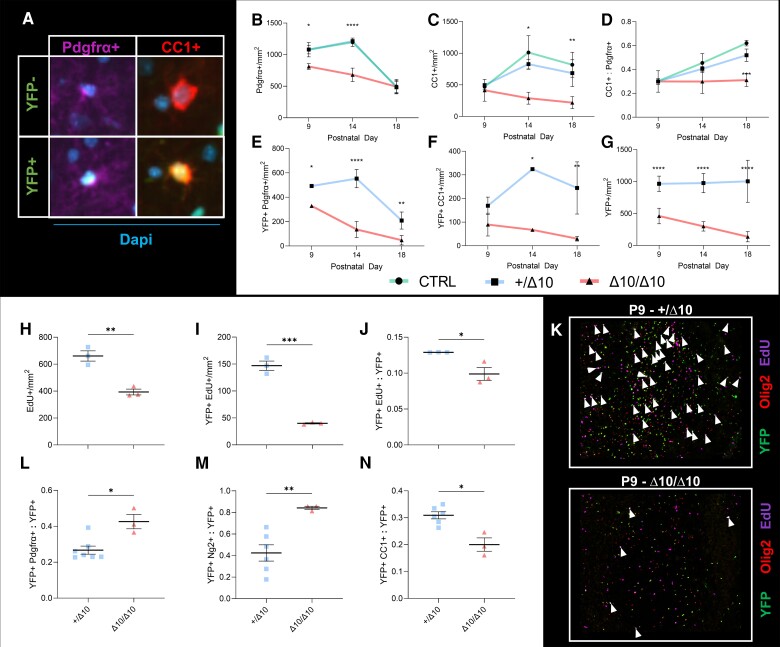
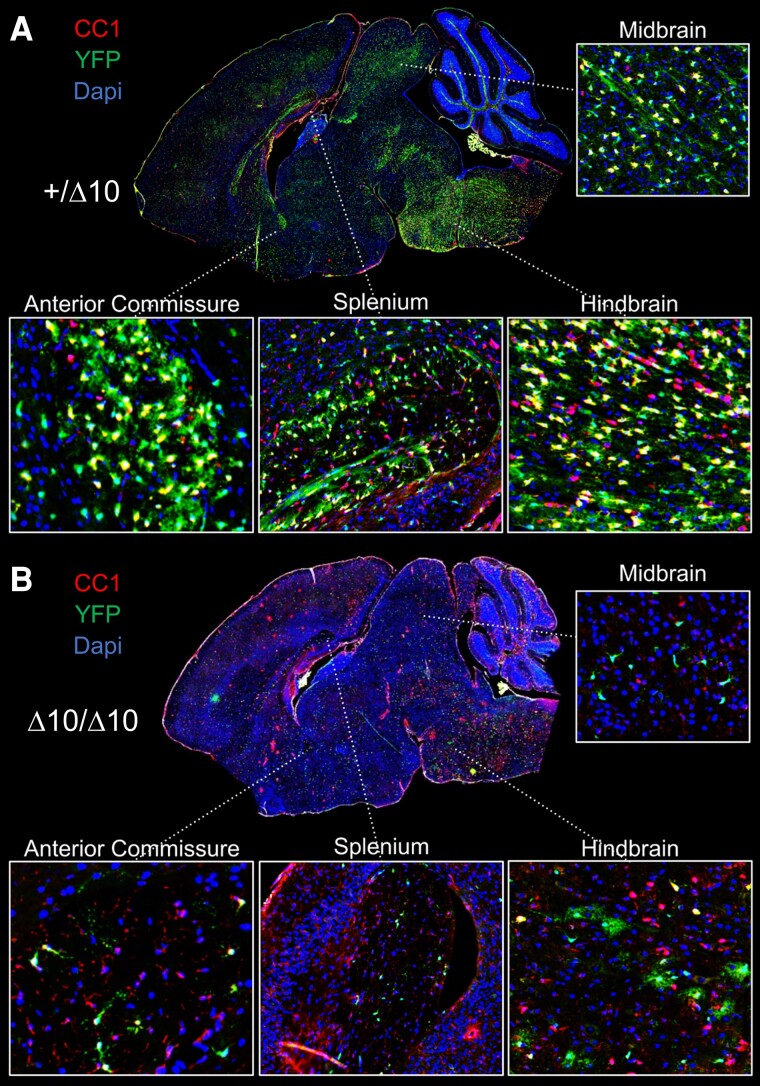
RNA polymerase III (Pol III)-related hypomyelinating leukodystrophy (POLR3-HLD), also known as 4H leukodystrophy, is a severe neurodegenerative disease characterized by the cardinal features of hypomyelination, hypodontia and hypogonadotropic hypogonadism. POLR3-HLD is caused by biallelic pathogenic variants in genes encoding Pol III subunits. While approximately half of all patients carry mutations in POLR3B encoding the RNA polymerase III subunit B, there is no in vivo model of leukodystrophy based on mutation of this Pol III subunit. Here, we determined the impact of POLR3BΔ10 (Δ10) on Pol III in human cells and developed and characterized an inducible/conditional mouse model of leukodystrophy using the orthologous Δ10 mutation in mice. The molecular mechanism of Pol III dysfunction was determined in human cells by affinity purification-mass spectrometry and western blot. Postnatal induction with tamoxifen induced expression of the orthologous Δ10 hypomorph in triple transgenic Pdgfrα-Cre/ERT; R26-Stopfl-EYFP; Polr3bfl mice. CNS and non-CNS features were characterized using a variety of techniques including microCT, ex vivo MRI, immunofluorescence, immunohistochemistry, spectral confocal reflectance microscopy and western blot. Lineage tracing and time series analysis of oligodendrocyte subpopulation dynamics based on co-labelling with lineage-specific and/or proliferation markers were performed. Proteomics suggested that Δ10 causes a Pol III assembly defect, while western blots demonstrated reduced POLR3BΔ10 expression in the cytoplasm and nucleus in human cells. In mice, postnatal Pdgfrα-dependent expression of the orthologous murine mutant protein resulted in recessive phenotypes including severe hypomyelination leading to ataxia, tremor, seizures and limited survival, as well as hypodontia and craniofacial abnormalities. Hypomyelination was confirmed and characterized using classic methods to quantify myelin components such as myelin basic protein and lipids, results which agreed with those produced using modern methods to quantify myelin based on the physical properties of myelin membranes. Lineage tracing uncovered the underlying mechanism for the hypomyelinating phenotype: defective oligodendrocyte precursor proliferation and differentiation resulted in a failure to produce an adequate number of mature oligodendrocytes during postnatal myelinogenesis. In summary, we characterized the Polr3bΔ10 mutation and developed an animal model that recapitulates features of POLR3-HLD caused by POLR3B mutations, shedding light on disease pathogenesis, and opening the door to the development of therapeutic interventions.

Keywords: 4H leukodystrophy; POLR3-related leukodystrophy; POLR3B; mouse model; myelinogenesis; neurodevelopment.


Conflict of interest statement

G.B. was a consultant for Passage Bio Inc (2020-2022) and Ionis (2019). She is/was a site investigator for the Alexander’s disease trial of Ionis (2021–present), Metachromatic leukodystrophy of Shire/Takeda (2020–2021), Krabbe and GM1 gene therapy trials of Passage Bio (2021–present), GM1 natural history study from the University of Pennsylvania sponsored by Passage Bio (2021–present) and Adrenoleukodystrophy/Hematopoietic stem cell transplantation natural history study of Bluebird Bio (2019), a site sub-investigator for the MPS II gene therapy trial of Regenxbio (2021–present) and the MPS II clinical trial of Denali (2022–present). She has received unrestricted educational grants from Takeda (2021–2022). The other authors have no competing interests.

Figures

Figure 1
Figure 1
POLR3B exon 10 deletion impairs Pol III assembly or stability in human cells. (A) Human Apo Pol III structural model. (B) Human Apo Pol III rotated and zoomed with POLR3B exon 10 highlighted in red and nearby subunits labelled including heterodimer subunit POLR3E, POLR3K and POLR3A (jaw). (C) Representative anti-FLAG western blot of cytoplasmic extract from HEK293T cells transiently transfected with p3XFLAG (mock), wild-type POLR3B-FLAG (WT) or POLR3BΔ10-FLAG (Δ10) for 24 h. Loading controls for the cytoplasmic (GAPDH) and nuclear (Lamin A, C) fractions are shown. (D) Representative anti-FLAG western blot of nuclear extract from HEK293T cells transiently transfected with p3XFLAG (mock), wild-type POLR3B-FLAG (WT) or POLR3BΔ10-FLAG (Δ10) for 24 h. Loading controls for the cytoplasmic (GAPDH) and nuclear (Lamin A, C) fractions are shown. (E) Volcano plot illustrating the log2-transformed average label-free quantification (LFQ)-intensity difference between the Δ10 mutant against the FLAG expressing control (x-axis). The significantly different Pol III subunits are marked in red and the significantly different GPN cofactors in pink. Other proteins marked in green are considered significantly different. (F) Schematic representation showing significantly different subunits evaluated by AP-MS. Wild-type data from Djordjevic et al. were used to show expected Pol III subunits. Subunits that are significantly increased compared to their FLAG control are marked in grey. Subunits that are not detected or not significantly different from the FLAG control are marked in white. *The subunit used as bait.
Figure 2
Figure 2
Δ10 homozygous mice have reduced size and survival, as well as abnormal craniofacial development. (A) Representative size difference between +/Δ10 (top) and Δ10/Δ10 (bottom) littermates (Scale bar = 1 cm). (B) Weight of transgenic mice at the P21 end point where each point represents an individual mouse weight, including n = 13 Δ10/Δ10, n = 15 +/Δ10 and n = 35 CTRL mice. (C) Kaplan-Meier plot of survival of Δ10/Δ10 (n = 43) versus +/Δ10 (n = 72) and CTRL (n = 116). Median survival in Δ10/Δ10 was 24 days. Comparison of the survival curves and statistical significance were evaluated by Log-rank (Mantel-Cox) test (P < 0.0001). (D) Top: representative image of littermates where the Δ10/Δ10 (right) has apparent absence of incisors at P21. Bottom: representative image of three littermates where the Δ10/Δ10 (right) has small incisors at P21. (EM) MicroCT analysis of Δ10/Δ10 mice at P18 demonstrated dental and craniofacial anomalies. (EG) Lateral views demonstrate hypoplastic incisors (white arrowheads) and mandibles in Δ10/Δ10. (HJ) Dorsal views show deficiencies in the frontal bone (red arrowheads) in Δ10/Δ10 mice relative to +/Δ10 and CTRL. The skull length tends to be shorter in homozygous mice relative to controls (see O, below), but the differences were not statistically significant. (KM) Isolated mandibles demonstrate general hypoplasia and an abnormal condylar head and mandibular angle shape (white arrows). (O and P) The incisors (white arrowheads) are small, and the length of the mandible is significantly shorter in homozygous mutants relative to controls. (O) Quantification of skull length, with biological replicates plotted as individual points. (P) Quantification of mandible length, with biological replicates plotted as individual points. The P-values in the plots in O and P were determined using Brown-Forsythe and Welch one-way ANOVA followed by multiple comparisons testing using the Dunnett T3 method with α = 0.05. Scale bar = 1 mm. *P < 0.05, **P < 0.01, ***P < 0.001, ****P < 0.0001. POLR3B-HLD = RNA polymerase III subunit B-related hypomyelinating leukodystrophy; Δ10/Δ10 = tamoxifen-treated transgenic mice carrying a Pdgfrα-CreERT allele and homozygous Polr3bfl alleles; +/Δ10 = tamoxifen-treated transgenic mice carrying a Pdgfrα-CreERT allele and heterozygous Polr3bfl alleles; CTRL = tamoxifen-treated transgenic mice carrying no Pdgfrα-CreERT allele(s).
Figure 3
Figure 3
Midbrain and forebrain myelinogenesis is interrupted between P9 and P18 in Δ10 homozygous mice. (A) Mbp expression (green) in parasagittal sections from +/Δ10 (top) and Δ10/Δ10 (bottom) demonstrate interruption of myelinogenesis in the midbrain and forebrain between P9 and P18 in Δ10/Δ10. (B) Mbp expression (green) in hemicoronal sections from CTRL, +/Δ10 (left) and Δ10/Δ10 at P18. Four levels of sections (alpha, beta, gamma, delta) were cut from hemi-coronal blocks in order to assess Mbp expression via immunofluorescence. These four levels of sections correspond to the quantification found in Supplementary Fig. 3B. (C) Mbp expression in the cervical spinal cord at P18 demonstrates a relative reduction in ventral cord myelination between +/Δ10 (left) and Δ10/Δ10 (right). Reduced grey matter Mbp expression is also apparent in Δ10/Δ10. POLR3B-HLD = RNA polymerase III subunit B-related hypomyelinating leukodystrophy; Δ10/Δ10 = tamoxifen-treated transgenic mice carrying a Pdgfrα-CreERT allele and homozygous Polr3bfl alleles; +/Δ10 = tamoxifen-treated transgenic mice carrying a Pdgfrα-CreERT allele and heterozygous Polr3bfl alleles; CTRL = tamoxifen-treated transgenic mice carrying no Pdgfrα-CreERT allele(s); Mbp = myelin basic protein; Olig2 = oligodendrocyte transcription factor 2.
Figure 4
Figure 4
Quantifying hypomyelination in Δ10 homozygous mice. Hypomyelination was quantified using ex vivo MRI (A and B), spectral confocal reflectance (SCoRe) microscopy (CG), and western blot at peak myelination in mice (HK). (A) Myelin water fraction (MWF) maps from Δ10/Δ10, +/Δ10 and CTRL mice in sagittal, coronal and transverse views. (B) Summed aggregate MWF values from each region of interest (ROI) in Δ10/Δ10, +/Δ10 and CTRL mice (anterior commissure, cerebellar peduncle, corticospinal tract, arbor vitae, cerebellar commissure, internal capsule, corpus callosum). Error bars reflect standard deviation (SD). Statistical comparison of the Δ10/Δ10 and +/Δ10 was evaluated in the context of a Brown-Forsythe and Welch one-way ANOVA including Δ10/Δ10, +/Δ10, CTRL and tamoxifen-naïve mice. Details can be found in the Supplementary material. (C) Spectral confocal reflectance (SCoRe) microscopy was used to assess label-free sections from Δ10/Δ10 (n = 4), +/Δ10 (n = 6) and CTRL (n = 5) littermates for myelin content at P18. Representative images of the corpus callosum and superficial prefrontal cortex are shown. We quantified myelination as SCoRe area and compared Δ10/Δ10 to +/Δ10 in (D) corpus callosum [−81.2%; Dunnett's T3: μ/Δ10 = 1.374; μhtz = 7.304; t = 4.388; df = 6.843; μΔ = 5.930; 95% confidence interval (CI95): 1.801–10.06; P = 0.0089], (E) cortex (−35.6%; Dunnett's T3: μ/Δ10 = 0.8910; μhtz = 1.383; t = 0.8958; df = 7.269; μΔ = 0.4920; CI95: −1.186–2.170; P = 0.7562), (F) cerebellum (−76.5%; Dunnett's T3: μ/Δ10 = 0.5988; μhtz = 1.945; t = 3.157; df = 7.267; μΔ = 1.945; CI95: 0.06251–3.827; P = 0.0435) and (G) brainstem (−70.8%; Dunnett's T3: μ/Δ10 = 10.41; μhtz = 35.65; t = 7.288; df = 5.659; μΔ = 25.24; CI95: 14.19–36.30; P = 0.0009). Mean and standard error are shown. (H) Representative western blots from 15 µg brain lysate samples prepared at P21 where the medulla, pons and cerebellum were removed during dissection. There were no significant differences in Pdgfrα, Polr3a or Polr3b protein expression between genotypes. (I) Ng2 expression tended to be higher in Δ10/Δ10s than CTRLs but was not differentiated from +/Δ10s. When comparing Δ10/Δ10s to +/Δ10s, (J) Olig2 was reduced by 40.2% (Dunnett's T3: μ/Δ10 = 0.4990; μhtz = 0.8338; t = 8.217; df = 14.00; μΔ = 0.3348; CI95: 0.2252–0.4445; P < 0.0001) and (K) Mbp was reduced by 97.3% (Dunnett's T3: μ/Δ10 = 0.01785; μhtz = 0.6634; t = 18.83; df = 7.313; μΔ = 0.6455; CI95: 0.5408–0.7502; P < 0.0001). Four male and four female mice (n = 8) of each group listed were used in all western blot studies. Mean and standard deviation are indicated. Except for the MRI quantification detailed above, all statistics were computed using Brown-Forsythe and Welch's one-way ANOVA with multiple comparisons tested using Dunnett's T3 method and α = 0.05. *P < 0.05, **P < 0.01, ***P < 0.001, ****P < 0.0001. Δ10/Δ10 = tamoxifen-treated transgenic mice carrying a Pdgfrα-CreERT allele and homozygous Polr3bfl alleles; +/Δ10 = tamoxifen-treated transgenic mice carrying a Pdgfrα-CreERT allele and heterozygous Polr3bfl alleles; CTRL = tamoxifen-treated transgenic mice carrying no Pdgfrα-CreERT allele(s); Shi = Shiverer; C. callosum = corpus callosum; P. cortex = prefrontal cortex; Ng2 = Neuron-glial antigen 2 (encoded by Cspg4); Pdgfrα = Platelet-derived growth factor receptor alpha.
Figure 5
Figure 5
Oligodendrocyte subpopulations appear stable at P9 in Δ10 homozygous mice. We probed for Pdgfrα (A and B) and Ng2 (C and D) protein expression in YFP+ cells at P9 in +/Δ10s (A and C) and Δ10/Δ10s (B and D). Cells co-expressing YFP and Pdgfrα or Ng2 appeared to be slightly more numerous in Δ10 heterozygotes relative to homozygotes. Inset pictures display hindbrain (pontomedullary), corpus callosum (splenium and genu), striatum and cerebellar arbor vitae. Δ10/Δ10 = tamoxifen-treated transgenic mice carrying a Pdgfrα-CreERT allele and homozygous Polr3bfl alleles; +/Δ10 = tamoxifen-treated transgenic mice carrying a Pdgfrα-CreERT allele and heterozygous Polr3bfl alleles; CTRL = tamoxifen-treated transgenic mice carrying no Pdgfrα-CreERT allele(s); C. callosum = corpus callosum; YFP = yellow fluorescent protein; Pdgfrα = platelet-derived growth factor receptor alpha.
Figure 6
Figure 6
In Δ10 homozygous mice, hypomyelination is caused by decreased numbers of myelinating oligodendrocytes due to proliferation and maturation defects. (A) Counting yellow fluorescent protein (YFP) positive or negative Pdgfrα+ OPCs and CC1+ mature oligodendrocytes (OLs) in sagittal sections from Δ10/Δ10s, +/Δ10s, and CTRLs allowed us to track the maturation of the oligodendrocyte lineage in transgenic mice. At P9, P14 and P18, counting single-positive (B) Pdgfrα precursor or (C) CC1 mature oligodendrocyte lineage cells (OLCs) reveals that while CTRLs (green lines) and +/Δ10s (blue lines) have similar population dynamics, Δ10/Δ10s (red lines) fail to increase numbers of precursor and mature OLCs throughout the brain. (D) The maturation of the overall population is demonstrated as an increasing ratio of CC1+ mature OLCs to Pdgfrα+ precursors in CTRL and +/Δ10 mice, but this does not occur in Δ10/Δ10s. (E) YFP+Pdgfrα+ OPC dynamics largely mirror the scale and direction of changes in the single positive Pdgfrα population. (F) YFP+CC1+ OLC dynamics largely mirror the scale and direction of changes in the single positive CC1 population. (G) YFP+ cell numbers decline throughout the observation window, suggesting that while adequate numbers of OLCs are not produced in Δ10/Δ10s, existing cells are also depleted from the parenchyma over time. Mean of biological replicates and standard deviations are shown for the plots in BG, animal numbers and biological replicates for each time series are detailed in Supplementary Table 3. Statistics for graphs in BG were computed using two-way ANOVA with multiple comparisons (between genotypes at each time point) tested using the Tukey method and α = 0.05. (HJ) Proliferation at P9 as assessed by EdU incorporation after a 6 h labelling protocol is reduced in Δ10/Δ10s compared to +/Δ10s in terms of (H) number of proliferating cells, (I) number of YFP+ proliferating cells, and (J) the relative proportion of proliferating cells among YFP+ cells. (LN) At P18, a higher proportion of OLCs in Δ10/Δ10s are immature compared to +/Δ10s. (L) A higher proportion of YFP+ cells co-express Pdgfrα. (M) A higher proportion of YFP+ cells co-express Ng2. (N) At P18, Δ10/Δ10s have a lower proportion of mature OLCs compared to +/Δ10s. A lower proportion of YFP+ cells co-express CC1. (K ) Cells triple labelled for YFP, Olig2 and EdU (white arrowheads) are significantly more numerous in +/Δ10s (upper panel) than in Δ10/Δ10s (lower panel). Statistics for graphs in HN were computed using unpaired, two-tailed t-tests with Welch's correction and α = 0.05. *P < 0.05, **P < 0.01, ***P < 0.001, ****P < 0.0001. Δ10/Δ10 = tamoxifen-treated transgenic mice carrying a Pdgfrα-CreERT allele and homozygous Polr3bfl alleles; +/Δ10 = tamoxifen-treated transgenic mice carrying a Pdgfrα-CreERT allele and heterozygous Polr3bfl alleles; CTRL = tamoxifen-treated transgenic mice carrying no Pdgfrα-CreERT allele(s); SEM= standard error of the mean; Pdgfrα = platelet-derived growth factor receptor alpha; CC1 = clone CC1 of anti-adenomatous polyposis coli (also: Anti-Quaking 7); Ng2 = Neuron-glial antigen 2 (encoded by Cspg4); EdU = 5-ethynyl-2′-deoxyuridine.
Figure 7
Figure 7
Depletion of YFP+ cells from the parenchyma in Δ10 homozygous mice. Comparison of +/Δ10 (A) and Δ10/Δ10 (B) demonstrated widespread depletion of yellow fluorescent protein positive (YFP+) cells in the parenchyma of Δ10/Δ10. Representative images shown. Among remaining YFP+ cells, Δ10/Δ10 had cells with shorter processes and more immature morphology. Inset pictures show the hindbrain, midbrain, splenium of the corpus callosum, and anterior commissure. Δ10/Δ10 = tamoxifen-treated transgenic mice carrying a Pdgfrα-CreERT allele and homozygous Polr3bfl alleles; +/Δ10 = tamoxifen-treated transgenic mice carrying a Pdgfrα-CreERT allele and heterozygous Polr3bfl alleles; CTRL = tamoxifen-treated transgenic mice carrying no Pdgfrα-CreERT allele(s); CC1 = clone CC1 of anti-adenomatous polyposis coli (also: Anti-Quaking 7).

References

    1. Bernard G, Chouery E, Putorti ML, et al. Mutations of POLR3A encoding a catalytic subunit of RNA polymerase pol III cause a recessive hypomyelinating leukodystrophy. Am J Hum Genet. 2011;89:415–423. - PMC - PubMed
    1. Tetreault M, Choquet K, Orcesi S, et al. Recessive mutations in POLR3B, encoding the second largest subunit of pol III, cause a rare hypomyelinating leukodystrophy. Am J Hum Genet. 2011;89:652–655. - PMC - PubMed
    1. Thiffault I, Wolf NI, Forget D, et al. Recessive mutations in POLR1C cause a leukodystrophy by impairing biogenesis of RNA polymerase III. Nat Commun. 2015;6:7623–7631. - PMC - PubMed
    1. Dorboz I, Dumay-Odelot H, Boussaid K, et al. Mutation in POLR3K causes hypomyelinating leukodystrophy and abnormal ribosomal RNA regulation. Neurol Genet. 2018;4:e289. - PMC - PubMed
    1. Saitsu H, Osaka H, Sasaki M, et al. Mutations in POLR3A and POLR3B encoding RNA polymerase III subunits cause an autosomal-recessive hypomyelinating leukoencephalopathy. Am J Hum Genet. 2011;89:644–651. - PMC - PubMed

Publication types

MeSH terms

Substances