M-CSF directs myeloid and NK cell differentiation to protect from CMV after hematopoietic cell transplantation
- PMID: 37635627
- PMCID: PMC10630876
- DOI: 10.15252/emmm.202317694
M-CSF directs myeloid and NK cell differentiation to protect from CMV after hematopoietic cell transplantation
Abstract
Therapies reconstituting autologous antiviral immunocompetence may represent an important prophylaxis and treatment for immunosuppressed individuals. Following hematopoietic cell transplantation (HCT), patients are susceptible to Herpesviridae including cytomegalovirus (CMV). We show in a murine model of HCT that macrophage colony-stimulating factor (M-CSF) promoted rapid antiviral activity and protection from viremia caused by murine CMV. M-CSF given at transplantation stimulated sequential myeloid and natural killer (NK) cell differentiation culminating in increased NK cell numbers, production of granzyme B and interferon-γ. This depended upon M-CSF-induced myelopoiesis leading to IL15Rα-mediated presentation of IL-15 on monocytes, augmented by type I interferons from plasmacytoid dendritic cells. Demonstrating relevance to human HCT, M-CSF induced myelomonocytic IL15Rα expression and numbers of functional NK cells in G-CSF-mobilized hematopoietic stem and progenitor cells. Together, M-CSF-induced myelopoiesis triggered an integrated differentiation of myeloid and NK cells to protect HCT recipients from CMV. Thus, our results identify a rationale for the therapeutic use of M-CSF to rapidly reconstitute antiviral activity in immunocompromised individuals, which may provide a general paradigm to boost innate antiviral immunocompetence using host-directed therapies.
Keywords: CMV (prophylaxis); HCT; M-CSF (CSF-1); NK cell; host-directed therapy.
© 2023 The Authors. Published under the terms of the CC BY 4.0 license.
Conflict of interest statement
MHS is a patent holder of WO2014167018A1 (Use of M‐CSF for preventing or treating myeloid cytopenia and related complications). The authors declare no further competing interests.
Figures
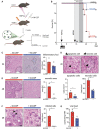
Leukopenia model to study MCMV viremia.
Survival of mice after HSPC transplantation (arrow), MCMV infection (stippled arrow) and treatment (arrowheads) with control PBS (−M‐CSF; n = 7) or three doses of 10 μg mouse recombinant M‐CSF (+M‐CSF; n = 6). Transplanted, uninfected mice (n = 5) are shown as control.
Histopathology of MCMV‐induced hepatitis. Assessment of inflammatory foci 4 days after infection of transplanted mice treated with M‐CSF or control PBS. Example of hematoxylin and eosin (H&E)‐staining and inflammatory foci (n = 4) (scale bar = 100 μm).
Histopathology of MCMV‐induced hepatitis. Apoptotic (arrowheads) and necrotic (arrows) hepatocytes and quantification as median cell numbers per area (n = 4) (scale bar = 30 μm).
Histopathology of MCMV‐induced hepatitis. Assessment of necrotic area 8 days after infection of transplanted mice (H&E). Percentage of affected areas (n = 4) (scale bar = 100 μm).
Histological analysis of infected hepatocytes (H&E); quantification per area (n = 4) (scale bar = 30 μm).
RT‐qPCR‐based quantitation of viral mRNA per 200 ng RNA (n = 5).

Survival of HSPC‐transplanted mice after MCMV infection. Two weeks after HCT, mice received MCMV intraperitoneally: 1,000 PFU (violet; n = 5), 2,500 PFU (green; n = 6), 5,000 PFU (red; n = 6) and 7,500 PFU (blue; n = 5). Transplantation controls (black; n = 10). Non‐irradiated, non‐transplanted mice with 7,500 PFU served as infection controls (brown; n = 6).
Treatment with different doses and sources of M‐CSF. Survival of mice after infection (arrow), control (−M‐CSF, red) or M‐CSF (+M‐CSF, blue) or transplanted, uninfected controls (black). HSPC‐transplantation (solid arrow), MCMV infection (stippled) and different intravenous doses of control or M‐CSF. Treatment with 4 doses (−1 h, d+1, d+3, d+5) of 10 μg baculoviral‐expressed mouse M‐CSF (−M‐CSF, n = 12; +M‐CSF, n = 12; control, n = 5).
Like B with 3 doses (−1 h, +5 h, +18 h) of 10 μg human recombinant M‐CSF (−M‐CSF, n = 15; +M‐CSF, n = 13; control, n = 5).
Like B with a single dose (+5 h) of 10 μg baculoviral‐expressed mouse M‐CSF (−M‐CSF, n = 8; +M‐CSF, n = 9; control, n = 2).
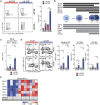
FACS examples and median of absolute number of total NK cells (CD19−CD3−Ly6G−NK1.1+) are shown (n = 5 mice per group, one independent experiment is shown but was confirmed twice).
Markers specific to differentiation and maturation stages of NK cells used in this analysis are indicated.
Median of absolute number of donor‐derived NK progenitor cells (CD122+CD27+NK1.1−Nkp46−CD45.1+) are displayed (n = 5 mice per group, one independent experiment is shown but was confirmed twice).
FACS examples and median of absolute numbers of donor‐derived immature NK cells, donor‐derived M1 (CD11b+ CD27+) and M2 NK cells (CD11b+CD27−) are shown (n = 5 mice per group, one independent experiment is shown but was confirmed twice).
Gene expression analysis of transcription factors expressed by NK cells in FACS‐sorted, donor‐derived NK1.1+ NK cells (definitions of Fig 2A) by nanofluidic Fluidigm array real‐time PCR.

Median of absolute numbers of (CD45.2+) recipient (left) and (CD45.1+) donor (right) NK cells (CD19−CD3−Ly6G−NK1.1+). **P < 0.01 by Mann–Whitney U‐test.
Gene expression profiling of transcription factors measured by nanofluidic Fluidigm array RT‐qPCR of host‐derived NK cells, which were isolated from the spleens of control or M‐CSF‐treated recipient mice 1.5 days after MCMV of infection or time‐matched, mock‐infected, HSPC‐transplanted mice.
Median of absolute numbers of host‐derived M1 NK cells (CD11b+CD27+) and host‐derived M2 NK cells (CD11b+CD27−) in the spleen of PBS control or M‐CSF‐treated recipient mice 1.5 days after MCMV or mock infection 14 days after HSPC transplantation. *P < 0.05 by Mann–Whitney U‐test.
Gene expression profiling of host‐derived NK cells, which were isolated from the spleen of control or M‐CSF‐treated recipient mice 1.5 days after MCMV or mock infection for activation and maturation related factors by RT‐qPCR.
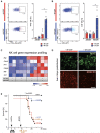
NK cell activity in the spleen. FACS examples and median percentage of donor‐derived NK1.1+ NK cells producing IFNγ (n = 5–6 mice per group, two independent experiments).
FACS examples and median percentage of donor‐derived NK1.1+ NK cells producing GrB (n = 5–6 mice per group, two independent experiments).
Gene expression analysis of activation and maturation‐related factors in FACS‐sorted, donor‐derived NK1.1+ NK cells by RT‐qPCR.
Immunofluorescence analyses with anti‐NK1.1 and anti‐MCMV IE1 antibodies in liver of HSPC‐transplanted and M‐CSF‐ or control mice 4 days after MCMV infection (scale bar = 100 μm).
Assessment of M‐CSF‐mediated antiviral NK cell response. Survival of PBS control (−M‐CSF, n = 15), M‐CSF‐ and control IgG‐treated (n = 12), M‐CSF and anti‐NK1.1‐treated (n = 17) or transplanted, uninfected control mice (n = 4). Mice underwent HSPC‐transplantation (solid arrow), control PBS or M‐CSF‐treatment (black arrowheads) and were infected with MCMV (stippled arrow) as shown in Fig 1A and B. Repeated treatment with anti‐NK1.1 antibody (or control IgG) was done before and after infection (d−1, d1, d3, d5).

Splenic GMPs of control or M‐CSF‐treated, uninfected mice 14 days after HCT.
Splenic granulocytes (Ly6G+CD11b+) and mononuclear phagocytes (Ly6G−CD11b+) of control or M‐CSF‐treated, uninfected recipient mice 14 days after transplantation.
Analysis of M‐CSF‐dependent myeloid cells for its antiviral effect. Survival curve of MCMV‐infected and PBS‐control‐treated (n = 10), M‐CSF and Ig‐control‐treated (n = 9) or M‐CSF and anti‐CD115 antibody‐treated mice (n = 10). After HCT (solid arrow), control or M‐CSF applied (black arrowheads). Infection with MCMV (stippled arrow) as in Fig 1A and B and treatment twice with anti‐CD115 antibody before infection (d−2, d−1).
Splenic GMPs, monocytes, cDCs and pDCs of uninfected control‐ or anti‐CD115 antibody‐treated recipient mice 48 h after first treatment.
GMP‐derived myeloid cells for antiviral activity. GMP transplantation with 50,000 cells on day 10 after HCT. Survival of MCMV‐infected control (no GMP, n = 10) or GMP‐transplanted mice (GMP, n = 10). Mice underwent HCT (HSPCs) (solid arrow), were infected with MCMV (stippled arrow) and GMP‐transplanted 10 days after HCT.
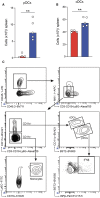
Median of absolute numbers of donor‐derived spleen pDCs (Lin−CD11cloBST2high) of mice treated with PBS control or M‐CSF 14 days after HCT and analyzed after an additional 1.5 days of MCMV or mock infection. **P < 0.01 by Mann–Whitney U‐test.
Median of absolute numbers of cDCs (Lin−CD11c+BST2−/low) of mice treated with PBS control or M‐CSF 14 days after HCT and analyzed after an additional 1.5 days of MCMV or mock infection. **P < 0.01 by Mann–Whitney U‐test.
Gating strategy for CD45.1+ monocytes, pDCs, IFN‐β and cDCs.
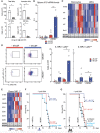
Splenic NK1.1+, immature and mature NK cells of uninfected control or anti‐CD115‐treated mice 2 days after depletion and 14 days after HCT and M‐CSF treatment.
Mice MCMV‐ or mock‐infected 14 days after HCT and analyzed 1.5 days after. Il15 mRNA levels (RT‐qPCR).
Mice MCMV‐ or mock‐infected 14 days after HCT and analyzed 1.5 days after. Sorted, donor‐derived monocytes and cDCs assessed by Fluidigm.
Mice MCMV‐ or mock‐infected 14 days after HCT and analyzed 1.5 days after. Ly6Chi monocytes (left), IL15Rα‐expressing, donor‐derived Ly6Chi or Ly6Clow monocytes (right).
Mice MCMV‐ or mock‐infected 14 days after HCT and analyzed 1.5 days after. Gene expression analysis of donor‐derived NK cells by Fluidigm.
GMPs transplanted after HCT (D10). Survival of MCMV‐infected control (no GMP, n = 10), WT GMP (n = 10) or IL15Rα‐KO GMP‐transplanted mice (IL15Rα‐KO GMP, n = 8). HCT (solid arrow), MCMV infection (stippled) and GMP‐transplantation (arrowhead).
Survival of WT HCT, control‐treated (n = 8), WT HCT, M‐CSF‐treated (n = 8) or IL15Rα‐KO HCT, control‐treated (n = 10) or IL15Rα‐KO HCT, M‐CSF‐treated mice (n = 10). Mice transplanted with WT control HSPCs or IL15Rα‐KO HSPCs (solid arrow), control or M‐CSF treatment (black arrowheads), and MCMV infection (stippled).

Splenic Ifnb1 mRNA levels of control or M‐CSF‐treated mice (RT‐qPCR).
Donor‐derived splenic Lin−CD11cloBST2hi pDCs.
% IFN‐β+ pDCs.
Survival of MCMV‐infected, no GMP control (n = 8), WT GMP (n = 9) or Ifnar1‐KO GMP‐transplanted mice (n = 9). HCT (solid arrow), MCMV infection (stippled) and GMP‐transplantation 10 days after HCT (arrowhead). P < 0.0001 by Mantel‐Cox test.
Survival of MCMV‐infected, no GMP control (n = 8), WT GMP (n = 8) or Ifnar1‐KO GMP‐transplanted mice without (n = 8) or with IL‐15 rescue treatment (n = 16). HCT (solid arrow), MCMV infection (stippled), GMP transplantation 10 days after HCT (blue arrowhead) and treatment with 0.5 μg IL‐15 or control on days 12, 13 and 14 (black arrowheads).

Cytospins at days 5 or 9 after in vitro differentiation without myelopoiesis‐inducing cytokines (−), or with IL‐3 (+3) or M‐CSF (+M) (modified Giemsa). Images were acquired with a Zeiss AX10 benchtop microscope at 40× magnification.
Median fluorescence intensity of SSC‐A (granularity) at seeding (d0), or after in vitro cytokine treatment without myelopoiesis‐inducing cytokines (−, green circle), with IL‐3 (+3, blue circle) or with M‐CSF (+M, salmon circle) (data shown in technical triplicates from five biological donors).
Pseudocolor scatterplots of G‐CSF‐mobilized PBMCs after in vitro cytokine treatment shown for CD34 (left) and CD11b expression (right) on the x‐axis and SSC‐A on the y‐axis without myelopoiesis‐inducing cytokines (−, top row), with IL‐3 (+3, middle row) or with M‐CSF (+M, bottom row).
Frequency of CD34+ HSPCs at seeding (d0), or after in vitro cytokine treatment without myelopoiesis‐inducing cytokines (−, green circle), with IL‐3 (+3, blue circle) or with M‐CSF (+M, salmon circle) (data shown in technical triplicates from five biological donors).
Frequency of CD11b+ myeloid cells at seeding (d0), or after in vitro cytokine treatment without myelopoiesis‐inducing cytokines (−, green circle), with IL‐3 (+3, blue circle) or with M‐CSF (+M, salmon circle) (data shown in technical triplicates from five biological donors).
Contour plots of HSPC populations comprising of CLPs (CD34+CD45RA+CD38−) or GMPs (CD34+CD45RA+CD38+) upon selection from G‐CSF‐mobilized PBMCs (d0) or after in vitro cytokine treatment at day 5: without myelopoiesis‐inducing cytokines (−) versus IL‐3 (+3) versus M‐CSF (+M).
Frequency of GMPs at seeding (d0, empty circle) or without myelopoiesis‐inducing cytokine treatment (−, green circle), with IL‐3 (+3, blue circle) or with M‐CSF (+M, salmon circle) (data shown in technical triplicates from five biological donors).
Frequency of HLA‐DR+ GMPs at seeding (d0, empty circle) or without myelopoiesis‐inducing cytokine treatment (−, green circle), with IL‐3 (+3, blue circle) or with M‐CSF (+M, salmon circle) (data shown in technical triplicates from five biological donors).
M‐CSF‐stimulated differentiation of monocyte‐derived macrophages (Mo‐Macs, CD11b+CD66b−CD64+) (data shown in technical triplicates from five biological donors).
M‐CSF‐stimulated differentiation of monocyte‐derived macrophages (Mo‐Macs, CD11b+CD66b−HLA‐DR+) (data shown in technical triplicates from five biological donors).
Frequency of CD14+ cells at seeding (d0), or after in vitro cytokine treatment without myelopoiesis‐inducing cytokines (−, green circle), with IL‐3 (+3, blue circle) or with M‐CSF (+M, salmon circle) (data shown in technical triplicates from five biological donors).
M‐CSF‐stimulated differentiation of monocyte‐derived macrophages (Mo‐Macs, CD14+CD16+) (data shown in technical triplicates from five biological donors).
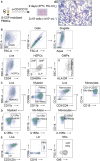
Workflow for G‐CSF‐mobilized leukapheresis samples
Gating strategy for flow cytometric assessment.
“Live” singlets assessed for CD11b (“Myeloid” cells): polymorphonuclear neutrophils (PMNs, CD11b+CD66b+) and CD11b+CD66b− “Monocytic” cells. The “Monocytes” (CD14+) gate permitted identification of CD14+CD16+ monocyte‐derived macrophages. At baseline (d0), this gating strategy was used to identify classical monocytes (CMs, CD14+CD16−), intermediate monocytes (IMs, CD14+CD16+) or non‐classical monocytes (NCMs, CD14−CD16+) accordingly.
IL15Rα expression measured on myeloid, monocytic cells, or monocytes identified in (C).
The gating strategy of OMIP‐027 with minor modifications by gating on the Lin− cells from the dot plot shown in (C).

Contour plots of IL15Rα expression by CD11b+ and CD14+ Mo‐Macs.
Quantification of IL15Rα expression in CD11b+CD66b− Mo‐Macs (data shown in technical triplicates from five biological donors).
Quantification of IL15Rα expression in CD14+ Mo‐Macs (data shown in technical triplicates from five biological donors).
Quantification of CLPs with representative contour plots of CLP enrichment after M‐CSF treatment (data shown in technical triplicates from five biological donors).
M‐CSF supports NK cells (NKs, SSC‐AlowLin−CD56+CD16+) compared to − and +3 with representative contour plots of NKs comparing +3 with +M treatment (data shown in technical triplicates from five biological donors).
M‐CSF enhances Granzyme B (GrB) production in NKs. Representative contour plots of GrB+ NKs after +3 or +M treatment are shown (data shown in technical triplicates from five biological donors).
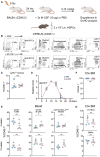
The protocol for allogeneic hematopoietic stem cell transplantations (alloHCT) between BALB/c CD45.2+ recipient and C57BL/6j CD45.1+ donor mice. Before (1 h) or after (5 h, 20 h) alloHCT with 2 × 10⁵ lineage negative (Lin−) hematopoietic stem and progenitor cells (HSPCs), mice received PBS or 10 μg baculoviral‐expressed human M‐CSF.
Engraftment of CD45.1+ cells was assessed at 4 and 12 weeks after alloHCT using the gating strategy by Alexander et al (2014).
Quantification of inflammatory Ly6CHI CD11b+F4/80+ monocytes (monos) of CD45.1+ cells.
Disease scoring was applied as published by Lai et al (2012).
Tri‐lineage engraftment (CD3ε+ T cells, CD19+ B cells, CD11b+SSC‐ALOW monocytes) at 4 and 12 weeks post‐HCT in the blood.
CD45.1+ cells in the bone marrow (BM) 12 weeks after alloHCT.
Percentage of HSCs (KSL Flt3−CD150+CD48−) and GMPs in CD45.1+ lineage negative BM cells 12 weeks after alloHCT.
Comment in
-
Macrophage colony-stimulating factor as a weapon against cytomegalovirus.EMBO Mol Med. 2023 Nov 8;15(11):e18319. doi: 10.15252/emmm.202318319. Epub 2023 Sep 12. EMBO Mol Med. 2023. PMID: 37697915 Free PMC article.
References
-
- Ahmed A (2011) Antiviral treatment of cytomegalovirus infection. Infect Disord Drug Targets 11: 475–503 - PubMed
-
- Arber C, BitMansour A, Sparer TE, Higgins JP, Mocarski ES, Weissman IL, Shizuru JA, Brown JMY (2003) Common lymphoid progenitors rapidly engraft and protect against lethal murine cytomegalovirus infection after hematopoietic stem cell transplantation. Blood 102: 421–428 - PubMed
-
- Baranek T, Manh TPV, Alexandre Y, Maqbool MA, Cabeza JZ, Tomasello E, Crozat K, Bessou G, Zucchini N, Robbins SH et al (2012) Differential responses of immune cells to type i interferon contribute to host resistance to viral infection. Cell Host Microbe 12: 571–584 - PubMed
Publication types
MeSH terms
Substances
LinkOut - more resources
Full Text Sources
Medical
Research Materials

