. 2023 Aug 10:11:1178992.
doi: 10.3389/fcell.2023.1178992. eCollection 2023.

Age-dependent structural reorganization of utricular ribbon synapses

Affiliations

Age-dependent structural reorganization of utricular ribbon synapses

Susann Michanski et al. Front Cell Dev Biol. .

Abstract

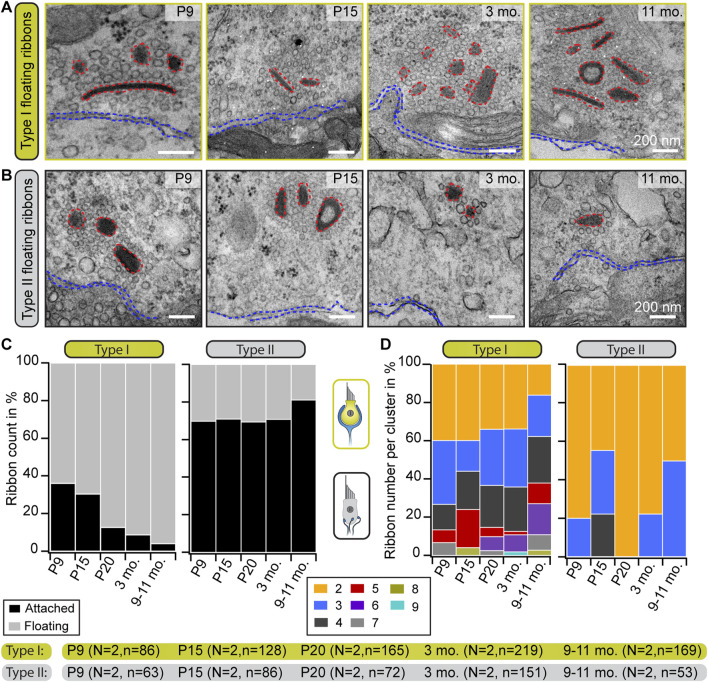
In mammals, spatial orientation is synaptically-encoded by sensory hair cells of the vestibular labyrinth. Vestibular hair cells (VHCs) harbor synaptic ribbons at their presynaptic active zones (AZs), which play a critical role in molecular scaffolding and facilitate synaptic release and vesicular replenishment. With advancing age, the prevalence of vestibular deficits increases; yet, the underlying mechanisms are not well understood and the possible accompanying morphological changes in the VHC synapses have not yet been systematically examined. We investigated the effects of maturation and aging on the ultrastructure of the ribbon-type AZs in murine utricles using various electron microscopic techniques and combined them with confocal and super-resolution light microscopy as well as metabolic imaging up to 1 year of age. In older animals, we detected predominantly in type I VHCs the formation of floating ribbon clusters, mostly consisting of newly synthesized ribbon material. Our findings suggest that VHC ribbon-type AZs undergo dramatic structural alterations upon aging.

Keywords: aging; ribbon synapse; synaptogenesis; utricle; vestibular hair cells.


Conflict of interest statement

The authors declare that the research was conducted in the absence of any commercial or financial relationships that could be construed as a potential conflict of interest.

Figures

FIGURE 1
FIGURE 1
Changes in the abundance and shape of VHC ribbons upon maturation and aging. (A,D) Analysis of the number of membrane-attached synaptic ribbons reveals a larger proportion of multiple ribbons per AZ in immature type I (A) and type II (D) VHCs compared to mature ages. N = number of animals, n = number of membrane-attached ribbons. (B,C,E–G) Examples of electron micrographs depicting either multiple or single synaptic ribbons (highlighted with red dashed lines) in type I (B,C) and type II (E–G) VHCs. (H–K) Box plots show random section quantifications of the ribbon size measurements for all age groups of attached (Att.; (H–J)) and floating ribbons (Flo.; (K)). No prominent changes regarding the ribbon area, height, and width could be observed in older animals. (L) Proportion of ribbons (including attached and floating ribbons) categorized into different types of shapes, respectively for all quantified ages. Significant differences between two groups were analyzed with a two-tailed t-test or Mann–Whitney Wilcoxon test. For multiple comparisons, ANOVA followed by the post hoc Tukey or Kruskal-Wallis (KW) test followed by NPMC test was performed. For more detailed information, including n values for floating ribbons, see also Supplementary Table S2.
FIGURE 2
FIGURE 2
Progressive accumulation of floating ribbons in type I VHCs. (A,B) Representative electron micrographs showing single and multiple floating ribbons (red dashed lines) in type I (A) and type II (B) VHCs. All depicted ribbons appear to lack the presynaptic contact to the HC membrane (blue dashed lines). (C) Graphs representing the proportions of floating and membrane-attached ribbons during maturation and aging. Mature type I VHCs possess predominantly floating ribbons, whereas type II VHCs exhibit mainly attached ribbons throughout all investigated ages. (D) Quantification of the total number of ribbons per cluster reveals the occurrence of large ribbon clusters in both VHC types. With advancing age, the ribbon count per cluster increases in type I VHCs but slightly decreases in type II VHCs. N, number of animals; n, number of ribbons (including membrane-attached and floating ribbons).
FIGURE 3
FIGURE 3
Localization of the presynaptic AZ proteins bassoon and piccolino at type I VHCs ribbon synapses. (A,C,G,I) 100x confocal images of the utricular striola, identified here by the presence of calretinin (blue) stained single and complex calyces, with combinations of various synaptic proteins. Ribbon proteins RIBEYE A (A,C) and CtBP2 (G,I) shown in green. Anchoring protein bassoon (B,D) and ribbon-associated protein piccolino (G,I) shown in magenta. Scale bars in (A,C,G,I): 10 µm. (B,D,H,J) Top panels show representative STED images of putative single ribbons or small ribbon clusters and lower panels show images of complex clusters near the type I VHC membranes, with the respective antibody combinations (scale bars for STED images: 1 µm). (E,K) Schematic representation of the antibody combinations used for each panel in young (2 weeks) and old mice (32 weeks). (F,L) Representative STED images of particularly large ribbon clusters (scale bar: 1 µm). N = 3 animals for each combination. Note that 100x confocal images represent maximal projections of only a few optical planes for better visibility. White asterisks mark the panels depicting ribbons that seemingly lack bassoon (even in the optical planes that were omitted from projections).
FIGURE 4
FIGURE 4
Ribbon cluster abundance in large volume data. (A) 3D models of type I and II VHCs from P15 and 8-month-old mice using FIB-SEM (top view). The P15 data set derived from type I VHCs with a complex calyx. The VHC bodies (light gray) contain numerous ribbon synapses (red) tethering SVs (yellow: ribbon-associated, orange: peripheral SVs). (B) Individual ribbon cluster segmentations of immature and mature type I VHCs. Upper row shows ribbon clusters with SVs, lower row displays the respective segmentation without SVs. (C,C′) Bar graphs showing the distribution of attached vs. floating and single vs. multiple ribbons per VHC type and age group. (D) Analysis of the total ribbon count per synapse reveals more multiple ribbon numbers in type I VHCs. In type II VHCs, multiple ribbons per bouton could be observed in both age groups. (E–G) Ribbon size measurement data from both VHC types and age groups (Student’s t-test or Mann-Whitney-Wilcoxon test). (G) Due to the limited number of total ribbon volumes per VHC, we refrained from performing a statistical analysis for this graph that displays the ratio between the categories young vs. old and type I vs. type II VHCs. (H) Boxplot illustrating the SV numbers per synaptic contact or cluster (*p = 0.018, ****p < 0.0001 Mann-Whitney-Wilcoxon test). Note, the high SV count in type I VHCs with >1,000 SVs associated with a single ribbon cluster. For more detailed information see also Supplementary Table S6. P15 type I = 3 VHCs, N = 2 animals, n = 37 ribbons; P15 type II = 1 VHC, N = 1 animal, n = 26 ribbons; 8 mo type I = 4 VHCs, N = 2 animals, n = 53 ribbons; 8 mo type II = 2 VHCs, N = 2 animals, n = 55 ribbons.
FIGURE 5
FIGURE 5
Smaller SV diameters but larger SV clouds around type I VHC ribbons close to filamentous structures. (A–F) Boxplots present the data for SV counts, their density and diameter measurements for attached and floating ribbons, respectively. (G) Electron micrographs from 2D TEM data display accumulations of filamentous cytoskeletal structures (yellow arrowheads) in type I VHCs of older ages, which were regularly detected nearby ribbon clusters (red arrowheads) with their corresponding excessive clouds of SVs. For more detailed information see Supplementary Tables S7, S8.
FIGURE 6
FIGURE 6
Enlargement of mitochondrial volume with advancing age. (A,B) Representative 3D segmentations of mitochondria in type I and II VHCs at indicated ages. (C,D) Single sections from the large FIB-SEM datasets illustrating the mitochondrial size difference between type I and type II VHCs. Insets illustrate 3D reconstruction of the individual mitochondrion. (E) Analysis of the mean mitochondrial volumes (indicated by black and white stars) presents a consistent trend of larger mitochondria in mature animals. However, no statistically significant difference was detected for type I VHCs when comparing the related data for both age groups. (F) Percentage of mitochondria within <500 nm of the closest ribbon in both age groups and VHC types. (G) Nearest neighbor distance (NND) of mitochondria-proximal ribbons (located <500 nm to the closest mitochondrion), n. s. p > 0.05 (t-test). P15 type I = 3 VHCs, N = 2 animals; P15 type II = 1 VHC, N = 1 animal; 8 mo type I = 4 VHCs, N = 2 animals; 8 mo type II = 2 VHCs, N = 2 animals.
FIGURE 7
FIGURE 7
NanoSIMS analysis of VHC ribbons. (A,B) To measure protein turnover in VHCs, newly synthesized cellular components were labeled with 15N via a modified diet. 10–14 months old wild-type mice were subjected to this diet for 14 days, before dissecting the VHCs and imaging them first in TEM and then in NanoSIMS. The arrowheads point to several ribbons, with (A) indicating a type II VHC and (B) a type I VHC. In (A) the topmost ribbon is membrane-attached, while the other two are floating. In (B), all six ribbons are floating in the cytosol. The 14N and 15N images indicate that the protein-dense ribbons are easily visualized in NanoSIMS, as bright (nitrogen-intense) spots. The ratio images show the 15N (newly synthesized) signal divided by the 14N (old) signal. The ribbons in (A) are considerably richer in 15N than the ones in (B). (C) The analysis for organs from animals fed with 15N for 14 days indicates the 15N/14N ratios for 13 attached ribbon and 40 floating ribbon measurements, from 15 series of NanoSIMS measurements, from 4 organs. The floating ribbons are substantially more enriched in 15N than mitochondria or heterochromatin (p < 0.0001, ANOVA test followed by post hoc Tukey test). The attached ribbons are also significantly more enriched in 15N than heterochromatin (p < 0.0001, ANOVA test followed by post hoc Tukey test). A similar analysis for organs from animals fed with 15N for 21 days shows that the ribbons are now substantially richer in 15N than all other cellular components (p < 0.0001, KW test with multiple comparison correction; 6 to 25 measurements). The attached ribbons low in 15N (old) have now disappeared, suggesting that ribbons are replaced on a 1–3-week timeline. N14 days = 2 animals; N21 days = 2 animals.
FIGURE 8
FIGURE 8
Schematic overview of utricular VHC ribbon synapse maturation and with advancing age. Summary of the main morphological observations during utricle development. While type II VHCs show very similar developmental events as detected in cochlear IHCs, type I VHCs undergo a distinct maturation process. Light blue: afferent contacts, red: synaptic ribbons (young/newly formed ribbons: transparent, old ribbons: opaque), yellow: SVs, magenta: presynaptic density, dark blue: PSD, light gray: mitochondria.

Similar articles

Cited by

References

    1. Agrawal Y., Carey J. P., Della Santina C. C., Schubert M. C., Minor L. B. (2009). Disorders of balance and vestibular function in US adults: data from the national health and nutrition examination survey, 2001-2004. Arch. Intern. Med. 169, 938–944. 10.1001/archinternmed.2009.66 - DOI - PubMed
    1. Agrawal Y., Zuniga M. G., Davalos-Bichara M., Schubert M. C., Walston J. D., Hughes J., et al. (2012). Decline in semicircular canal and otolith function with age. Otol. Neurotol. 33, 832–839. 10.1097/MAO.0b013e3182545061 - DOI - PMC - PubMed
    1. Bermúdez Rey M. C., Clark T. K., Wang W., Leeder T., Bian Y., Merfeld D. M. (2016). Vestibular perceptual thresholds increase above the age of 40. Front. Neurol. 7, 162. 10.3389/fneur.2016.00162 - DOI - PMC - PubMed
    1. Bertie A. (2002). Java applications for teaching statistics. MSOR Connect. 2, 78–81. 10.11120/msor.2002.02030078 - DOI
    1. Böttger E. C., Schacht J. (2013). The mitochondrion: a perpetrator of acquired hearing loss. Hear. Res. 303, 12–19. 10.1016/j.heares.2013.01.006 - DOI - PMC - PubMed

LinkOut - more resources