. 2023 Aug 11:11:1242481.
doi: 10.3389/fcell.2023.1242481. eCollection 2023.

A novel SATB1 protein isoform with different biophysical properties

Affiliations

A novel SATB1 protein isoform with different biophysical properties

Tomas Zelenka et al. Front Cell Dev Biol. .

Abstract

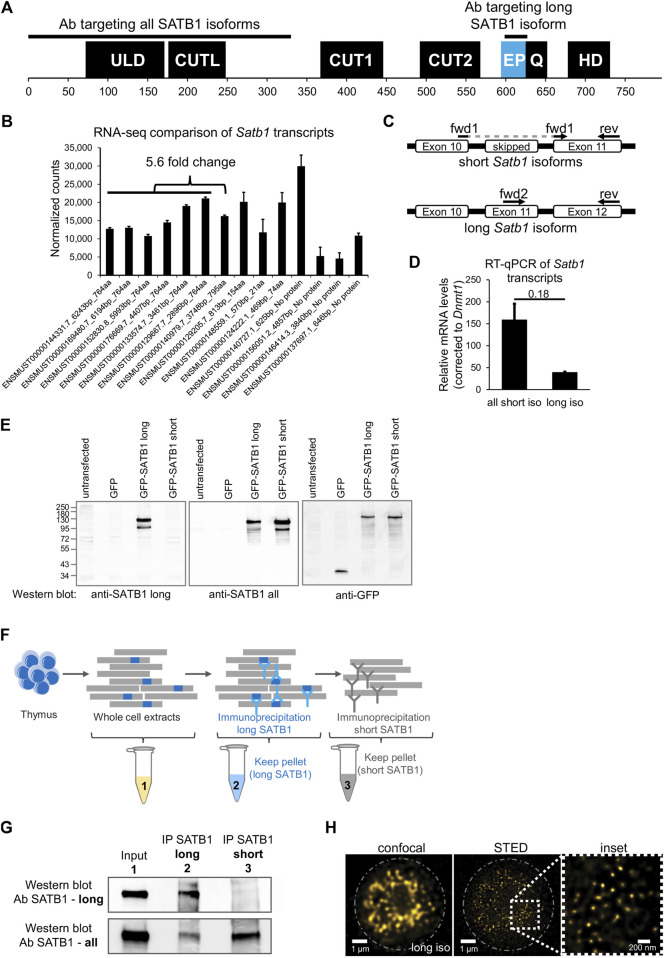
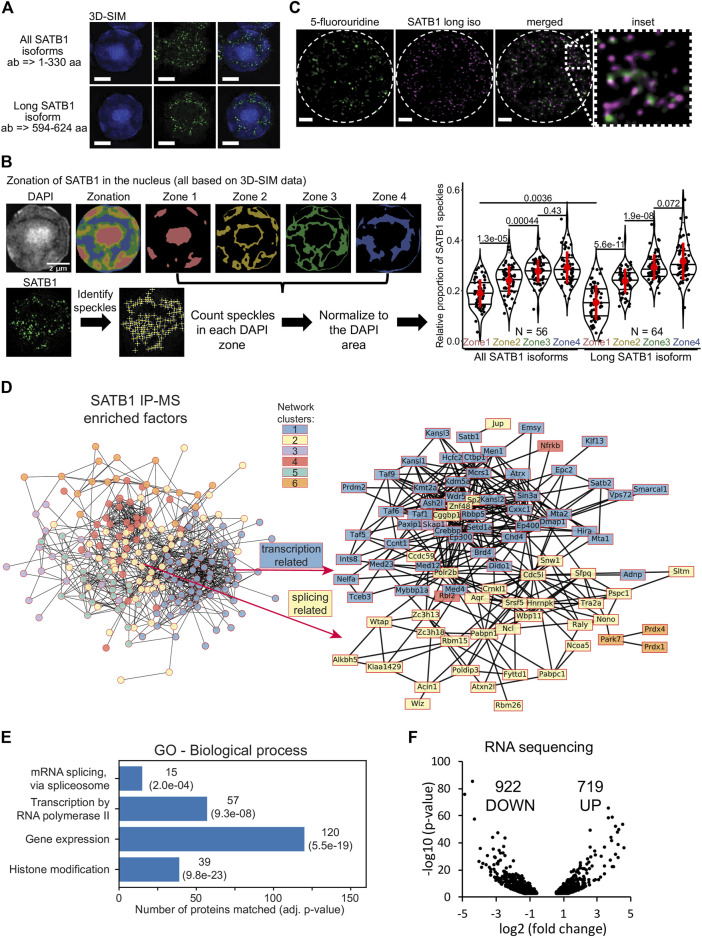
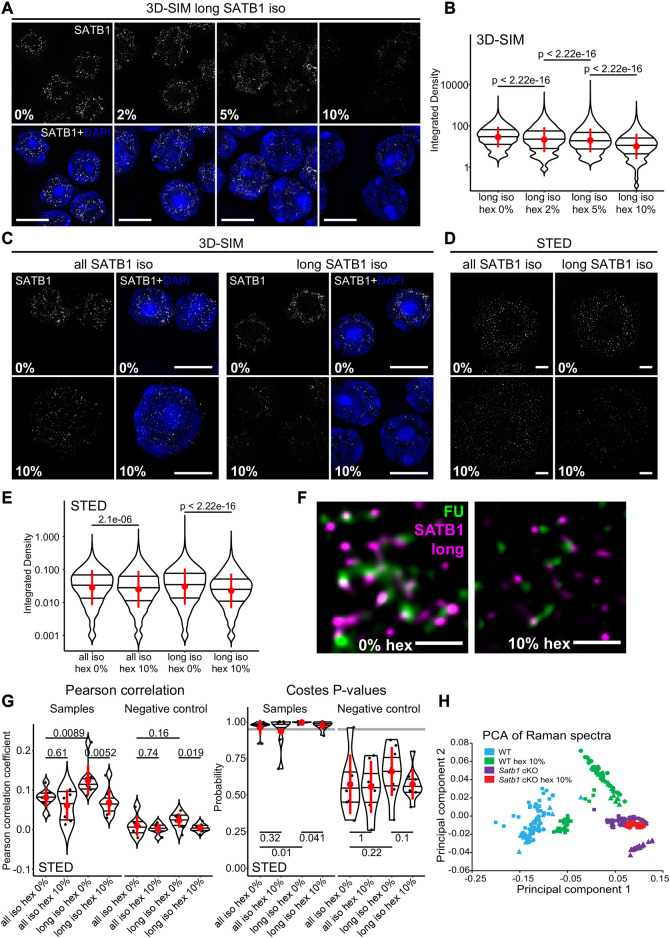
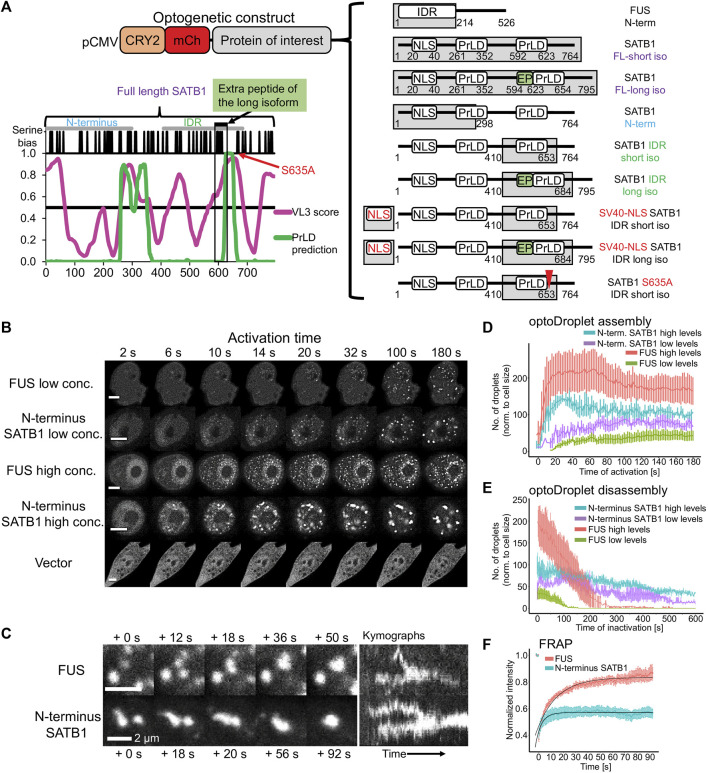
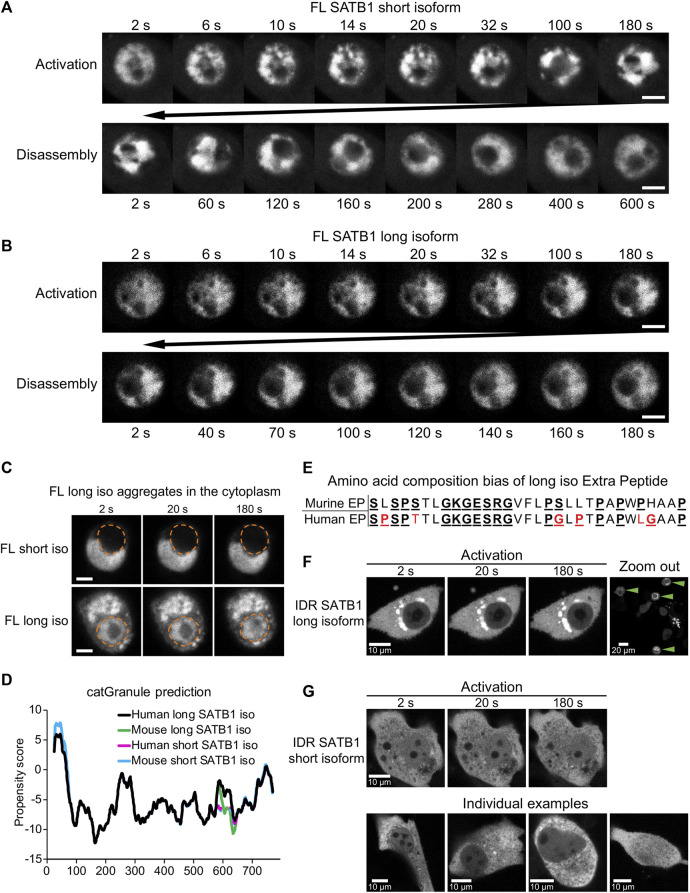
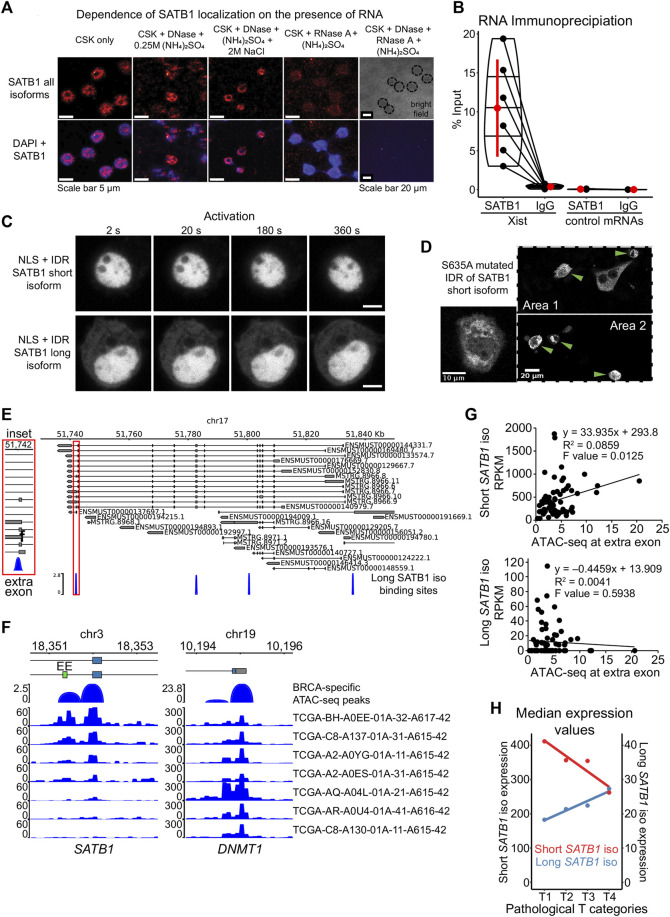
Intra-thymic T cell development is coordinated by the regulatory actions of SATB1 genome organizer. In this report, we show that SATB1 is involved in the regulation of transcription and splicing, both of which displayed deregulation in Satb1 knockout murine thymocytes. More importantly, we characterized a novel SATB1 protein isoform and described its distinct biophysical behavior, implicating potential functional differences compared to the commonly studied isoform. SATB1 utilized its prion-like domains to transition through liquid-like states to aggregated structures. This behavior was dependent on protein concentration as well as phosphorylation and interaction with nuclear RNA. Notably, the long SATB1 isoform was more prone to aggregate following phase separation. Thus, the tight regulation of SATB1 isoforms expression levels alongside with protein post-translational modifications, are imperative for SATB1's mode of action in T cell development. Our data indicate that deregulation of these processes may also be linked to disorders such as cancer.

Keywords: SATB1; T cells; chromatin organization; phase separation; prion.


Conflict of interest statement

The authors declare that the research was conducted in the absence of any commercial or financial relationships that could be construed as a potential conflict of interest.

Figures

FIGURE 1
FIGURE 1
Identification of two SATB1 protein isoforms in murine thymocytes. (A) SATB1 protein consists of the following domains and structural features: ULD–ubiquitin-like domain, CUTL–CUT-like domain, CUT1 and CUT2 domains, EP–the peptide encoded by the predicted extra exon of the long Satb1 isoform, Q–compositional bias represented by a poly-Q domain and a stretch of prolines, HD–homeodomain. In this study, we used two custom-made antibodies (Davids Biotechnology): an antibody targeting the first 330 amino acids of all isoforms (cannot discriminate between the two protein isoforms) and the long isoform antibody specifically targeting the extra peptide of the long isoform. (B) Comprehensive list of quantified Satb1 isoforms based on stranded-total-RNA-seq experiment in thymocytes. Data are the mean ± s.d. (C) Design of the confirmatory RT-qPCR experiment to quantitate relative expression of the short and long Satb1 isoforms in murine thymocytes. (D) RT-qPCR results for the relative mRNA levels of the two Satb1 isoforms. Values from 3 technical and 2 biological replicates were normalized to Dnmt1 mRNA levels. Data are the mean ± s.d. p values by Student’s T-test. (E) The custom-made antibody detecting the long SATB1 protein isoform cannot detect the short SATB1 isoform. Protein extracts (80 µg) prepared from transfected HEK293 cells with plasmids expressing GFP, GFP-SATB1-long and GFP-SATB1-short. Western blotting performed with antibodies detecting either the long SATB1 isoform, all SATB1 isoforms or GFP. (F) Scheme for the approach utilized to detect the SATB1 long isoform and validate the custom-made long isoform-specific antibody (Davids Biotechnology). Whole cell thymocyte protein extracts (sample 1) were prepared and incubated with a custom-made antibody against the long SATB1 isoform. The immunoprecipitated material (sample 2) was kept and the immunodepleted material was subjected on a second immunoprecipitation reaction utilizing an antibody detecting epitopes on both long and short SATB1 isoforms (Santa Cruz Biotechnology, sc-376096). The material from the second immunoprecipitation reaction was kept (sample 3). The second biological replicate is depicted in Supplementary Figures S1A, B; including the thymocyte extract immunodepleted for all SATB1 isoforms (sample 4). (G) Western blot analysis for the samples described in (F). The whole thymocyte protein extract (1), immunoprecipitated long SATB1 protein (2) and immunoprecipitated short SATB1 protein (3). UPPER PANEL: Western blot analysis utilizing a SATB1 antibody detecting only the long SATB1 isoform. LOWER PANEL: Western blot analysis utilizing a SATB1 antibody detecting all SATB1 isoforms. (H) Confocal and STED microscopy images indicating the subnuclear SATB1 cage-like pattern. The super-resolution microscopy unveils that the cage-like pattern is actually composed of individual, mostly round, 40–80 nm large speckles.
FIGURE 2
FIGURE 2
SATB1 is localized in the active nuclear zone and sites of active transcription. (A) 3D-SIM immunofluorescence experiment utilizing two different SATB1 antibodies to visualize the nuclear localization pattern of the long isoform compared to all SATB1 isoforms. Representative of three biological replicates. Scale bar 2 μm. (B) Quantification of the 3D-SIM immunofluorescence images. Nuclei of primary murine thymocytes were categorized into four zones based on the intensity of DAPI staining and SATB1 speckles in each zone were counted. Images used represent a middle z-stack from the 3D-SIM experiments. The graph depicts the differences between long and all SATB1 isoforms’ zonal localization in nuclei of primary murine thymocytes. The horizontal lines inside violin plots represent the 25th, 50th and 75th percentiles. Red circles represent the mean ± s.d. p values by Wilcoxon rank sum test. (C) STED microscopy indicating that SATB1 speckles co-localize with sites of active transcription (60-min pulse 5-fluorouridine treatment). Data are representative of two biological replicates and conclusions were additionally validated by the 3D-SIM approach. Scale bar 1 µm. See also Supplementary Figure S3C. (D) STRING network of all significantly enriched SATB1-interacting proteins clustered using the k-means method (left). The full network, including protein names, is available in Supplementary Figure S4C. The blue cluster 1 and yellow cluster 2 were enriched for transcription and splicing-related factors, respectively. A more detailed network of selected transcription and splicing-related factors is provided (right). (E) Gene ontology enrichment analysis of SATB1-interacting proteins revealed factors involved in transcription and splicing. (F) Volcano plot from stranded-total-RNA-seq experiment displaying the differentially expressed genes (FDR < 0.05) in Satb1 cKO thymocytes.
FIGURE 3
FIGURE 3
SATB1 forms phase separated droplets in vivo. (A) 3D-SIM immunofluorescence microscopy on 1,6-hexanediol-treated thymocytes. Five minutes treatment with increasing concentrations of 1,6-hexanediol gradually solubilized long SATB1 isoform speckles. (B) Quantification of results in a showing a gradual decrease of SATB1 signal, indicating its sensitivity to 1,6-hexanediol treatment. (C) Comparison of immunofluorescence signal based on the antibody targeting all the SATB1 isoforms (Santa Cruz Biotechnology, sc-5990) and only the long isoform (Davids Biotechnology, custom-made) upon 1,6-hexanediol treatment, detected by 3D-SIM microscopy. (D) Immunofluorescence experiment as indicated in c but detected by STED microscopy. Scale bar 0.5 µm. (E) Quantification of results in d showing a more dramatic decrease of long SATB1 isoform signal upon 1,6-hexanediol treatment compared to the all SATB1 isoforms staining. (F) Co-localization of the long SATB1 isoform and fluorouridine-stained sites of active transcription (inset visualized in Figure 2C) and its deregulation upon 10% 1,6-hexanediol treatment detected by STED microscopy. Data are representative of two biological replicates and conclusions were additionally validated by the 3D-SIM approach. Scale bar 0.5 μm. (G) LEFT: Pearson correlation coefficients (PCC) derived from pixel-based co-localization analysis between long and/or all SATB1 isoforms and fluorouridine-stained sites of active transcription, with and without 10% 1,6-hexanediol treatment. RIGHT: the Costes p-values (Costes et al., 2004) derived from randomly shuffled chunks of analyzed images (100 randomizations). The grey line indicates a 0.95 level of significance. Images used for the analysis were generated by STED microscopy. Complete results of the co-localization analysis for both STED and 3D-SIM experiments, including Manders‘ coefficients are depicted in Supplementary Figures S5A–C. (H) Principal component analysis of Raman spectra from WT and Satb1 cKO thymocytes with and without 10% 1,6-hexanediol treatment. Each point represents measurements from an individual cell. For each condition, 2-5 biological replicates were used. See the extracted Raman spectra of the two main principal components that were used to cluster the data in Supplementary Figure S5D. In (B, E, G), the horizontal lines inside violin plots represent the 25th, 50th and 75th percentile. Red circles represent the mean ± s.d. p values by Wilcoxon rank sum test.
FIGURE 4
FIGURE 4
The N-terminus of SATB1 forms phase separated droplets. (A) Graphical representation of all CRY2-mCherry constructs generated. The graph displays the IDR prediction by VL3 PONDR score in magenta and the prediction of prion-like domains by PLAAC algorithm in green. (B) Formation of optoDroplets upon 488 nm pulse illumination in live cells transiently transfected with CRY2-mCherry-N-terminus_SATB1 constructs as well as with negative (vector) and positive control constructs (N-terminal part of FUS protein). Two groups of cells were identified based on the original relative expression levels of the recombinant proteins. Representative of two to three biological replicates. Scale bar 5 μm. (C) OptoDroplets displayed a round shape and the ability to coalesce. (D) Number of optoDroplets normalized to the cell size at each time point upon activation, to visualize the speed of droplet assembly and its dependence on the original concentration of the protein. (E) Number of optoDroplets normalized to the cell size at each time point of inactivation (488 nm laser was off) to visualize the speed of droplet disassembly and its dependence on the original concentration of the protein. (F) FRAP experiment utilizing either the N-terminus of SATB1 construct or the FUS positive control construct. The fitted curves were generated by the exponential recovery curve fitting function of Fiji. In (D, E, F), the error bars represent the s.e.m.
FIGURE 5
FIGURE 5
Discrete biophysical properties of SATB1 protein isoforms. (A) CRY2-mCherry constructs expressing full length short SATB1 isoform underwent reversible ultrastructural changes. Scale bar 5 μm. (B) The same experiment as in a but capturing CRY2-mCherry constructs expressing full length long SATB1 isoform. Scale bar 5 μm. (C) In a fraction of cells, the full-length SATB1 constructs were mislocalized outside the nucleus. For constructs with the long SATB1 isoform this triggered formation of irreversible aggregates. Scale bar 5 µm. For (A, B, C), the images are representative of two biological replicates. (D) Comparison of LLPS propensity predicted by the catGRANULE (Bolognesi et al., 2016) algorithm of human (Q01826-1 and Q01826-2, for short and long isoform, respectively; UniProtKB) and murine (Q60611 and E9PVB7, for short and long isoform, respectively; UniProtKB) SATB1 protein isoforms. Human long SATB1 isoform displays higher phase separation propensity compared to murine protein. (E) Both murine and human long SATB1 isoforms have an increased propensity to undergo phase separation compared to short isoforms due to the presence of the extra peptide with a compositional bias (enrichment in S, G, Q, P, E, K and R amino acids in the murine SATB1). Red letters indicate amino acid differences between murine and human peptide. (F) CRY2-mCherry constructs encompassing only the two SATB1 IDR regions and the poly-Q domain (as indicated in Figure 4A; Figure 1A), but not the NLS signal, displayed much higher rates of cytoplasmic aggregation for the long SATB1 isoform compared to the short isoform. Green arrows indicate cells with long SATB1 isoform aggregates. (G) The same experiment as in (F) but for the short SATB1 isoform IDR constructs.
FIGURE 6
FIGURE 6
Modes of regulation of SATB1 phase transitions. (A) Nuclear matrix extraction coupled to immunofluorescence analysis revealed that a fraction of SATB1 protein (Santa Cruz Biotechnology, sc-5990) remained in the cell nucleus even after DNase I treatment and high-salt extraction. However, RNase A treatment almost completely depleted SATB1 from the nucleus, indicating a high level of association between SATB1 and nuclear RNA. Representative of two biological replicates. (B) SATB1 co-immunoprecipitation confirmed the association of SATB1 with lncRNA Xist. Black dots represent individual % input measurements for Xist RIP (3 biological replicates, 4 Xist regions targeted) and control RIP experiments (3 biological replicates; 3 control RNAs: Tbp, Smc1a, Dxz4). The horizontal lines inside violin plots represent the 25th, 50th and 75th percentiles. Red circle represents the mean ± s.d. Mean fold enrichment for Xist RIP is 36 ± 20 s.d. (C) Forced nuclear localization of CRY2-mCherry constructs harboring the short or the long SATB1 isoform IDR and the SV40 NLS displayed no protein association in response to 488 nm laser activation. Scale bar 5 μm. (D) The S635A mutation, preventing phosphorylation of the short SATB1 isoform highly increased the aggregation propensity of the corresponding CRY2-mCherry-IDR construct. Green arrows indicate cells with the SATB1 aggregates. (E) Murine Satb1 transcripts reconstructed based on deeply-sequenced stranded-total-RNA-seq data. Both long and short Satb1 isoforms were produced from multiple promoters. The long SATB1 isoform binding sites were retrieved from GSE173446 (Zelenka et al., 2022). (F) Human TCGA breast cancer (BRCA) patient-specific ATAC-seq peaks (Corces et al., 2018) span the extra exon (EE; labeled in green) of the long SATB1 isoform. Note the differential chromatin accessibility in seven selected patients, emphasizing the heterogeneity of SATB1 chromatin accessibility in cancer. Chromatin accessibility at the promoter of housekeeping gene DNMT1 is shown as a control. (G) Increased ATAC-seq signal in human breast cancer patients is positively correlated with the expression of the short SATB1 isoform and negatively correlated with the long isoform expression. (H) In human breast cancer patients, high pathological T categories (indicating bigger extent of the primary tumor, presumably indicating worse prognosis; labeling based on the TNM cancer staging system) were associated with higher expression of the long SATB1 isoform. In contrast, the expression of the short SATB1 isoform was negatively correlated with the pathological T categories. Median RNA expression values for both isoforms based on all transcripts with non-zero expression values are displayed. Red circles represent the median values.

References

    1. Agarwal A., Arora L., Rai S. K., Avni A., Mukhopadhyay S. (2022). Spatiotemporal modulations in heterotypic condensates of prion and α-synuclein control phase transitions and amyloid conversion. Nat. Commun. 13, 1154. 10.1038/s41467-022-28797-5 - DOI - PMC - PubMed
    1. Agostini F., Cirillo D., Bolognesi B., Tartaglia G. G. (2013). X-Inactivation: quantitative predictions of protein interactions in the xist network. Nucleic Acids Res. 41, e31. 10.1093/nar/gks968 - DOI - PMC - PubMed
    1. Alberti S., Gladfelter A., Mittag T. (2019). Considerations and challenges in studying liquid-liquid phase separation and biomolecular condensates. Cell 176, 419–434. 10.1016/j.cell.2018.12.035 - DOI - PMC - PubMed
    1. Aliahmad P., Kadavallore A., de la Torre B., Kappes D., Kaye J. (2011). TOX is required for development of the CD4 T cell lineage gene program. J. Immunol. 187, 5931–5940. 10.4049/jimmunol.1101474 - DOI - PMC - PubMed
    1. Aliahmad P., Kaye J. (2008). Development of all CD4 T lineages requires nuclear factor TOX. J. Exp. Med. 205, 245–256. 10.1084/jem.20071944 - DOI - PMC - PubMed