. 2023 Aug 10:11:1110681.
doi: 10.3389/fcell.2023.1110681. eCollection 2023.

Juno and CD9 protein network organization in oolemma of mouse oocyte

Affiliations

Juno and CD9 protein network organization in oolemma of mouse oocyte

Michaela Frolikova et al. Front Cell Dev Biol. .

Abstract

Juno and CD9 protein, expressed in oolemma, are known to be essential for sperm-oocyte binding and fusion. Although evidence exists that these two proteins cooperate, their interaction has not yet been demonstrated. Here in, we present Juno and CD9 mutual localization over the surface of mouse metaphase II oocytes captured using the 3D STED super-resolution technique. The precise localization of examined proteins was identified in different compartments of oolemma such as the microvillar membrane, planar membrane between individual microvilli, and the membrane of microvilli-free region. Observed variance in localization of Juno and CD9 was confirmed by analysis of transmission and scanning electron microscopy images, which showed a significant difference in the presence of proteins between selected membrane compartments. Colocalization analysis of super-resolution images based on Pearson's correlation coefficient supported evidence of Juno and CD9 mutual position in the oolemma, which was identified by proximity ligation assay. Importantly, the interaction between Juno and CD9 was detected by co-immunoprecipitation and mass spectrometry in HEK293T/17 transfected cell line. For better understanding of experimental data, mouse Juno and CD9 3D structure were prepared by comparative homology modelling and several protein-protein flexible sidechain dockings were performed using the ClusPro server. The dynamic state of the proteins was studied in real-time at atomic level by molecular dynamics (MD) simulation. Docking and MD simulation predicted Juno-CD9 interactions and stability also suggesting an interactive mechanism. Using the multiscale approach, we detected close proximity of Juno and CD9 within microvillar oolemma however, not in the planar membrane or microvilli-free region. Our findings show yet unidentified Juno and CD9 interaction within the mouse oolemma protein network prior to sperm attachment. These results suggest that a Juno and CD9 interactive network could assist in primary Juno binding to sperm Izumo1 as a prerequisite to subsequent gamete membrane fusion.

Keywords: CD9; Juno; MD simulation; STED; docking; oocyte; oolemma compartments; protein interaction.


Conflict of interest statement

The authors declare that the research was conducted in the absence of any commercial or financial relationships that could be construed as a potential conflict of interest.

Figures

FIGURE 1
FIGURE 1
Visualization of Juno and CD9 localization in oolemma captured by 3D STED. Imaging of Juno (green) and CD9 (red) in oolemma (A–C) in whole oocyte surface visualized by maximal intensity projection, (D–F) in one plane and (G–I) in selected area of one plane. The asterisk (*) indicates microvilli-free region. Scale bar represents 10 μm (A–F), 5 μm (G–I). For more details see Supplementary Video S1.
FIGURE 2
FIGURE 2
Visualization of the mutual position of Juno and CD9 in super-resolution images captured by 3D STED. (A) Imaging of Juno (green) and CD9 (red) in oolemma in whole oocyte surface visualized by maximal intensity projection and (B) in one plane. (C) A top and bottom segment of oocyte was captured for analysis of Juno and CD9 mutual localization within oolemma. (D–F′) The representative image analyzed by Imaris software shows the colocalization area (white) of the studied proteins in a top and bottom segment (D), in selected area of oolemma (E) and in an individual plane (F,F′). The asterisk (*) indicates polar body. Scale bar represents 10 μm (A–D), 5 μm (E). For details see Supplementary Videos S2, S3.
FIGURE 3
FIGURE 3
Study of close proximity of Juno and CD9 in mouse oocyte oolemma by PLA. (A) The presence of positive signal (red dots) on the sample stained by Juno and CD9 and visualized by maximal intensity projection, confirmed the existence of their close proximity, (B) α and β tubulin-stained sample was used as a positive control of the method. (C) Combination of α tubulin and CD9 staining was used as a negative control. Chromosomes are visualized with Dapi (blue). Scale bar represents 10 μm.
FIGURE 4
FIGURE 4
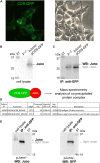
Analysis of Juno-CD9 protein-protein interaction via co-immunoprecipitation and MS. (A) HEK293T/17 cells were co-transfected with Juno and CD9-GFP mouse plasmids (pJuno/pCD9-GFP). CD9 protein was visualized in the cell membrane immediately after transfection via fluorescent GFP-tag (green); BF (bright field). (B) Juno protein expression was confirmed by WB and visualized by anti-Juno antibody. (C) Juno-CD9 complex was precipitated via GFP-tag on CD9 using anti-GFP antibody. CD9-bound target protein Juno was detected by using WB analysis with anti-Juno antibody (∼28 kDa); ST–molecular standards. (D) Schematic figure depicting MS analysis of the protein complex, which was bound to immunobeads. Database-search algorithms (bioinformatics) were used to identify specific proteins based on their mass spectra; see raw data files Table 1 MS_IP; Table 2 MS_IP control; https://biobox.biocev.org/index.php/s/4NCxYE2ckAJ4eCP). For both WB and MS the non-transfected HEK293T/17 cells were used as a negative control (p−/−), and neither CD9 nor Juno was detected and identified. (E) As a control for GFP-tag antibody specificity, the Juno and GFP antibody detection was performed in the anti-GFP immunoprecipitate (IP) and in Juno transfected cell lysate (pJuno/–), respectively; ST–molecular standards.
FIGURE 5
FIGURE 5
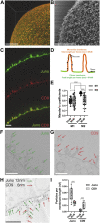
Localization of Juno and CD9 in MvM and PlnM compartments of microvilli-rich oolemma. (A) STED microscopy visualization of microvilli (B) SEM visualization of microvilli. (C) STED imaging revealed differences in Juno (green) and CD9 (red) localization within MvM and PlnM compartments of oolemma. (D) Scheme represents dividing the individual oolemma compartments for image analyzis of STED and TEM data. (E) Comparison of the localization of Juno and CD9 in MvM and PlnM separately in the segmented regions of oolemma shows significant difference between Meander’s coefficient 1 (M1) and Meander’s coefficient 2 (M2) in PlnM and significant difference in Meander’s coefficient 2 (M2) between MvM and PlnM regions. (F–H) Juno and CD9 differences captured by TEM, Juno (green arrows) was present in both MvM and PlnM in contrast to CD9 (red arrows) which was mainly detected in MvM. (I) TEM image analysis confirmed significant differences in localization Juno and CD9 both between MvM and PlnM compartments. Scale bar represents 10 μm (A), 1 μm (C) 500 nm (B,F–H). p-value equal or lower 0.05 was considered to be significant (p ≤ 0.001***). n–number of golden particles, l–total length per frame (nm), n/l–number of particles on total length per frame.
FIGURE 6
FIGURE 6
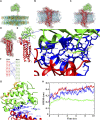
Juno-CD9 interactive model within the oocyte oolemma. (A–C) Biologically relevant position of Juno and CD9, shown by interacting pose in the membrane model for (A) Juno, (B) CD9, (C) Juno-CD9 prepared in CHARMM-GUI. (D) Energetically adequate and biologically most favorable and significant docked pose of Juno-CD9. (E) Interacting amino acids of Juno and CD9, where 26 hydrogen bonds were formed between Juno and CD9, and the distances between donor hydrogen and acceptor can be seen. (F) Responsible amino acids from Juno and CD9 responsible for hydrogen bonds formation and Juno-CD9 complex formations. (G) Juno-CD9 docked pose, where blue marked residues from Juno and CD9 are interacting for making the complex, whereas the orange residues were identified (either by docking or human Izumo1-Juno crystal analysis) for interacting with Izumo1. (H) RMSD plot for Juno (green), CD9 (red), and Juno and CD9 complex (blue). Based on RMSD analysis, Juno maintain the highest level of stability around 2.2 Å, CD9 showed highest deviation around 5.5 Å, whereas Juno and CD9 complex displayed deviation, 3.6 Å, in the middle between CD9 and Juno readings. The Juno-CD9 complex was reflected by highly stable conformation during the MD simulation which indicated a stable biological relevant structural conformation of Juno and CD9 complex.

Similar articles

Cited by

References

    1. Alam M. S. (2018). Proximity ligation assay (PLA). Curr. Protoc. Immunol. 123 (1), e58. 10.1002/cpim.58 - DOI - PMC - PubMed
    1. Andreu Z., Yáñez-Mó M. (2014). Tetraspanins in extracellular vesicle formation and function. Front. Immunol. 5, 442. 10.3389/fimmu.2014.00442 - DOI - PMC - PubMed
    1. Benammar A., Ziyyat A., Lefèvre B., Wolf J. P. (2017). Tetraspanins and mouse oocyte microvilli related to fertilizing ability. Reprod. Sci. 24 (7), 1062–1069. 10.1177/1933719116678688 - DOI - PubMed
    1. Bianchi E., Wright G. J. (2016). Sperm meets egg: the Genetics of mammalian fertilization. Annu. Rev. Genet. 50, 93–111. 10.1146/annurev-genet-121415-121834 - DOI - PubMed
    1. Bianchi E., Wright G. J. (2020). Find and fuse: unsolved mysteries in sperm–egg recognition. PLOS Biol. 18 (11), e3000953. 10.1371/journal.pbio.3000953 - DOI - PMC - PubMed

LinkOut - more resources