. 2023 Aug 10:11:1240125.
doi: 10.3389/fbioe.2023.1240125. eCollection 2023.

Fatigue life of 3D-printed porous titanium dental implants predicted by validated finite element simulations

Affiliations

Fatigue life of 3D-printed porous titanium dental implants predicted by validated finite element simulations

Antoine Vautrin et al. Front Bioeng Biotechnol. .

Abstract

Introduction: Porous dental implants represent a promising strategy to reduce failure rate by favoring osseointegration or delivering drugs locally. Incorporating porous features weakens the mechanical capacity of an implant, but sufficient fatigue strength must be ensured as regulated in the ISO 14801 standard. Experimental fatigue testing is a costly and time-intensive part of the implant development process that could be accelerated with validated computer simulations. This study aimed at developing, calibrating, and validating a numerical workflow to predict fatigue strength on six porous configurations of a simplified implant geometry. Methods: Mechanical testing was performed on 3D-printed titanium samples to establish a direct link between endurance limit (i.e., infinite fatigue life) and monotonic load to failure, and a finite element model was developed and calibrated to predict the latter. The tool was then validated by predicting the fatigue life of a given porous configuration. Results: The normalized endurance limit (10% of the ultimate load) was the same for all six porous designs, indicating that monotonic testing was a good surrogate for endurance limit. The geometry input of the simulations influenced greatly their accuracy. Utilizing the as-designed model resulted in the highest prediction error (23%) and low correlation between the estimated and experimental loads to failure (R2 = 0.65). The prediction error was smaller when utilizing specimen geometry based on micro computed tomography scans (14%) or design models adjusted to match the printed porosity (8%). Discussion: The validated numerical workflow presented in this study could therefore be used to quantitatively predict the fatigue life of a porous implant, provided that the effect of manufacturing on implant geometry is accounted for.

Keywords: additive manufacturing; dental implant; fatigue; finite element analysis; micro-CT; porous titanium.


Conflict of interest statement

Authors JA and EA are employed by Attenborough Dental Laboratories Ltd. The remaining authors declare that the research was conducted in the absence of any commercial or financial relationships that could be construed as a potential conflict of interest.

Figures

FIGURE 1
FIGURE 1
FE-based workflow for fatigue life prediction consisting of two loops. The three constitutive relationships of the model (between fatigue loading and number of cycles to failure, between experimental and simulated ultimate monotonic load, and between CAD and printed geometries) were determined in the calibration loop by combining µCT imaging, mechanical testing, and FE modeling. In the validation loop, the endurance limit of a separate set of designs was predicted using the calibrated models to assess the accuracy of the workflow.
FIGURE 2
FIGURE 2
(A) Porous sample geometry and (B) unit cell models of the six porous configurations manufactured by 3D printing.
FIGURE 3
FIGURE 3
Experimental and computational testing (A) description of the test setup based on BS EN ISO 14801; (B) experimental test setup used for monotonic and fatigue testing; (C) zoom-in view on the 60SP sample mounted in the testing machine; (D) representation of the FE model of the 60SP CAD geometry and boundary conditions replicating the experimental setup: blocked displacement under the embedding plane and load applied to the top of the sample at 30° off-axis to the contact surface.
FIGURE 4
FIGURE 4
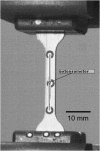
Tensile testing setup captured by the Aramis tracking system. The green line corresponds to the landmarks-based extensometer.
FIGURE 5
FIGURE 5
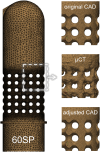
FE mesh of the 60SP design (left) with zoomed sections of the porous part for the tree types of geometry used in the simulations: original CAD, µCT-based and adjusted CAD (right).
FIGURE 6
FIGURE 6
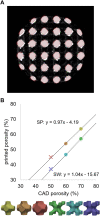
(A) µCT cross-section of a 60SP sample in grayscales with the CAD model overlayed with red hatches. (B) Relationship between the porosities of the original CAD models and the 3D-printed samples determined by µCT imaging. Unit cell type-wise linear regressions performed on the calibration dataset (circles) provided accurate predictions for the validation designs (crosses).
FIGURE 7
FIGURE 7
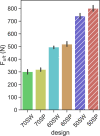
Ultimate load levels measured for each porous configuration. the solid and hatched bars indicate the calibration and validation designs, respectively. Error bars indicate 95% confidence interval.
FIGURE 8
FIGURE 8
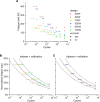
Results of the fatigue failure tests. (A) Absolute fatigue load magnitude versus cycles to failure for all six pore configurations. (B) and (C) Same data with the fatigue load normalized to the monotonic ultimate load for the calibration (B) and validation (C) sample sets. The power law fitted on the calibration dataset is represented as a solid line with the dotted lines being its 95% confidence interval.
FIGURE 9
FIGURE 9
Comparison of the experimental ultimate load with the FE-predicted ultimate load for the three different model geometries (µCT, adjusted CAD and original CAD), with the latter determined using a plastic displacement offset set at 0.07 mm. The dotted lines represent the linear regression determined on the calibration dataset (circles), indicating good fit for the validation set (crosses) for the adjusted CAD approach.
FIGURE 10
FIGURE 10
FE-based predictions of monotonic ultimate load (left) and fatigue endurance limit (right) compared with the corrsponding experimental results (pink bar: monotonic ultimate load; dotted lines: endurance limit, comprised between 10% and 15% of Fult ). The error bars represent the 95% confidence intervals computed either on the four samples tested monotonically (monotonic testing) or on the four µCT-based FE results (FE - µCT).

References

    1. Amin Yavari S., Wauthle R., van der Stok J., Riemslag A. C., Janssen M., Mulier M., et al. (2013). Fatigue behavior of porous biomaterials manufactured using selective laser melting. Mat. Sci. Eng. C 33, 4849–4858. 10.1016/j.msec.2013.08.006 - DOI - PubMed
    1. Benedetti M., Du Plessis A., Ritchie R. O., Dallago M., Razavi S. M. J., Berto F. (2021). Architected cellular materials: a review on their mechanical properties towards fatigue-tolerant design and fabrication. Mat. Sci. Eng. R. Rep. 144, 100606. 10.1016/j.mser.2021.100606 - DOI
    1. Chakraborty A., Datta P., Majumder S., Mondal S. C., Roychowdhury A. (2020). Finite element and experimental analysis to select patient’s bone condition specific porous dental implant, fabricated using additive manufacturing. Comput. Biol. Med. 124, 103839. 10.1016/j.compbiomed.2020.103839 - DOI - PubMed
    1. Chen H., Han Q., Wang C., Liu Y., Chen B., Wang J. (2020). Porous scaffold design for additive manufacturing in orthopedics: a review. Front. Bioeng. Biotechnol. 8, 609. 10.3389/fbioe.2020.00609 - DOI - PMC - PubMed
    1. Dallago M., Fontanari V., Torresani E., Leoni M., Pederzolli C., Potrich C., et al. (2018). Fatigue and biological properties of Ti-6Al-4V ELI cellular structures with variously arranged cubic cells made by selective laser melting. J. Mech. Behav. Biomed. Mat. 78, 381–394. 10.1016/j.jmbbm.2017.11.044 - DOI - PubMed