. 2023 Aug 10:13:1127645.
doi: 10.3389/fonc.2023.1127645. eCollection 2023.

Glioblastoma survival is associated with distinct proteomic alteration signatures post chemoirradiation in a large-scale proteomic panel

Affiliations

Glioblastoma survival is associated with distinct proteomic alteration signatures post chemoirradiation in a large-scale proteomic panel

Andra Valentina Krauze et al. Front Oncol. .

Erratum in

Abstract

Background: Glioblastomas (GBM) are rapidly progressive, nearly uniformly fatal brain tumors. Proteomic analysis represents an opportunity for noninvasive GBM classification and biological understanding of treatment response.

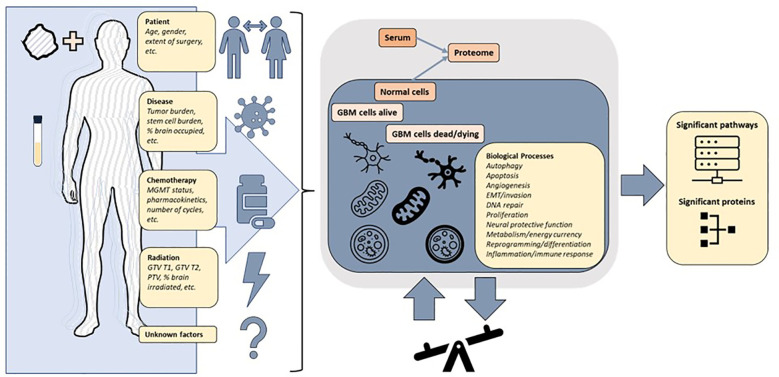
Purpose: We analyzed differential proteomic expression pre vs. post completion of concurrent chemoirradiation (CRT) in patient serum samples to explore proteomic alterations and classify GBM by integrating clinical and proteomic parameters.

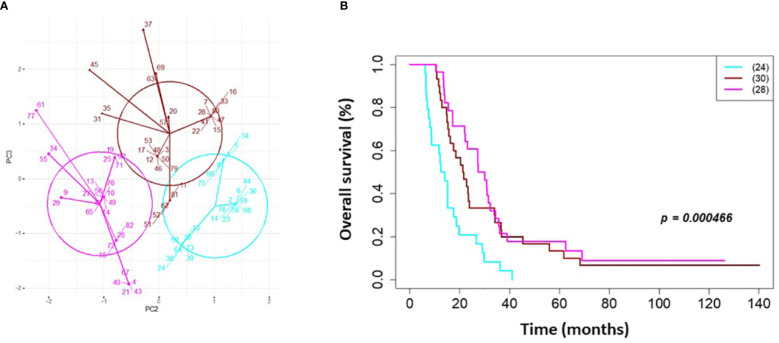
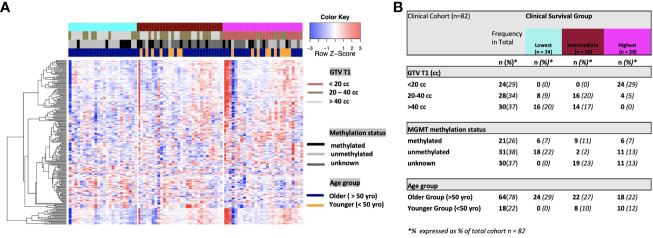
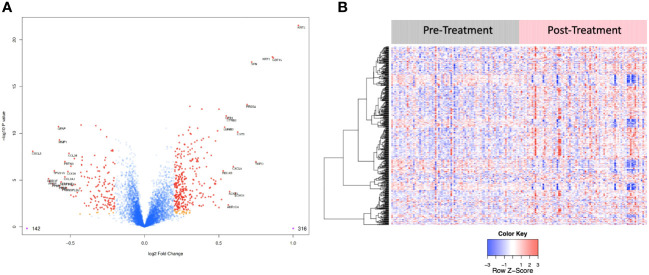
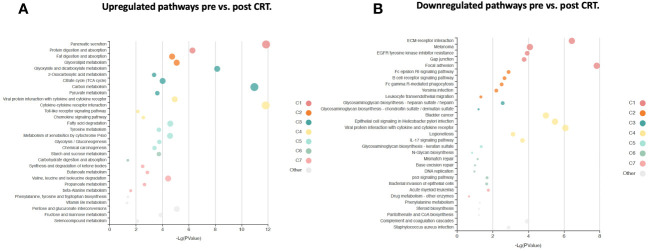
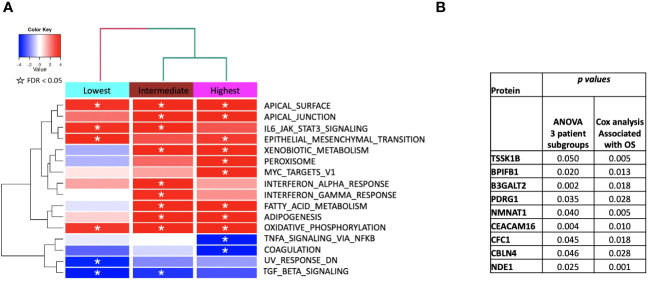
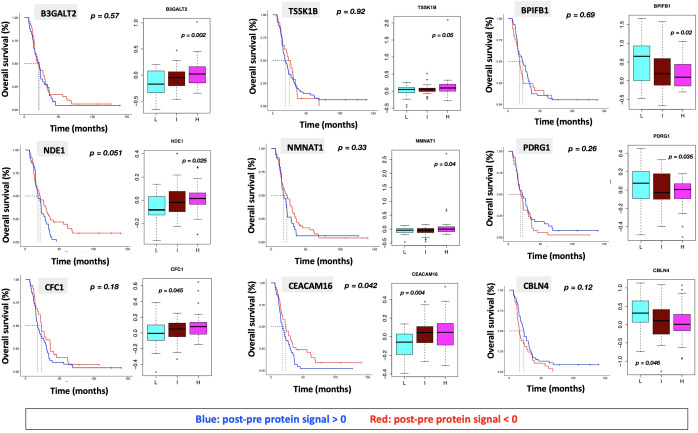
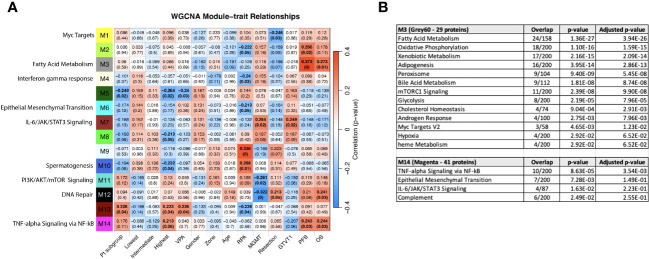
Materials and methods: 82 patients with GBM were clinically annotated and serum samples obtained pre- and post-CRT. Serum samples were then screened using the aptamer-based SOMAScan® proteomic assay. Significant traits from uni- and multivariate Cox models for overall survival (OS) were designated independent prognostic factors and principal component analysis (PCA) was carried out. Differential expression of protein signals was calculated using paired t-tests, with KOBAS used to identify associated KEGG pathways. GSEA pre-ranked analysis was employed on the overall list of differentially expressed proteins (DEPs) against the MSigDB Hallmark, GO Biological Process, and Reactome databases with weighted gene correlation network analysis (WGCNA) and Enrichr used to validate pathway hits internally.

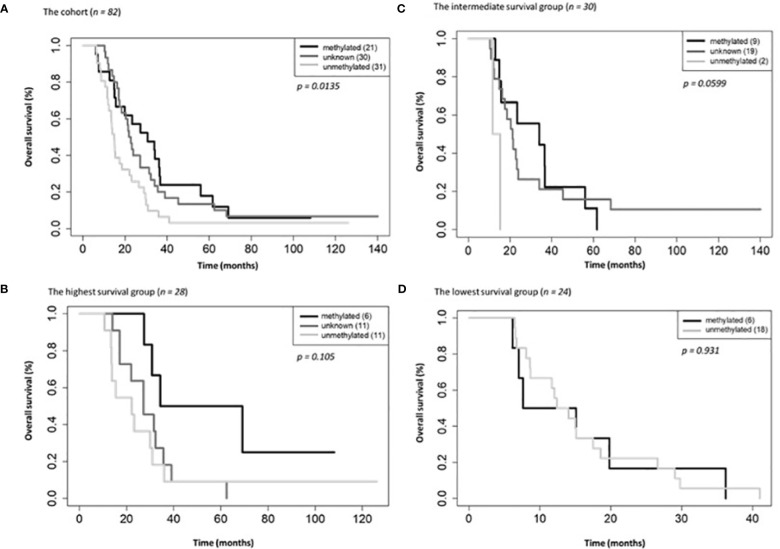
Results: 3 clinical clusters of patients with differential survival were identified. 389 significantly DEPs pre vs. post-treatment were identified, including 284 upregulated and 105 downregulated, representing several pathways relevant to cancer metabolism and progression. The lowest survival group (median OS 13.2 months) was associated with DEPs affiliated with proliferative pathways and exhibiting distinct oppositional response including with respect to radiation therapy related pathways, as compared to better-performing groups (intermediate, median OS 22.4 months; highest, median OS 28.7 months). Opposite signaling patterns across multiple analyses in several pathways (notably fatty acid metabolism, NOTCH, TNFα via NF-κB, Myc target V1 signaling, UV response, unfolded protein response, peroxisome, and interferon response) were distinct between clinical survival groups and supported by WGCNA. 23 proteins were statistically signficant for OS with 5 (NETO2, CST7, SEMA6D, CBLN4, NPS) supported by KM.

Conclusion: Distinct proteomic alterations with hallmarks of cancer, including progression, resistance, stemness, and invasion, were identified in serum samples obtained from GBM patients pre vs. post CRT and corresponded with clinical survival. The proteome can potentially be employed for glioma classification and biological interrogation of cancer pathways.

Keywords: classification; genomic; glioma; proteomic; radiation.


Conflict of interest statement

The authors declare that the research was conducted in the absence of any commercial or financial relationships that could be construed as a potential conflict of interest.

Figures

Figure 1
Figure 1
Clinical clustering. Patient clustering based on clinical features associated with overall survival. (A) Principal component analysis cluster plot based on PC3 and PC2 correlated with overall survival time based on age, MGMT methylation status, and GTV T1 with Cox proportional hazard p-values < 0.05. Circles represent clusters of patients (n=82). A point with a number indicates the patient study ID. (B) Overall survival by clinical cluster. Cyan = lowest survival. Purple =intermediate survival. Pink = highest survival.
Figure 2
Figure 2
(A) Heat map of clinical clustering and proteomic signal following overall survival analysis based on GTV T1, MGMT methylation status, and age group with Cox proportional hazard p-values < 0.05. The dendrogram represents 221 significantly expressed proteins pre- vs. post-treatment. Unknown methylation status is represented by the color light grey. (B) Frequencies of clinical factors in whole cohort and clinical survival group (GTV T1, MGMT methylation status and age group) broken down by survival group n (expressed as % of total cohort n =82).
Figure 3
Figure 3
Overall survival by MGMT methylations status for the entire cohort (A), the highest (B), intermediate (C) and lowest (D) survival groups.
Figure 4
Figure 4
(A) Volcano plot of differentially expressed proteins pre vs. post treatment. Red dots represent the significant proteins that passed cut-off (|Log2FC| > 0.2 & FDR < 0.05) (458 proteins). Orange dots represent the poteins with |Log2FC| > 0.2 but not FDR < 0.05. Blue dots represent proteins that are not significant (i.e., did not pass either threshold). 316 proteins were up regulated, and 142 proteins were downregulated. The top 15 proteins that decreased in value (left aspect of plot) and those that increased in value (right aspect of plot) based on |FC| were labeled with the identified proteins’ names. (B) Heat map representation of the expression levels of selected, differential expressed proteins (N=458) pre vs. post treatment.
Figure 5
Figure 5
KOBAS bubble plot of KEGG pathways enriched in the set of significantly differentially expressed proteins between pre- and post-treatment based on a paired t-test. (A) Upregulated genes (FDR < 0.05).. (B) Downregulated genes (FDR < 0.05).. The bubble size reflects the KOBAS hypergeometric test p-value broken into the following ranges (smallest to largest): [0.05,1], [0.01,0.05), [0.001,0.01), [0.0001,0.001), [1e-10,0.0001), [0,1e-10). Colors reflect clusters of related pathways. Clusters of pathways are determined by creating edges if the Jaccard Index between pathways is larger than 0.35 and then clustering using the Infomap algorithm.
Figure 6
Figure 6
(A) ssGSEA2.0 associations with Hallmark pathways for proteins differentially expressed within patient subgroups. Paired t-tests were run within each of the patient subgroups from Figure 1. These results were fed into ssGSEA2.0 and significant pathways (FDR < 0.05) in at least one of the three subgroups were selected. The heatmap shows the GSEA normalized enrichment score. (B) The 9 proteins statistically significant across the three subgroups (p value (ANOVA) < 0.05) and associated with OS in Cox analysis (p < 0.05). Kaplan Meier analysis for statistically significant proteins is shown in Supplemental Figure 1.
Figure 7
Figure 7
Overall survival analysis for 9 proteins statistically significant across the three subgroups (p value (ANOVA) < 0.05) and associated with OS in Cox analysis (p < 0.05) with associated protein signal box plots.
Figure 8
Figure 8
(A) WGCNA Protein module-clinical trait relationships heatmap for post-pre data with clinical features. The WGCNA protein modules are labeled with the MSigDB Hallmark pathways with the lowest adjusted p-value according to Enrichr. The M3 (Grey60) and M14 (Magenta) modules significantly correlate to overall survival and progression free survival. M7 (Brown) significantly correlated with MGMT methylation status and GTVT1. The top numbers indicate correlation coefficients, numbers in brackets indicate p-values. Bold indicate cells with p ≤ 0.05. (B) GO Biological Processes that are associated with the M3 and M14 modules according to Enrichr. MGMT methylation status (1= methylated, 2= unmethylated).
Figure 9
Figure 9
The protein signals in a patient with glioblastoma are reflective of a combination of factors including patient and tumor heterogeneity pre and post treatment. The changes in expression of proteins and pathways measured in the blood reflect a superposition of multiple overlapping signaling pathways. The underlying biological processes can be inferred from differentially altered pathways and proteins, but further precise multimodal measurements are required to achieve clinically actionable understanding of patient and tumor response to treatment.

Similar articles

Cited by

References

    1. Senders JT, Staples P, Mehrtash A, Cote DJ, Taphoorn MJB, Reardon DA, et al. . An online calculator for the prediction of survival in glioblastoma patients using classical statistics and machine learning. Neurosurgery (2020) 86(2):E184–92. doi: 10.1093/neuros/nyz403 - DOI - PMC - PubMed
    1. Zeng J, DeVries K, Krauze A. Patterns of failure and development of a novel prognostic scoring system in elderly patients with glioblastoma – follow up on 10 year analysis of the BC cancer agency population. in Society of Neuro-Oncology 2019. Neuro-Oncology (2019). doi: 10.1093/neuonc/noz175.575 - DOI
    1. Yanovich-Arad G, Ofek P, Yeini E, Mardamshina M, Danilevsky A, Shomron N, et al. . Proteogenomics of glioblastoma associates molecular patterns with survival. Cell Rep (2021) 34(9):108787. doi: 10.1016/j.celrep.2021.108787 - DOI - PubMed
    1. Wang LB, Karpova A, Gritsenko MA, Kyle JE, Cao S, Li Y, et al. . Proteogenomic and metabolomic characterization of human glioblastoma. Cancer Cell (2021) 39(4):509–528.e20. doi: 10.1016/j.ccell.2021.01.006 - DOI - PMC - PubMed
    1. Duhamel M, Drelich L, Wisztorski M, Aboulouard S, Gimeno JP, Ogrinc N, et al. . Spatial analysis of the glioblastoma proteome reveals specific molecular signatures and markers of survival. Nat Commun (2022) 13(1):6665. doi: 10.1038/s41467-022-34208-6 - DOI - PMC - PubMed