Identification and validation of potential hypoxia-related genes associated with coronary artery disease
- PMID: 37637145
- PMCID: PMC10447898
- DOI: 10.3389/fphys.2023.1181510
Identification and validation of potential hypoxia-related genes associated with coronary artery disease
Abstract
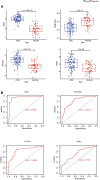
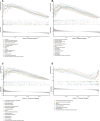
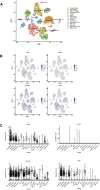
Introduction: Coronary artery disease (CAD) is one of the most life-threatening cardiovascular emergencies with high mortality and morbidity. Increasing evidence has demonstrated that the degree of hypoxia is closely associated with the development and survival outcomes of CAD patients. However, the role of hypoxia in CAD has not been elucidated. Methods: Based on the GSE113079 microarray dataset and the hypoxia-associated gene collection, differential analysis, machine learning, and validation of the screened hub genes were carried out. Results: In this study, 54 differentially expressed hypoxia-related genes (DE-HRGs), and then 4 hub signature genes (ADM, PPFIA4, FAM162A, and TPBG) were identified based on microarray datasets GSE113079 which including of 93 CAD patients and 48 healthy controls and hypoxia-related gene set. Then, 4 hub genes were also validated in other three CAD related microarray datasets. Through GO and KEGG pathway enrichment analyses, we found three upregulated hub genes (ADM, PPFIA4, TPBG) were strongly correlated with differentially expressed metabolic genes and all the 4 hub genes were mainly enriched in many immune-related biological processes and pathways in CAD. Additionally, 10 immune cell types were found significantly different between the CAD and control groups, especially CD8 T cells, which were apparently essential in cardiovascular disease by immune cell infiltration analysis. Furthermore, we compared the expression of 4 hub genes in 15 cell subtypes in CAD coronary lesions and found that ADM, FAM162A and TPBG were all expressed at higher levels in endothelial cells by single-cell sequencing analysis. Discussion: The study identified four hypoxia genes associated with coronary heart disease. The findings provide more insights into the hypoxia landscape and, potentially, the therapeutic targets of CAD.
Keywords: coronary artery disease; hypoxia; immune cell infiltration; metabolism; single-cell sequencing.
Copyright © 2023 Jin, Ren, Liu, Tang, Shi, Pan, Hou and Yang.
Conflict of interest statement
The authors declare that the research was conducted in the absence of any commercial or financial relationships that could be construed as a potential conflict of interest.
Figures


Similar articles
-
Identification of Biomarkers Associated With CD8+ T Cells in Coronary Artery Disease and Their Pan-Cancer Analysis.Front Immunol. 2022 Jun 21;13:876616. doi: 10.3389/fimmu.2022.876616. eCollection 2022. Front Immunol. 2022. PMID: 35799780 Free PMC article.
-
Identification of Hub Genes and Immune Infiltration in Coronary Artery Disease: A Risk Prediction Model.J Inflamm Res. 2024 Nov 11;17:8625-8646. doi: 10.2147/JIR.S475639. eCollection 2024. J Inflamm Res. 2024. PMID: 39553308 Free PMC article.
-
CD8+ T and NK cells characterized by upregulation of NPEPPS and ABHD17A are associated with the co-occurrence of type 2 diabetes and coronary artery disease.Front Immunol. 2024 Feb 23;15:1267963. doi: 10.3389/fimmu.2024.1267963. eCollection 2024. Front Immunol. 2024. PMID: 38464509 Free PMC article.
-
Identification of hub genes and their correlation with immune infiltration in coronary artery disease through bioinformatics and machine learning methods.J Thorac Dis. 2022 Jul;14(7):2621-2634. doi: 10.21037/jtd-22-632. J Thorac Dis. 2022. PMID: 35928610 Free PMC article.
-
Immune Cell Infiltration Analysis Based on Bioinformatics Reveals Novel Biomarkers of Coronary Artery Disease.J Inflamm Res. 2023 Jul 26;16:3169-3184. doi: 10.2147/JIR.S416329. eCollection 2023. J Inflamm Res. 2023. PMID: 37525634 Free PMC article.
Cited by
-
Mechanistic insights into the ameliorative effects of hypoxia-induced myocardial injury by Corydalis yanhusuo total alkaloids: based on network pharmacology and experiment verification.Front Pharmacol. 2024 Jan 11;14:1275558. doi: 10.3389/fphar.2023.1275558. eCollection 2023. Front Pharmacol. 2024. PMID: 38273838 Free PMC article.
References
-
- Haberka M., Machnik G., Kowalowka A., Biedron M., Skudrzyk E., Regulska-Ilow B., et al. (2019). Epicardial, paracardial, and perivascular fat quantity, gene expressions, and serum cytokines in patients with coronary artery disease and diabetes. Pol. Arch. Intern Med. 129 (11), 738–746. 10.20452/pamw.14961 - DOI - PubMed
LinkOut - more resources
Full Text Sources
Research Materials
Miscellaneous

