. 2023 Aug 11:14:1158091.
doi: 10.3389/fphar.2023.1158091. eCollection 2023.

Development of a membrane-based Gi-CASE biosensor assay for profiling compounds at cannabinoid receptors

Affiliations

Development of a membrane-based Gi-CASE biosensor assay for profiling compounds at cannabinoid receptors

Morgan Scott-Dennis et al. Front Pharmacol. .

Abstract

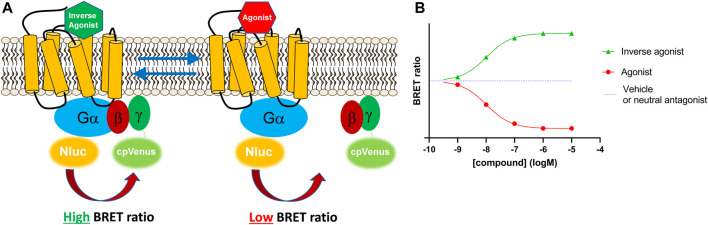
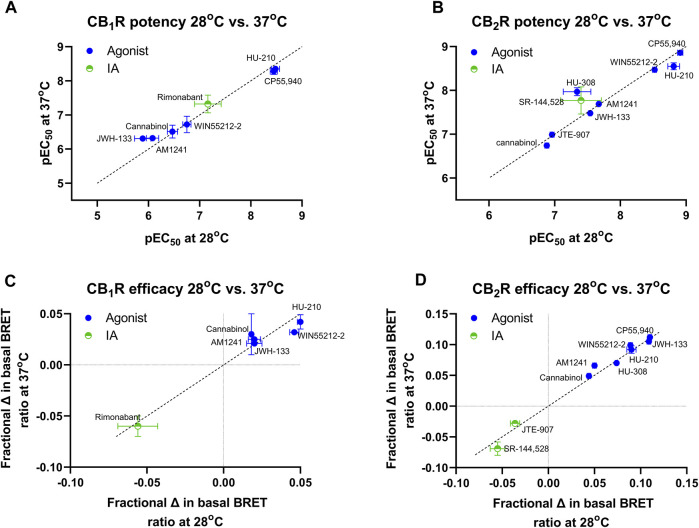
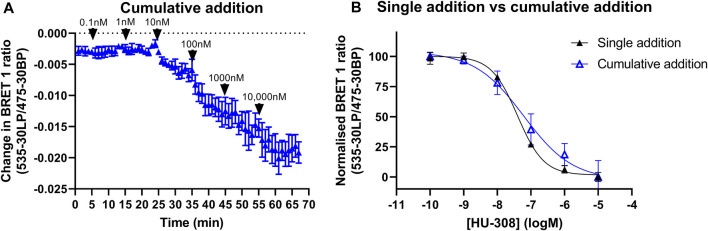
Introduction: The cannabinoid receptor (CBR) subtypes 1 (CB1R) and 2 (CB2R) are key components of the endocannabinoid system (ECS), playing a central role in the control of peripheral pain, inflammation and the immune response, with further roles in the endocrine regulation of food intake and energy balance. So far, few medicines targeting these receptors have reached the clinic, suggesting that a better understanding of the receptor signalling properties of existing tool compounds and clinical candidates may open the door to the development of more effective and safer treatments. Both CB1R and CB2R are Gαi protein-coupled receptors but detecting Gαi protein signalling activity reliably and reproducibly is challenging. This is due to the inherent variability in live cell-based assays and restrictions around the use of radioactive [35S]-GTPγS, a favoured technology for developing higher-throughput membrane-based Gαi protein activity assays. Methods: Here, we describe the development of a membrane-based Gαi signalling system, produced from membrane preparations of HEK293TR cells, stably overexpressing CB1R or CB2R, and components of the Gαi-CASE biosensor. This BRET-based system allows direct detection of Gαi signalling in both cells and membranes by monitoring bioluminescence resonance energy transfer (BRET) between the α and the βγ subunits. Cells and membranes were subject to increasing concentrations of reference cannabinoid compounds, with 10 μM furimazine added to generate RET signals, which were detected on a PHERAstar FSX plate reader, then processed using MARS software and analysed in GraphPad PRISM 9.2. Results: In membranes expressing the Gi-CASE biosensor, the cannabinoid ligands profiled were found to show agonist and inverse agonist activity. Agonist activity elicited a decrease in the BRET signal, indicative of receptor activation and G protein dissociation. Inverse agonist activity caused an increase in BRET signal, indicative of receptor inactivation, and the accumulation of inactive G protein. Our membrane-based Gi-CASE NanoBRET system successfully characterised the potency (pEC50) and efficacy (Emax) of CBR agonists and inverse agonists in a 384-well screening format. Values obtained were in-line with whole-cell Gi-CASE assays and consistent with literature values obtained in the GTPγS screening format. Discussion: This novel, membrane-based Gαi protein activation assay is applicable to other Gαi-coupled GPCRs, including orphan receptors, allowing real-time higher-throughput measurements of receptor activation.

Keywords: BRET—bioluminescence resonance energy transfer; G-protein signaling; GPCR signalling assay; Gαi signaling pathway; Gαi signalling assay; cannabinoid receptors (CBRs); inverse agonism.


Conflict of interest statement

Authors WG, AR, and UG was/were employed by F Hoffmann-La Roche Ltd. Authors DV and DS was/were employed by Z7 Biotech Limited. The remaining authors declare that the research was conducted in the absence of any commercial or financial relationships that could be construed as a potential conflict of interest.

Figures

FIGURE 1
FIGURE 1
The Gi-CASE biosensor detects G protein activity based on changes in BRET signal. (A) Gi-CASE assay signal detection. The Gi-CASE biosensor plasmid genetically incorporates a NanoLuciferase® donor on the Gα subunit and a Venus fluorescent acceptor fluorophore on the N-terminus of the Gγ subunit. Agonist-induced G protein activation results in dissociation of the Gα and Gβγ subunits causing a reduction in the BRET signal. Inverse agonist activity causes a reduction in Gα and Gβγ dissociation and promotes reassociation resulting in an increase in the relative BRET signal. (B) Simulated Gi-CASE data, shown as a change in (∆) BRET ratio for an inverse agonist (green) and agonist (red) of equal potency.
FIGURE 2
FIGURE 2
Gi-CASE activation/inhibition time courses and concentration-response curves in CB1R and CB2R-expressing HEK293TR cells, upon stimulation with reference compounds. Time courses at 37°C of (A) CB1R- or (B) CB2R-mediated Gi-CASE activation/inhibition following stimulation with HU-210, HU-308 and rimonabant or SR-144,528 at concentrations around the EC50. (C) CB1R- and (D) CB2R-mediated Gi-CASE concentration-response curves following stimulation with HU-210, HU-308 and rimonabant or SR-144,528. Data are presented as mean ± S.E.M. from three or more experiments.
FIGURE 3
FIGURE 3
Gi-CASE activation/inhibition time courses and concentration-response curves in CB1R- and CB2R-expressing HEK293TR membranes, upon stimulation with reference compounds. Time courses at 28°C of (A) CB1R- or (B) CB2R-mediated Gi-CASE activation/inhibition following stimulation with HU-210, HU-308 and rimonabant or SR-144,528 at concentrations around the EC50. (C) CB1R- and (D) CB2R-mediated Gi-CASE concentration-response curves following stimulation with HU-210, HU-308 and rimonabant or SR-144,528. Data are presented as mean ± S.E.M. from three or more experiments.
FIGURE 4
FIGURE 4
Gi-CASE activation/inhibition time courses and concentration-response curves in CB1R- and CB2R-expressing HEK293TR membranes, upon stimulation with reference compounds. Time courses at 37°C of (A) CB1R- or (B) CB2R-mediated Gi-CASE activation/inhibition following stimulation with HU-210, HU-308 and rimonabant or SR-144,528 at concentrations around the EC50. (C) CB1R- and (D) CB2R-mediated Gi-CASE concentration-response curves following stimulation with HU-210, HU-308 and rimonabant or SR-144,528. Data are presented as mean ± S.E.M. from three or more experiments.
FIGURE 5
FIGURE 5
Gi-CASE activation/inhibition concentration-response curves in CB1R- and CB2R-expressing HEK293TR membranes, upon stimulation with cannabinoid agonists, inverse agonists and neutral compounds. Gi-CASE mediated concentration-response curves obtained in membranes expressing (A) CB1R and (B) CB2R. Data are presented as mean ± S.E.M. from three or more experiments.
FIGURE 6
FIGURE 6
A comparison of CB1R and CB2R activation/inhibition potency and efficacy estimates for test compounds obtained at 28°C and 37°C in the Gi-CASE membrane assay. Compound pEC50 value comparison in (A) CB1R- and (B) CB2R-expressing Gi-CASE membranes at 28°C and 37°C. Compound intrinsic activity (efficacy) measure comparison expressed as fractional change in the basal BRET ratio in (C) CB1R- and (D) CB2R-expressing Gi-CASE membranes at 28°C and 37°C. The dashed line indicates the unity line for perfect correlation. Data are presented as mean ± S.E.M. from three or more experiments.
FIGURE 7
FIGURE 7
A direct comparison of CB1R and CB2R activation/inhibition potency and efficacy estimates for test compounds obtained at 28°C in the Gi-CASE membrane assay. Compound pEC50 values obtained in (A) CB1R- and (B) CB2R-expressing Gi-CASE membranes. Compound intrinsic activity measures (efficacy) expressed as fractional change in the basal BRET ratio at (C) CB1R and (D) CB2R. The dashed line in A and B is the lower limit of potency detection with values below this level not determined (ND). Data are presented as mean ± S.E.M. from three or more experiments.
FIGURE 8
FIGURE 8
Inverse agonist-induced shifts in CB1R- and CB2R-expressing HEK293TR membranes. HU-210 Gi-CASE concentration-response curves obtained in HEK293TR (A) CB1R membranes at 28°C, in the absence and presence of the reference CB1R inverse agonist rimonabant and (B) CB2R membranes at 28°C, in the absence and presence of the reference CB1R inverse agonist SR-144,528 (C) CB1R membranes at 37°C, in the absence and presence of rimonabant and (D) CB2R membranes at 37°C, in the absence and presence of SR-144,528. Gi-CASE response data are presented as mean ± S.E.M. from three separate experiments performed in singlet.
FIGURE 9
FIGURE 9
Gi-CASE activation time courses and concentration-response curves in CB2R-expressing HEK293TR membranes, upon stimulation with the reference agonist HU-308. Changes in Gi-CASE biosensor activation was detected by BRET in HEK293TR membranes. (A) Consecutive addition of increasing concentrations of HU-308 into the same assay wells. Data are displayed as mean ± S.E.M. from three experiments performed in triplicate. (B) Concentration-response curve of HU-308 generated from (A); 10 min after each consecutive injection of increasing HU-308 concentrations (triplicate determinations), or 60 min after stimulation of individual wells with increasing concentrations HU-308 (singlet determinations). Data are displayed as mean ± S.E.M. from three independent experiments.
FIGURE 10
FIGURE 10
Relationships between Gi-CASE and literature compound pEC50 values. Correlation plots of Gi-CASE assay in intact cell and membrane-based assay compound pEC50 values at (A) CB1R and (B) CB2R. Comparison of membrane-assay format derived (C) CB1R and (D) CB2R Gi-CASE compound pEC50 values, obtained at 28°C, and literature derived pEC50 values obtained in the commonly used GTPγS binding assay format (the source of the GTPγS binding data is provided in the Supplementary File). All Gi-CASE pEC50 values were taken from experiments shown in Figures 2, 4, 5. All data used in these plots are detailed in Table 1, 2. Data are presented as mean ± S.E.M. from three or more experiments. The dashed line indicates the unity line for perfect correlation.

Similar articles

Cited by

  • Flipping the GPCR Switch: Structure-Based Development of Selective Cannabinoid Receptor 2 Inverse Agonists.
    Kosar M, Sarott RC, Sykes DA, Viray AEG, Vitale RM, Tomašević N, Li X, Ganzoni RLZ, Kicin B, Reichert L, Patej KJ, Gómez-Bouzó U, Guba W, McCormick PJ, Hua T, Gruber CW, Veprintsev DB, Frank JA, Grether U, Carreira EM. Kosar M, et al. ACS Cent Sci. 2024 Mar 11;10(5):956-968. doi: 10.1021/acscentsci.3c01461. eCollection 2024 May 22. ACS Cent Sci. 2024. PMID: 38799662 Free PMC article.
  • A universal cannabinoid CB1 and CB2 receptor TR-FRET kinetic ligand-binding assay.
    Borrega-Roman L, Hoare BL, Kosar M, Sarott RC, Patej KJ, Bouma J, Scott-Dennis M, Koers EJ, Gazzi T, Mach L, Barrondo S, Sallés J, Guba W, Kusznir E, Nazaré M, Rufer AC, Grether U, Heitman LH, Carreira EM, Sykes DA, Veprintsev DB. Borrega-Roman L, et al. Front Pharmacol. 2025 Apr 9;16:1469986. doi: 10.3389/fphar.2025.1469986. eCollection 2025. Front Pharmacol. 2025. PMID: 40271066 Free PMC article.

References

    1. Agasid M. T., Sorensen L., Urner L. H., Yan J., Robinson C. V. (2021). The effects of sodium ions on ligand binding and conformational states of G protein-coupled receptors-insights from mass spectrometry. J. Am. Chem. Soc. 143 (11), 4085–4089. 10.1021/jacs.0c11837 - DOI - PMC - PubMed
    1. AlKhelb D., Kirunda A., Ho T. C., Makriyannis A., Desai R. I. (2022). Effects of the cannabinoid CB1-receptor neutral antagonist AM4113 and antagonist/inverse agonist rimonabant on fentanyl discrimination in male rats. Drug Alcohol Depend. 240, 109646. 10.1016/j.drugalcdep.2022.109646 - DOI - PubMed
    1. Bosier B., Muccioli G. G., Hermans E., Lambert D. M. (2010). Functionally selective cannabinoid receptor signalling: therapeutic implications and opportunities. Biochem. Pharmacol. 80 (1), 1–12. 10.1016/j.bcp.2010.02.013 - DOI - PubMed
    1. Buchwald P. (2019). A receptor model with binding affinity, activation efficacy, and signal amplification parameters for complex fractional response versus occupancy data. Front. Pharmacol. 10, 605. 10.3389/fphar.2019.00605 - DOI - PMC - PubMed
    1. Chambers A. P., Vemuri V. K., Peng Y., Wood J. T., Olszewska T., Pittman Q. J., et al. (2007). A neutral CB1 receptor antagonist reduces weight gain in rat. Am. J. Physiol. Regul. Integr. Comp. Physiol. 293 (6), R2185–R2193. 10.1152/ajpregu.00663.2007 - DOI - PubMed