. 2023 Aug 19:19:101710.
doi: 10.1016/j.bonr.2023.101710. eCollection 2023 Dec.

Bone strength is reduced in a neonatal androgenized rat model

Affiliations

Bone strength is reduced in a neonatal androgenized rat model

Lady Katerine Serrano Mujica et al. Bone Rep. .

Abstract

Background: Whether polycystic ovary syndrome (PCOS) affects bone health during a woman's lifespan remains controversial. An androgenized rodent model replicated many metabolic and reproductive features of women with PCOS, and we aimed to use it to investigate the impact of androgens on microarchitecture (by micro-CT), bone mechanical strength, bone formation and resorption markers in rats with intact ovaries (SHAM) who underwent oophorectomy.

Methods: Wistar rats (Rattus norvegicus albinus) were employed for the experiments in this study. The protocol of androgenization consisted of the application of 1.25 mg s.c. testosterone propionate beteween days 2-5 of life, while the controls received the same amount of corn oil s.c. as previously established. Androgenized SHAM rats exhibited chronic anovulation identified by vaginal cytology and a reduction in the proportion of corpus luteum in the ovary in comparison to control SHAM rats. The realization of the ovariectomy or SHAM procedure occurred on Day 100 of life. All groups (n = 8) were followed-up for 180 days to address the study endpoints.

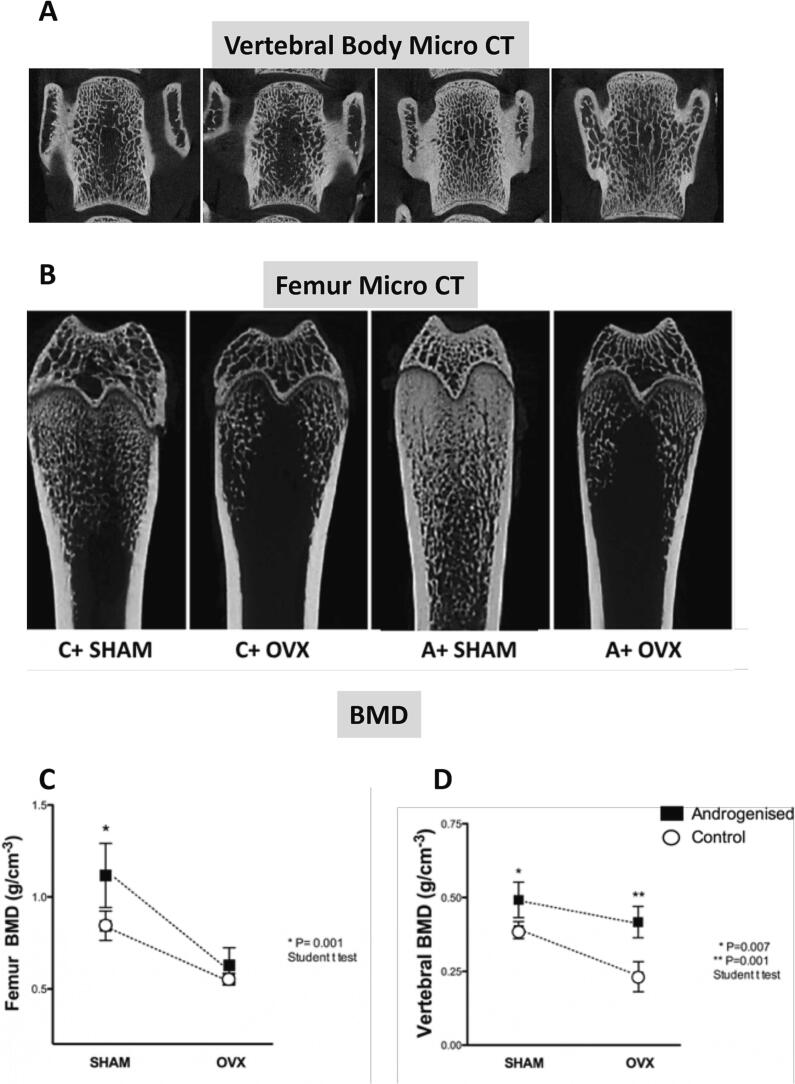
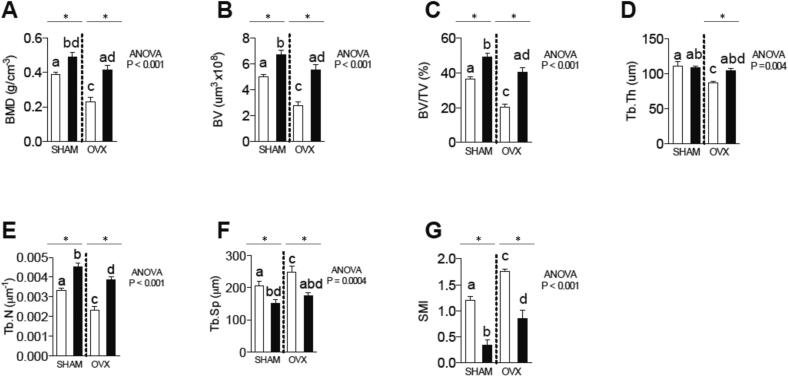
Results: Micro-CT from androgenized female rats (SHAM) showed a divergence between the trabecular and cortical bone profiles. Compared to SHAM controls, these rats had an increase in trabecular bone mass with a diminution in bone resorption C-terminal telopeptide of type 1 collagen (CTX) (p < 0.05), a concomitant decrease in cortical area and thickness in the femur, and a reduction in the strength of the femur on the mechanical test (p < 0.01).

Conclusions: Our results suggest that a reduction in the cortical thickness and cortical area observed in PCOS model rats was associated with a reduced strength of the femur, despite increased trabecular formation. Ovariectomy in the androgenized OVX group limited the progression rate of cortical bone loss, resulting in bone resistance and cortical thickness comparable to those observed in the control OVX group.

Keywords: Animal models of PCOS; Bone; Mechanical test; Polycystic ovary syndrome; microCT.


Conflict of interest statement

The authors declare that they have no known competing financial interests or personal relationships that could have appeared to influence the work reported in this paper.

Figures

Fig. 1
Fig. 1
Femur weight and length. Androgen+ OVX rats show an increase in femur weight (A) and length (B) after ovariectomy; no differences were observed in SHAM rats. Data are represented as mean ± SEM. Differences between Androgenized versus Control groups are represented by * when p < 0.05.
Fig. 2
Fig. 2
Representative micro-CT images of the distal femur and spine of the four main groups of the study and the values of bone mineral density (BMD) at both sites. Androgenized SHAM (A+ SHAM) rats exhibited a clear increase in the trabecular bone in the femur and spine in comparison to Control SHAM (C+ SHAM). After ovariectomy, the vertebral BMD remained increased in androgenized rats, while the femoral BMD was similar between the A+ OVX and C+ OVX groups. Connecting lines are a simple projection of the corresponding values between control and androgenized rats not corresponding to a mathematical equation. Data are represented as mean ± SEM. Differences between Androgenized versus Control groups are represented by * when p < 0.05.
Fig. 3
Fig. 3
Micro-CT: analysis of the trabecular and cortical bones of the femur. (A) bone mineral density (BMD g/cm); (B) bone volume (BV mm); (C) bone volume/total volume ratio (BV/TV%); (D) trabecular thickness (Tb.Th mm); (E) trabecular number (Tb.n mm); (F) trabecular separation (Tb.sp. mm); and (G) the structure model index (SMI); (H)B·Pm (bone perimeter); (I)Tt.Ar/Ct.Ar (fraction of cortical area %); (J) Ct.Th (cortical thickness mm)(K) Ma.Ar (medullary area);(L) T.Pm (total perimeter). Differences between Androgenized versus Control groups are represented by * when p < 0.05.
Fig. 4
Fig. 4
Micro-CT: analysis of the spine trabecular bone. (A) bone mineral density (BMD g/cm); (B) bone volume (BV mm); (C) bone volume/total volume ratio (BV/TV%); (D) trabecular thickness (Tb.Th mm); (E) trabecular number (Tb.n mm); (F) trabecular separation (Tb.sp. mm); and (G) the structure model index (SMI). Most of these variables were affected by neonatal androgenization and influenced by oophorectomy. Differences between Androgenized versus Control groups are represented by * when p < 0.05.
Fig. 5
Fig. 5
Levels of P1NP and CTX. (A) P1NP, a marker of bone formation, was decreased in Androgen +OVX rats in comparison to controls. No statistically significant differences were observed between Androgen+ SHAM animals and the Control+ SHAM animals. In contrast, (B) the levels of CTX, a marker of bone resorption, were decreased in Androgen + SHAM rats (p < 0.0001). A similar CTX was observed in both groups after ovariectomy (Control +OVX and Androgenized + OVX). Data are represented as mean ± SEM. Differences between Androgenized versus Control groups are represented by * when p < 0.05.
Fig. 6
Fig. 6
Mechanical test of the femur: analysis of the strength and stiffness. (A) Androgen+ SHAM rats presented a significant decrease in the strength of the bone in comparison to controls. This difference disappeared after ovariectomy. (B) Stiffness was similar among groups. Data are represented as mean ± SEM. Differences between Androgenized versus Control groups are represented by * when p < 0.05.
Fig. 7
Fig. 7
Identification of osteocytes, osteoblasts, and osteoclast in the femur. The histological identification of bone sections stained with tartarate-resistant acid phosphatase (TRAP). (A) density of osteocytes per area of trabecular bone (cells/mm2).(B) density of osteoblasts per area of trabecular bone (cells/mm2).(C) osteoclast number over bone surface area (N.Oc/Bs). Differences between Androgenized versus Control groups are represented by * when p < 0.05.

References

    1. Anzai A., et al. Impaired branched-chain amino acid metabolism may underlie the nonalcoholic fatty liver disease-like pathology of neonatal testosterone-treated female rats. Sci. Rep. 2017;7(1):13167. - PMC - PubMed
    1. Burch K.E., et al. Relationship between circulating metabolic hormones and their central receptors during Ovariectomy-induced weight gain in rats. Front. Physiol. 2021;12 - PMC - PubMed
    1. Domazetovic V., et al. Oxidative stress in bone remodeling: role of antioxidants. Clin. Cases Miner. Bone Metab. 2017;14(2):209–216. - PMC - PubMed
    1. Iantomasi T., et al. Oxidative stress and inflammation in osteoporosis: molecular mechanisms involved and the relationship with microRNAs. Int. J. Mol. Sci. 2023;24(4) - PMC - PubMed
    1. Kalyan S., et al. Competing factors link to bone health in polycystic ovary syndrome: chronic low-grade inflammation takes a toll. Sci. Rep. 2017;7(1):3432. - PMC - PubMed

LinkOut - more resources