

Double-negative-2 B cells are the major synovial plasma cell precursor in rheumatoid arthritis
- PMID: 37638026
- PMCID: PMC10450142
- DOI: 10.3389/fimmu.2023.1241474
Double-negative-2 B cells are the major synovial plasma cell precursor in rheumatoid arthritis
Abstract
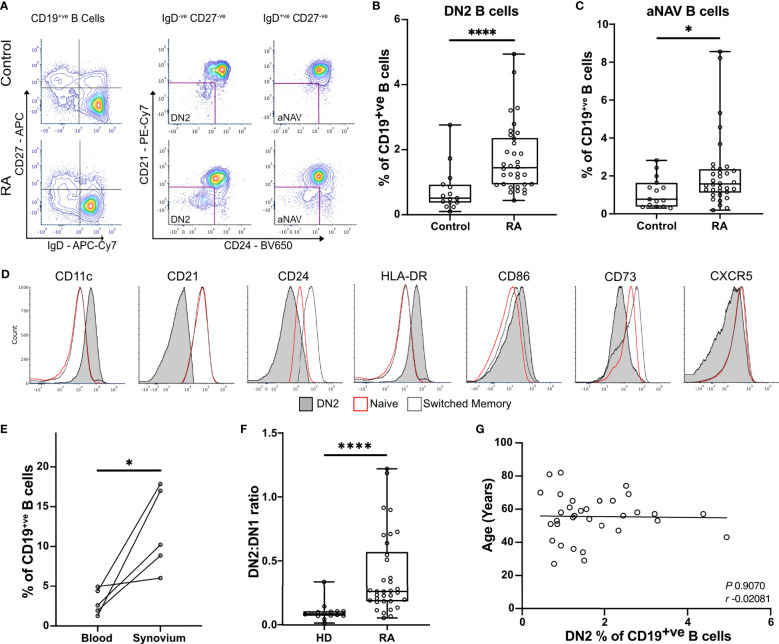
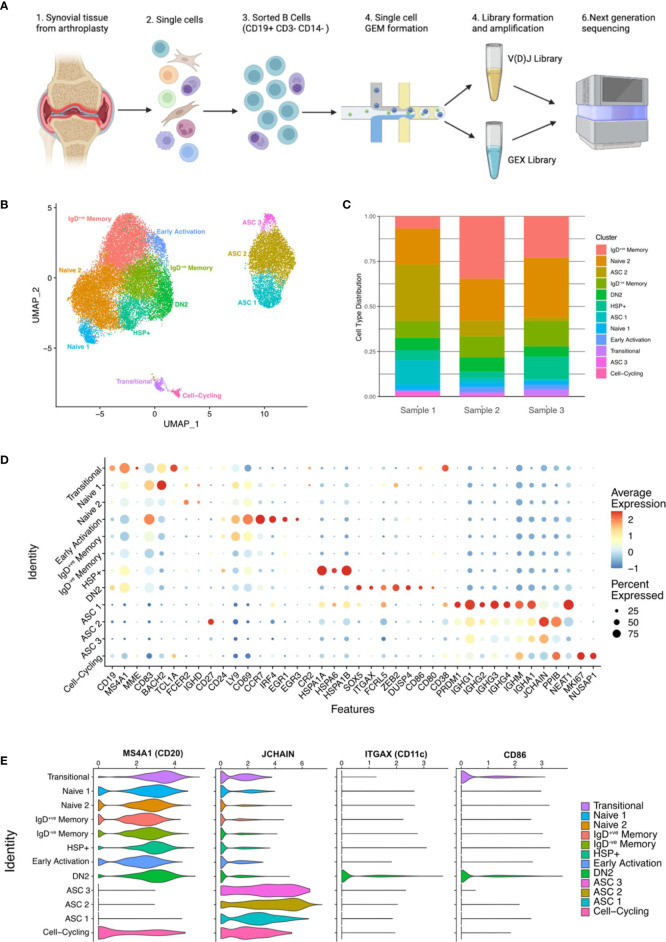
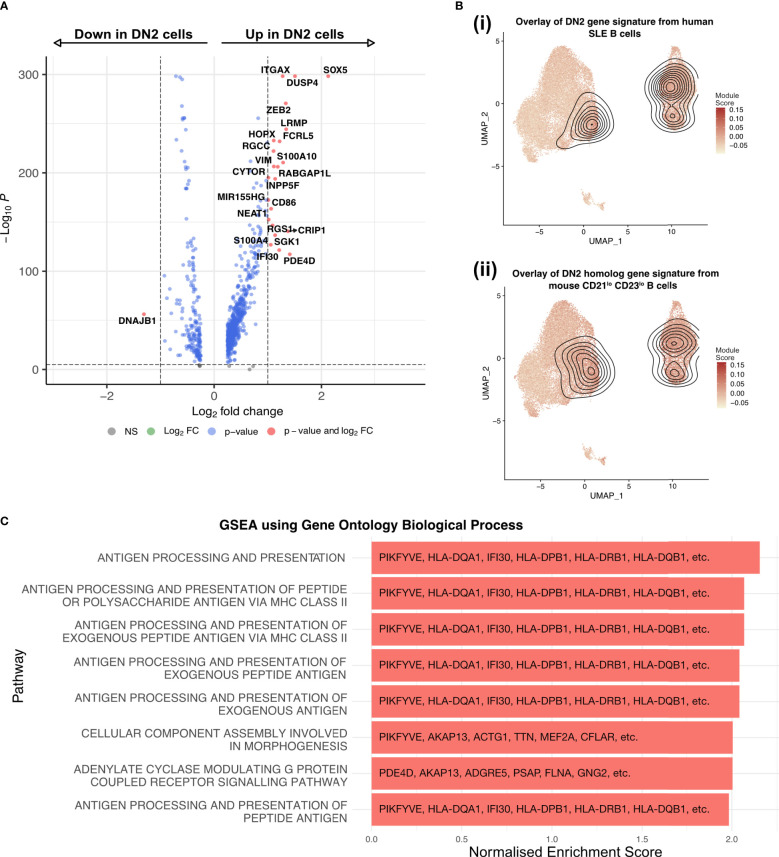
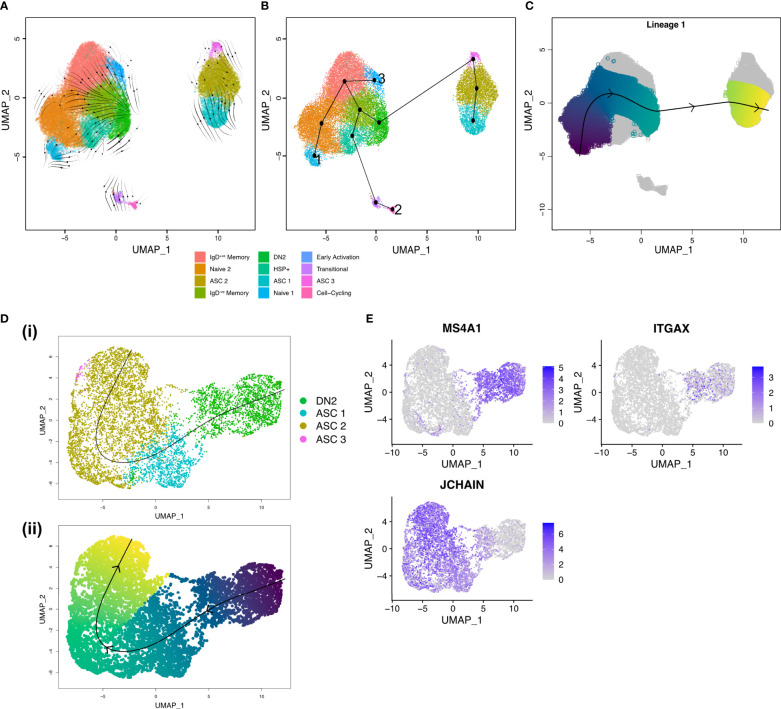
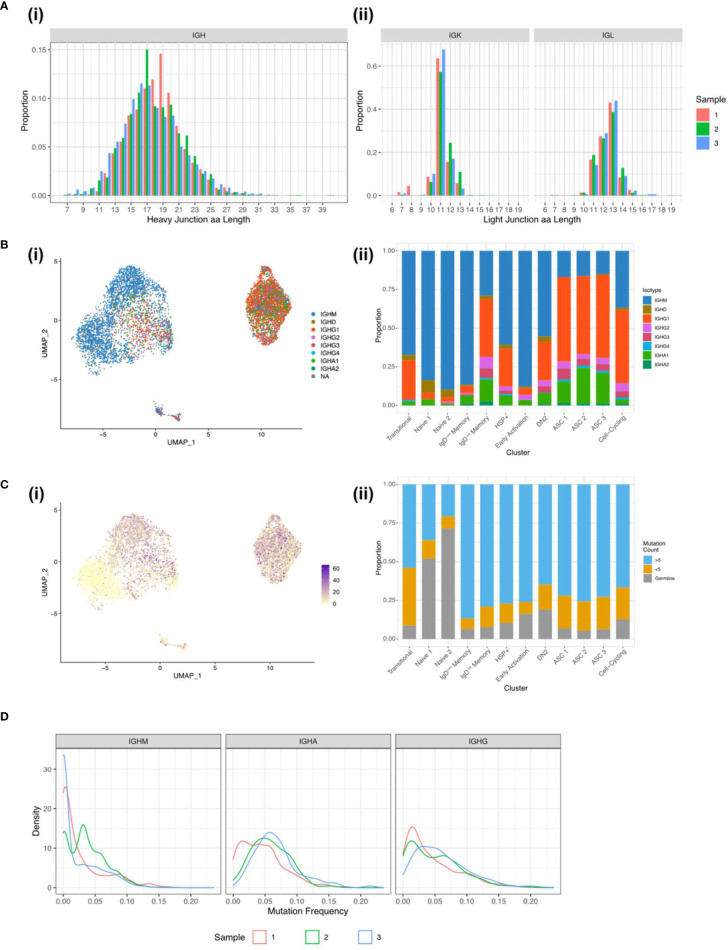
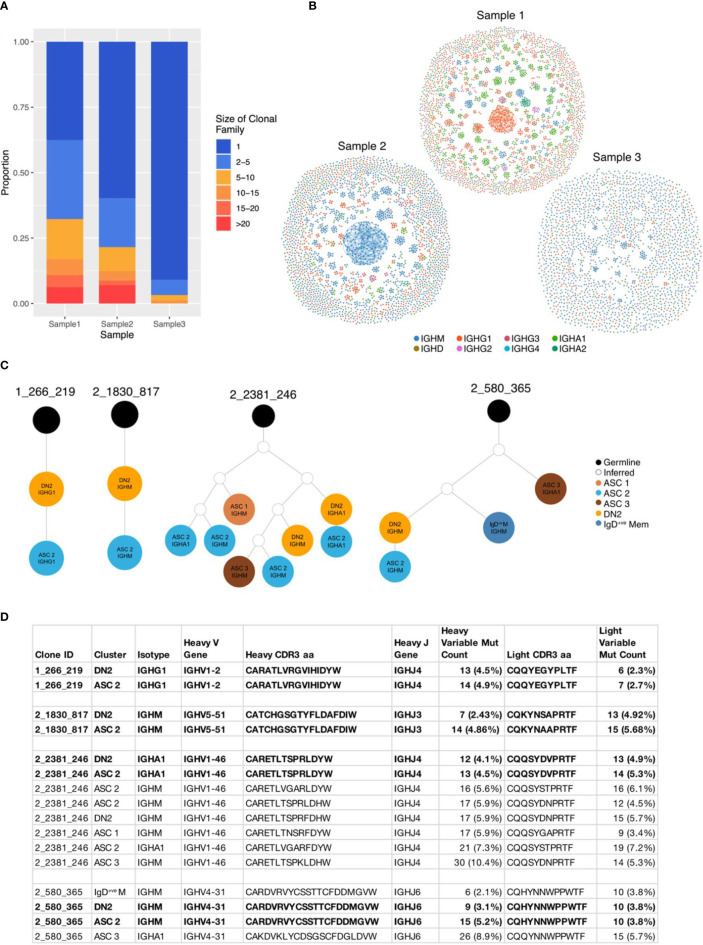
B cells are key pathogenic drivers of chronic inflammation in rheumatoid arthritis (RA). There is limited understanding of the relationship between synovial B cell subsets and pathogenic antibody secreting cells (ASCs). This knowledge is crucial for the development of more targeted B-cell depleting therapies. While CD11c+ double-negative 2 (DN2) B cells have been suggested as an ASC precursor in lupus, to date there is no proven link between the two subsets in RA. We have used both single-cell gene expression and BCR sequencing to study synovial B cells from patients with established RA, in addition to flow cytometry of circulating B cells. To better understand the differentiation patterns within the diseased tissue, a combination of RNA-based trajectory inference and clonal lineage analysis of BCR relationships were used. Both forms of analysis indicated that DN2 B cells serve as a major precursors to synovial ASCs. This study advances our understanding of B cells in RA and reveals the origin of pathogenic ASCs in the RA synovium. Given the significant role of DN2 B cells as a progenitor to pathogenic B cells in RA, it is important to conduct additional research to investigate the origins of DN2 B cells in RA and explore their potential as therapeutic targets in place of the less specific pan-B cells depletion therapies currently in use.
Keywords: antibody secreting cells; double-negative-2 (DN2) B cells; rheumatoid arthritis; single-cell sequencing; synovium.
Copyright © 2023 Wing, Sutherland, Miles, Gray, Goodyear, Otto, Breusch, Cowan and Gray.
Conflict of interest statement
The authors declare that the research was conducted in the absence of any commercial or financial relationships that could be construed as a potential conflict of interest.
Figures
Similar articles
-
The differential expressions of 78-kDa glucose-regulated protein of infiltrating plasma cells in peripheral joints with the histopathological variants of rheumatoid synovitis.Arthritis Res Ther. 2009 Jan 9;11(1):R4. doi: 10.1186/ar2588. Arthritis Res Ther. 2009. PMID: 19128512 Free PMC article.
-
Identification of HBEGF+ fibroblasts in the remission of rheumatoid arthritis by integrating single-cell RNA sequencing datasets and bulk RNA sequencing datasets.Arthritis Res Ther. 2022 Sep 6;24(1):215. doi: 10.1186/s13075-022-02902-x. Arthritis Res Ther. 2022. PMID: 36068607 Free PMC article.
-
TWEAK and Fn14 expression in the pathogenesis of joint inflammation and bone erosion in rheumatoid arthritis.Arthritis Res Ther. 2011 Mar 24;13(2):R51. doi: 10.1186/ar3294. Arthritis Res Ther. 2011. PMID: 21435232 Free PMC article.
-
B-cells and their targeting in rheumatoid arthritis--current concepts and future perspectives.Autoimmun Rev. 2011 Nov;11(1):28-34. doi: 10.1016/j.autrev.2011.06.010. Epub 2011 Jul 14. Autoimmun Rev. 2011. PMID: 21777703 Review.
-
Morphological and molecular pathology of the B cell response in synovitis of rheumatoid arthritis.Virchows Arch. 2002 Nov;441(5):415-27. doi: 10.1007/s00428-002-0702-1. Epub 2002 Nov 5. Virchows Arch. 2002. PMID: 12447670 Review.
Cited by
-
Single-cell profiling of CD11c+ B cells in atherosclerosis.Front Immunol. 2024 Jan 8;14:1296668. doi: 10.3389/fimmu.2023.1296668. eCollection 2023. Front Immunol. 2024. PMID: 38259450 Free PMC article.
-
Deep topic modeling of spatial transcriptomics in the rheumatoid arthritis synovium identifies distinct classes of ectopic lymphoid structures.bioRxiv [Preprint]. 2025 Jan 10:2025.01.08.631928. doi: 10.1101/2025.01.08.631928. bioRxiv. 2025. PMID: 39829741 Free PMC article. Preprint.
-
Disrupting B and T-cell collaboration in autoimmune disease: T-cell engagers versus CAR T-cell therapy?Clin Exp Immunol. 2024 Jun 20;217(1):15-30. doi: 10.1093/cei/uxae031. Clin Exp Immunol. 2024. PMID: 38642912 Free PMC article. Review.
-
B-Cell Receptor Repertoire: Recent Advances in Autoimmune Diseases.Clin Rev Allergy Immunol. 2024 Feb;66(1):76-98. doi: 10.1007/s12016-024-08984-6. Epub 2024 Mar 9. Clin Rev Allergy Immunol. 2024. PMID: 38459209 Review.
-
From neglect to spotlight: the underappreciated role of B cells in cutaneous inflammatory diseases.Front Immunol. 2024 Feb 15;15:1328785. doi: 10.3389/fimmu.2024.1328785. eCollection 2024. Front Immunol. 2024. PMID: 38426103 Free PMC article. Review.
References
-
- Markusse IM, Akdemir G, Dirven L, Goekoop-Ruiterman YP, van Groenendael JH, Han KH, et al. . Long-term outcomes of patients with recent-onset rheumatoid arthritis after 10 years of tight controlled treatment: A randomized trial. Ann Intern Med (2016) 164(8):523–31. doi: 10.7326/M15-0919 - DOI - PubMed
Publication types
MeSH terms
Grants and funding
LinkOut - more resources
Full Text Sources
Medical
Research Materials
Miscellaneous