Meta-Analysis
. 2023 Aug 10:14:1243516.
doi: 10.3389/fimmu.2023.1243516. eCollection 2023.

Interferome signature dynamics during the anti-dengue immune response: a systems biology characterization

Affiliations
Meta-Analysis

Interferome signature dynamics during the anti-dengue immune response: a systems biology characterization

Júlia Nakanishi Usuda et al. Front Immunol. .

Abstract

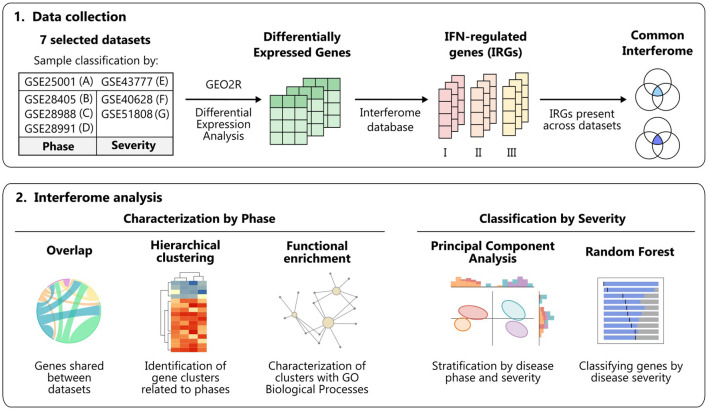
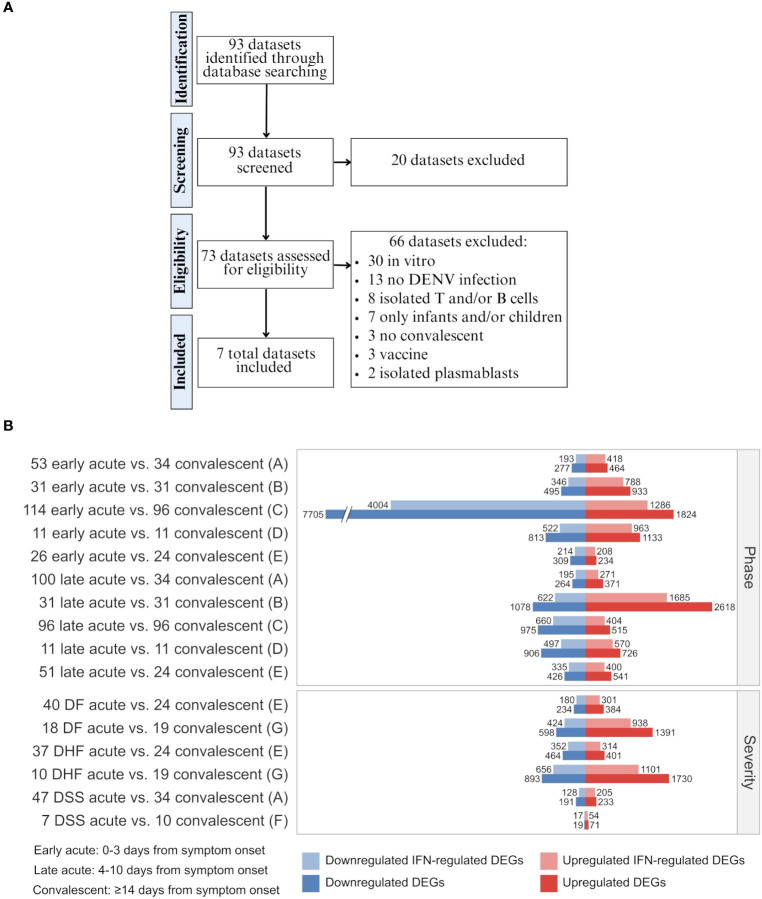
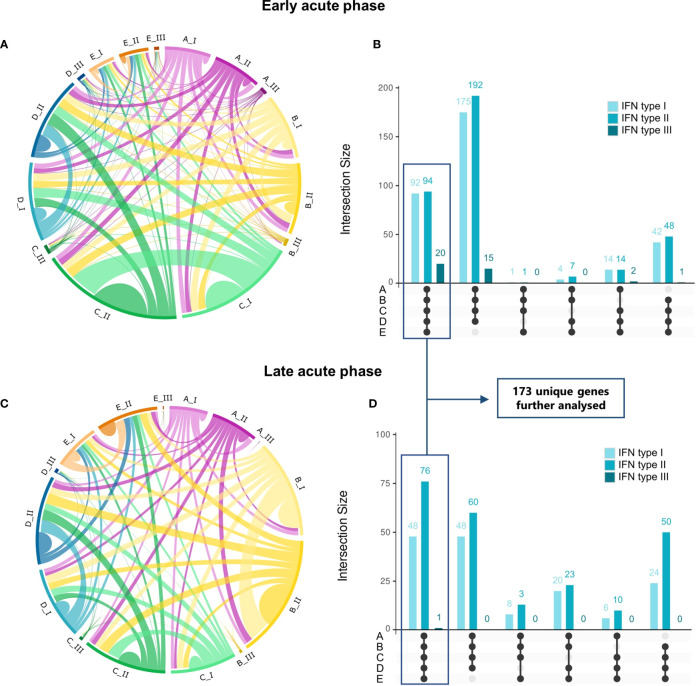
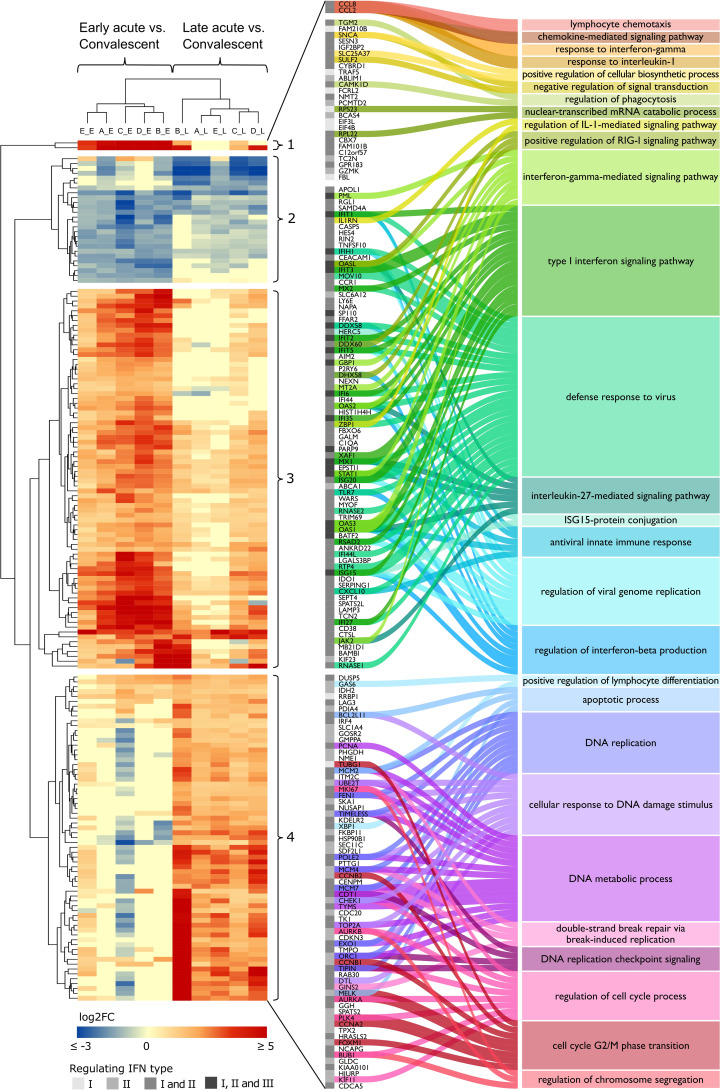
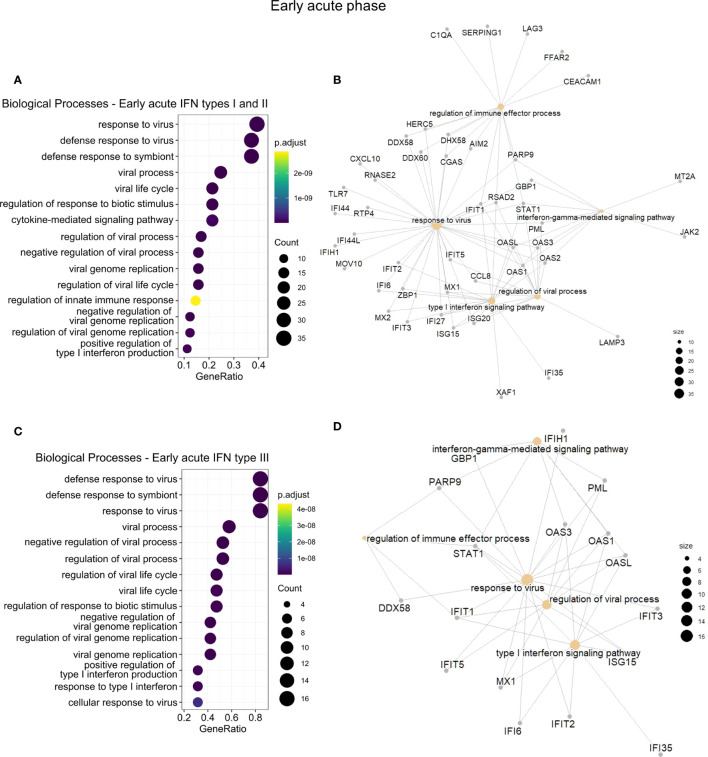
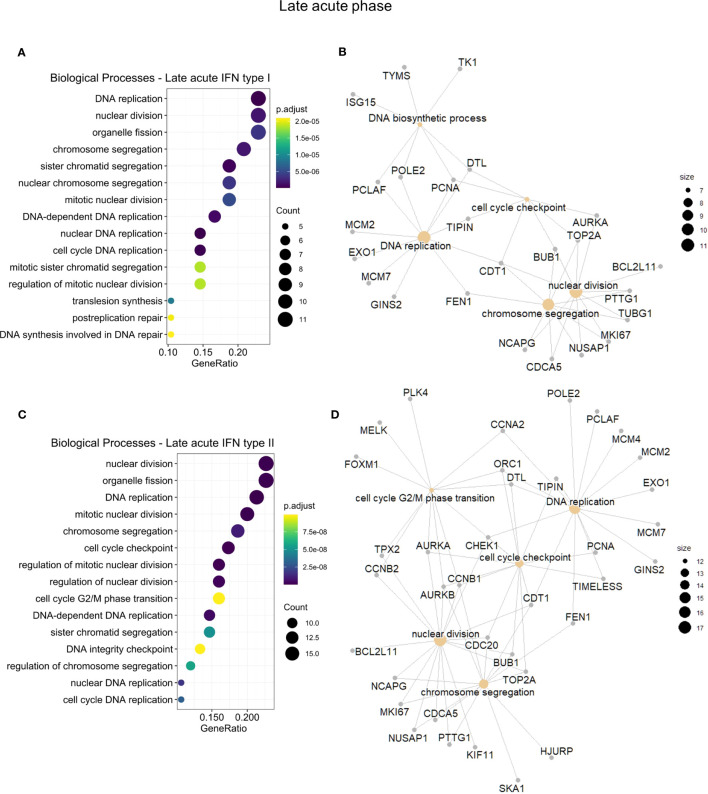
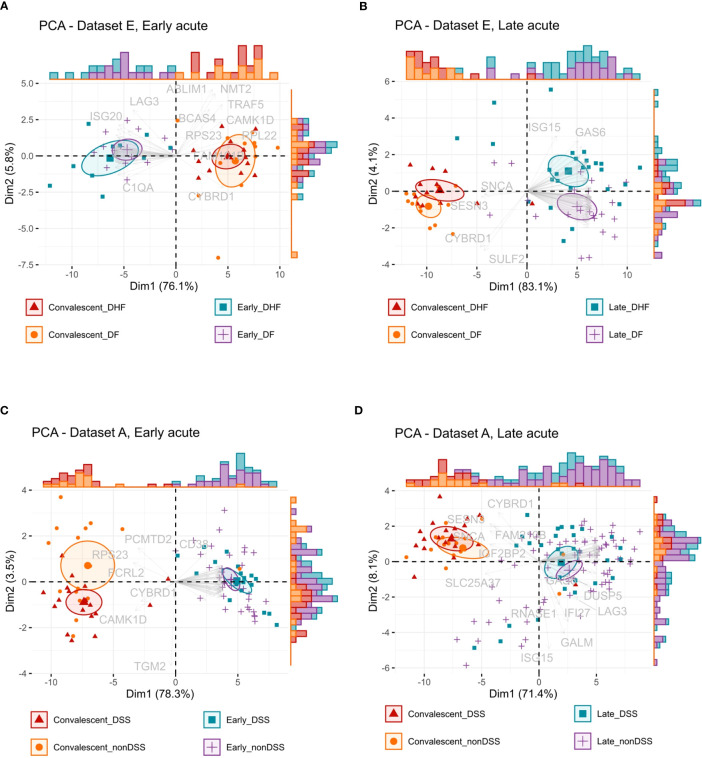
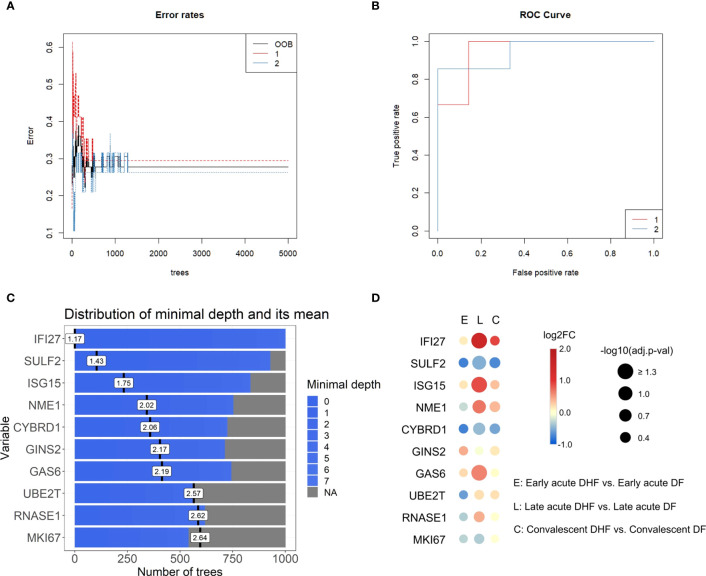
Dengue virus (DENV) infection manifests as a febrile illness with three distinct phases: early acute, late acute, and convalescent. Dengue can result in clinical manifestations with different degrees of severity, dengue fever, dengue hemorrhagic fever, and dengue shock syndrome. Interferons (IFNs) are antiviral cytokines central to the anti-DENV immune response. Notably, the distinct global signature of type I, II, and III interferon-regulated genes (the interferome) remains uncharacterized in dengue patients to date. Therefore, we performed an in-depth cross-study for the integrative analysis of transcriptome data related to DENV infection. Our systems biology analysis shows that the anti-dengue immune response is characterized by the modulation of numerous interferon-regulated genes (IRGs) enriching, for instance, cytokine-mediated signaling (e.g., type I and II IFNs) and chemotaxis, which is then followed by a transcriptional wave of genes associated with cell cycle, also regulated by the IFN cascade. The adjunct analysis of disease stratification potential, followed by a transcriptional meta-analysis of the interferome, indicated genes such as IFI27, ISG15, and CYBRD1 as potential suitable biomarkers of disease severity. Thus, this study characterizes the landscape of the interferome signature in DENV infection, indicating that interferome dynamics are a crucial and central part of the anti-dengue immune response.

Keywords: DENV; dengue; interferome; interferon; transcriptome.


Conflict of interest statement

The authors declare that the research was conducted in the absence of any commercial or financial relationships that could be construed as a potential conflict of interest.

Figures

Figure 1
Figure 1
Workflow summary. Schematic overview of the data collection and analyses performed to characterize the interferome in dengue infection across disease phases and severity degrees. Figure created with Inkscape. IFN, interferon; GO, Gene Ontology.
Figure 2
Figure 2
Data curation flow chart and differential expression of total genes and interferon-regulated genes across disease phases and disease severity degrees of dengue infection. (A) Steps of systematic search and assessment of datasets. Details of datasets and applied inclusion/exclusion criteria are available in Table S1 . (B) Barplot showing the number of up- and downregulated DEGs and IFN-regulated DEGs for each cohort comparison and dataset as denoted by letters (A, GSE25001; B, GSE28405; C, GSE28988; D, GSE28991; E, GSE43777; F, GSE40628; F, GSE51808) ( Table S3 ). The sample size of each cohort is indicated by a whole number in front of the group name. DF, Dengue fever; DHF, Dengue hemorrhagic fever; DSS, Dengue shock syndrome; DEG, differentially expressed gene; IFN, interferon.
Figure 3
Figure 3
Commonalities and uniquenesses of interferon-regulated genes across studies by disease phase and IFN type. (A, C), Circos plots representing IRGs regulated by IFN types I, II, or III that are shared across datasets in the early acute (A) or late acute (C) disease phases ( Table S5 ). Colors represent the dataset [magenta, dataset A (GSE25001); yellow, dataset B (GSE28405); green, dataset C (GSE28988); blue, dataset D (GSE28991); orange, dataset E (GSE43777)], from lighter to darker indicating genes regulated by IFN types I, II or III, respectively. (B, D), UpSet plots of the number of IRGs shared between datasets in the early acute (B) or late acute (D) disease phases. Bars are colored according to the regulating IFN type and indicate the number of genes shared in the dataset intersections denoted by connected black dots. Boxes highlight genes common to all datasets (commonalities), totalizing 173 unique genes after duplicate removal, which are further analyzed. A list of genes and complete intersections is available in Tables S6 , S7 , respectively. IRG, interferon-regulated gene; IFN, interferon.
Figure 4
Figure 4
DENV infection acute phase interferome landscape. Heatmap of log2 FC of the common IRGs across the acute phases in datasets A to E ( Table S8 ). The red color scale denotes up-regulated genes; the blue color scale denotes down-regulated genes, yellow color denotes genes not differentially expressed (FC close to zero or missing). Hierarchical clustering by Euclidean distance complete linkage metric discriminated cohorts (columns) by disease phase (early acute, late acute) and IRGs (rows) into four distinct clusters (1–4). The amplified view and alluvial plot represent the IRGs of each cluster and the main BPs associated with each cluster. The IFN types that regulate the IRGs are indicated by a grayscale column, from lighter to darker, representing IFN types I and II alone or I and II, as well as I, II, and III together. Complete functional enrichment results by cluster are available in Table S10 . Heatmap columns legend: First letter indicates dataset (A, GSE25001; B, GSE28405; C, GSE28988; D, GSE28991; E, GSE43777), while second letter indicates disease phase comparisons (E, early acute vs. convalescent; L, late acute vs. convalescent). DENV, dengue virus; FC, fold change; IRG, interferon-regulated gene; BP, biological process; IFN, interferon; IL-1, interleukin-1; RIG-I, retinoic acid-inducible gene I; ISG15, ISG15 ubiquitin-like modifier.
Figure 5
Figure 5
Functional gene enrichment characterization of the early acute phase interferome. (A, C), Dot plots of the top 15 BPs enriched by the early acute IRGs regulated by IFN types I and II (A) or regulated by IFN type III (C). The color scale indicates the adjusted p-value, and the dot size represents the number of input genes associated with the BP. (B, D), Networks of the main enriched BPs (khaki nodes) and respective genes (gray nodes) for the early acute IRGs regulated by IFN types I and II (B) or regulated by IFN type III (D). Node size represents the number of input genes associated with the BP. Complete functional enrichment results available in Table S11 . BP, biological process; IRG, interferon-regulated gene; IFN, interferon.
Figure 6
Figure 6
Functional gene enrichment characterization of the late acute phase interferome. (A, C), dot plots of the top 15 BPs by gene ratio enriched by the late acute IRGs regulated by IFN types I (A) or regulated by IFN type II (C). The dot color indicates the adjusted p-value, dot size represents the number of input genes associated with the BP. (B, D), Networks of the main enriched BPs (khaki nodes) and respective genes (gray nodes) for the early acute IRGs regulated by IFN types I (B) or regulated by IFN type II (D). Node size represents the number of input genes associated with the BP. Complete functional enrichment results available in Table S11 . BP, biological process; IRG, interferon-regulated gene; IFN, interferon.
Figure 7
Figure 7
Interferon-regulated genes stratification capacity by disease phase and severity. (A, B), Principal component analysis (PCA) biplots of the log2-transformed gene expression values from dataset E of the early acute phase (A) or late acute phase (B) IRGs common across all studies. (C, D), PCA biplots of the log2-transformed gene expression values from dataset A of the early acute phase (C) or late acute phase (D) IRGs common across all studies. Data is available in Table S12 . Ellipses represent the concentration of samples. Vectors represent the loadings, individual contributions of the genes. Histograms represent the distribution of samples across the biplot. Color and shape identify the groups: red color and triangles represent the convalescent more severe samples (DHF or DSS), orange color and dots represent the convalescent less severe samples (DF or nonDSS), blue color and squares represent the acute phase more severe samples (DHF or DSS), purple color and positive signs represent the acute phase less severe samples (DF or nonDSS). IRG, interferon-regulated gene. DSS, Dengue shock syndrome DF; nonDSS, non-Dengue shock syndrome; Dengue fever; DHF: Dengue hemorrhagic fever.
Figure 8
Figure 8
Top interferon-regulated genes for severity classification in the late acute phase ranked by random forest (Dataset E). (A), Error rates of random forest models by number of trees. (B), Receiver operating characteristic (ROC) curve of the generated classifying models. The red line corresponds to group 1 (late acute DF), blue line corresponds to group 2 (late acute DHF). (C), Bar plot of the top ten severity classifying genes ranked by the random forest model, number of trees, and distribution of the minimal depth. Blue bars represent the minimum and maximum minimal depth, and black vertical lines represent the mean minimal depth for each classifying gene. Data input of log2-transformed expression values of IRGs common across datasets A to E in the late acute phase are available in Table S13 . (D), Bubble heatmap of the log2FC of IRGs resulting from the DHF vs. DF comparison for each disease phase (early acute, late acute, convalescent). The red scale indicates positive FC (up-regulated genes), blue scale indicates negative FC (down-regulated genes). Bubble size represents -log10-transformed adjusted p-value. Data is available in Table S14 . IRG, interferon-regulated gene; DHF, dengue hemorrhagic fever; DF, dengue fever; FC, fold change, OOB: out-of-bag.

Similar articles

Cited by

References

    1. Harapan H, Michie A, Sasmono RT, Imrie A. Dengue: A minireview. Viruses (2020) 12. doi: 10.3390/v12080829 - DOI - PMC - PubMed
    1. World Health Organization . Ending the neglect to attain the Sustainable Development Goals: A road map for neglected tropical diseases 2021–2030. Overview (2021). Available at: https://www.who.int/publications-detail-redirect/WHO-UCN-NTD-2020.01 (Accessed July 1, 2021).
    1. Guzman MG, Gubler DJ, Izquierdo A, Martinez E, Halstead SB. Dengue infection. Nat Rev Dis Primers (2016) 2:16055. doi: 10.1038/nrdp.2016.55 - DOI - PubMed
    1. World Health Organization, Special Programme for Research and Training in Tropical Diseases . Dengue: guidelines for diagnosis, treatment, prevention, and control. New. Geneva: World Health Organization; (2009). 147 p.
    1. Sun P, García J, Comach G, Vahey MT, Wang Z, Forshey BM, et al. Sequential waves of gene expression in patients with clinically defined dengue illnesses reveal subtle disease phases and predict disease severity. PloS Negl Trop Dis (2013) 7:e2298. doi: 10.1371/journal.pntd.0002298 - DOI - PMC - PubMed

Publication types