Review
. 2023 Jul 10;5(17):4311-4336.
doi: 10.1039/d3na00218g. eCollection 2023 Aug 24.

Fluorescent nano- and microparticles for sensing cellular microenvironment: past, present and future applications

Affiliations
Review

Fluorescent nano- and microparticles for sensing cellular microenvironment: past, present and future applications

Giuliana Grasso et al. Nanoscale Adv. .

Abstract

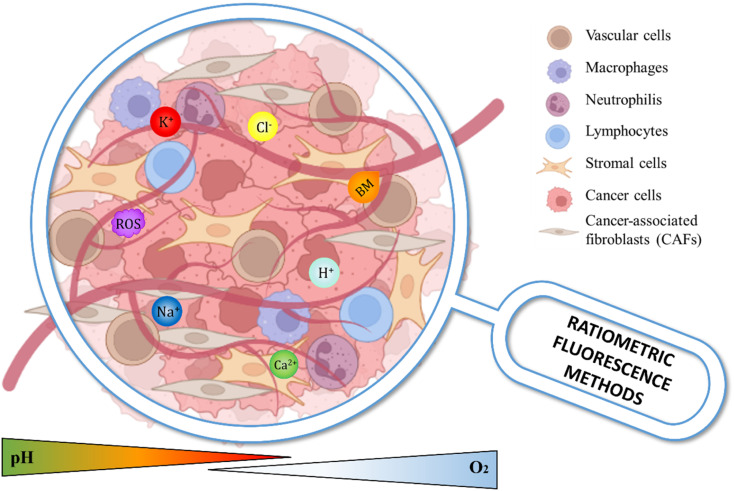
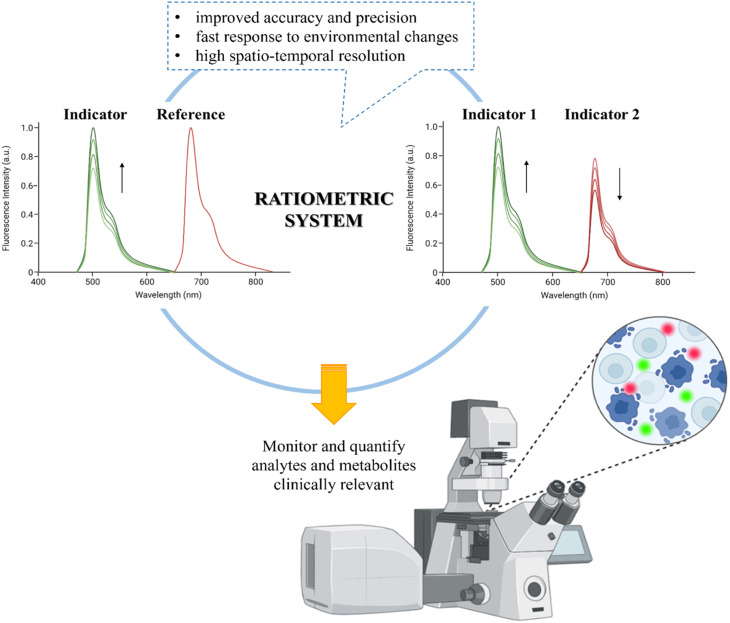
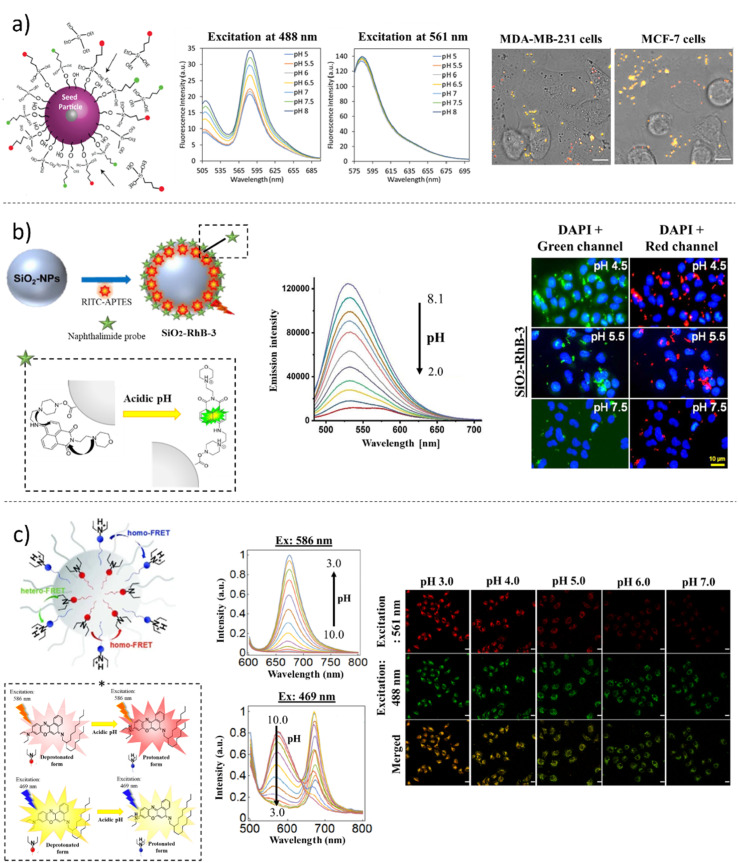
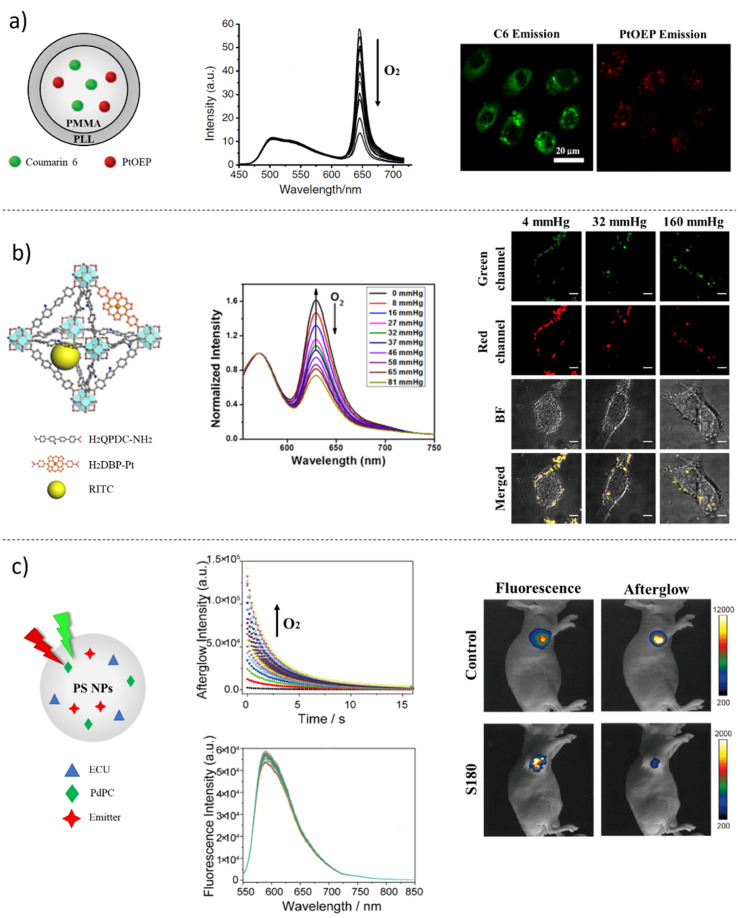
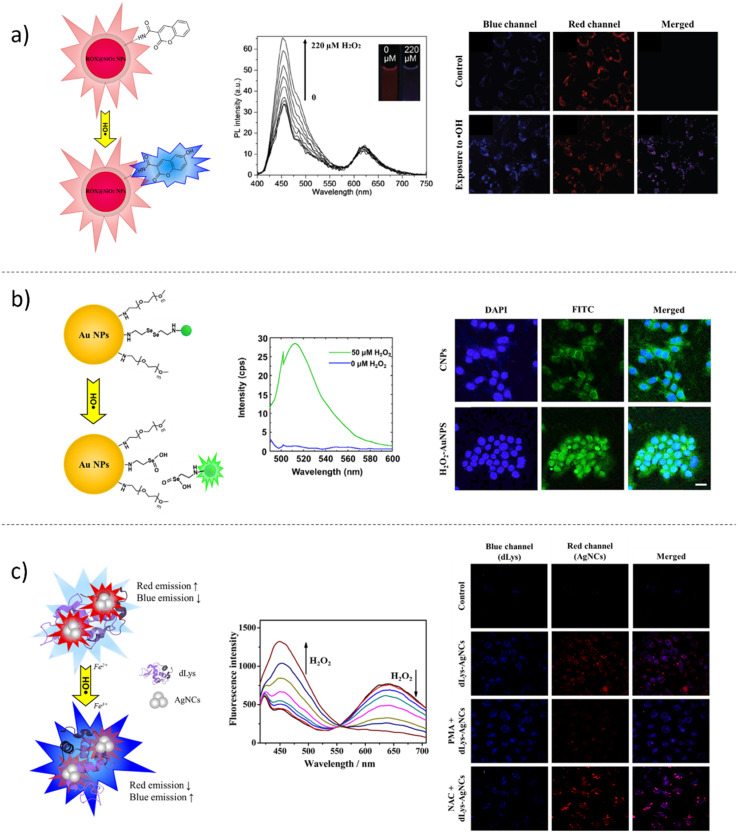
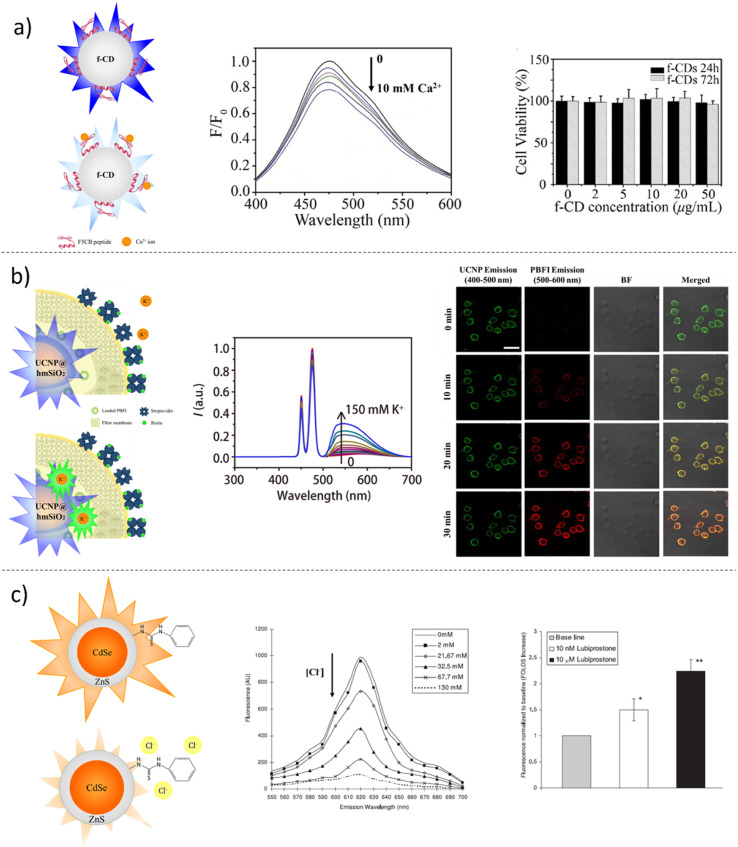
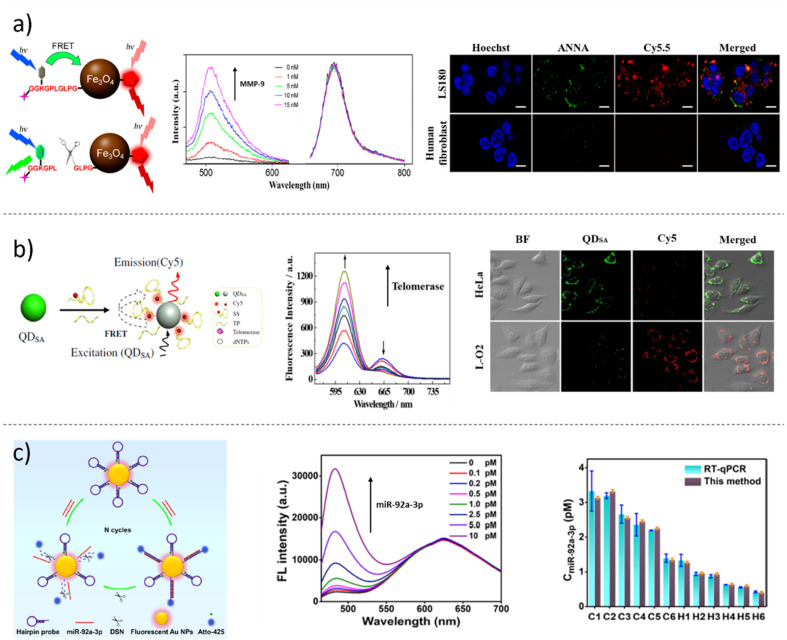
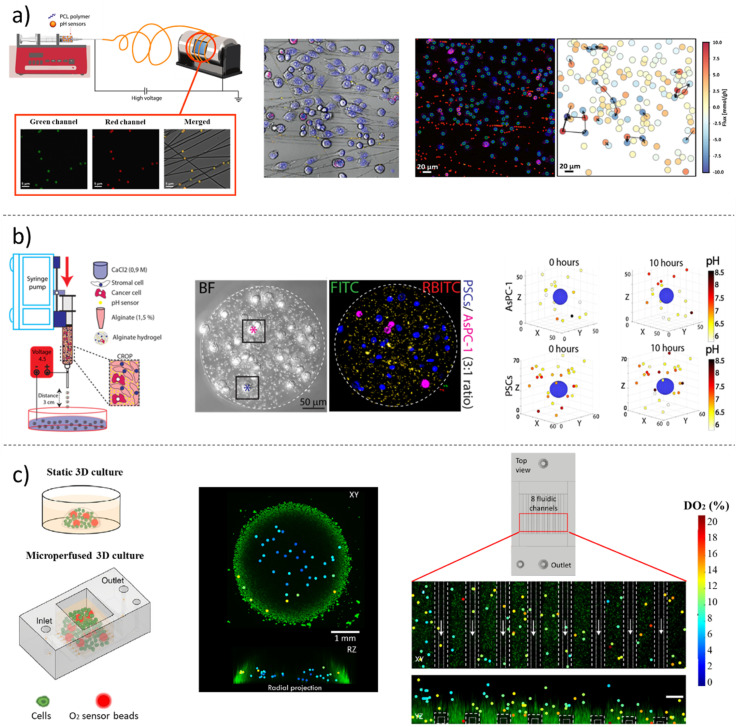
The tumor microenvironment (TME) demonstrates distinct hallmarks, including acidosis, hypoxia, reactive oxygen species (ROS) generation, and altered ion fluxes, which are crucial targets for early cancer biomarker detection, tumor diagnosis, and therapeutic strategies. Various imaging and sensing techniques have been developed and employed in both research and clinical settings to visualize and monitor cellular and TME dynamics. Among these, ratiometric fluorescence-based sensors have emerged as powerful analytical tools, providing precise and sensitive insights into TME and enabling real-time detection and tracking of dynamic changes. In this comprehensive review, we discuss the latest advancements in ratiometric fluorescent probes designed for the optical mapping of pH, oxygen, ROS, ions, and biomarkers within the TME. We elucidate their structural designs and sensing mechanisms as well as their applications in in vitro and in vivo detection. Furthermore, we explore integrated sensing platforms that reveal the spatiotemporal behavior of complex tumor cultures, highlighting the potential of high-resolution imaging techniques combined with computational methods. This review aims to provide a solid foundation for understanding the current state of the art and the future potential of fluorescent nano- and microparticles in the field of cellular microenvironment sensing.


Conflict of interest statement

There are no conflicts to declare.

Figures

Fig. 1
Fig. 1. A close-up look at the different characteristics and analytes having a biological significance within the TME, which can be precisely examined by ratiometric fluorescence methods. The heterogeneity of the TME is mainly due to the complex ecosystem created by the interactions among tumor, stromal and immune cells, all of which are immersed in a dense and dysregulated ECM. Poor blood flow and crowded glycolytic tumor cells form niches characterized by reduced oxygenation, pH acidity, reduced nutrient loading, collection of anti-inflammatory cytokines and chemokine, and storage of metabolic by-products, such as lactate.
Fig. 2
Fig. 2. Sketch of the ratiometric optical methods with their advantages and applications in sensing TME in vitro and in vivo.
Fig. 3
Fig. 3. Examples of pH sensing ratiometric nano-platforms. (a) (Left): Schematic illustration of the ratiometric SiO2 MPs functionalization with FITC and RBITC dyes using a modified Stöber method; (middle): pH-dependent fluorescence of the MPs; (right): fluorescence micrographs showing the color changes in the ratiometric pH-responsive MP sensors added to MDA-MB-231 cells and MCF-7 cells after incubation for 24 hours. Scale bars: 10 μm. Adapted with permission from Chandra et al., ACS Appl. Mater. Interfaces 2022, 14, 18133–18149; figure licensed under CC-BY 4.0, https://creativecommons.org/licenses/by/4.0/. (b) (Left): Schematic representation of the protocol used to synthesize pH-sensing SiO2-NPs; (middle): pH-dependent fluorescence of probe 3 on NPs; (right): epifluorescence images of fixed A549 cells incubated with solutions of pH nanosensors SiO2–RhB-3, monitoring with emission filters set to λem = 470 nm (green channel) and to λem = 560 nm (red channel). Scale bar: 10 μm. Adapted with permission from Srivastava et al., Sci. Rep., 13, 1321, 2023; figure licensed under CC-BY 4.0, https://creativecommons.org/licenses/by/4.0/. (c) (Left): Schematic illustration and working principle of the protonation of Ch3 at the surface of the NPs, turning the color from red to blue; (middle): fluorescence emission spectra (excitation at 586 nm) of the nanosensors containing Ch3, PS-PEO, and NPOE in universal buffer solutions at different pH values from 10 to 3, upon excitation at 586 and 469 nm; (right): CLSM images for the cellular pH calibrations of the nanosensors from pH 3.0 to 7.0. Scale bar: 20 μm. Reprinted with permission from Chen et al., Nano Res., 2022, 15(4): 3471–3478. Copyright © 2021, Tsinghua University Press and Springer-Verlag GmbH Germany, part of Springer Nature.
Fig. 4
Fig. 4. Examples of O2 sensing nano-platforms. (a) (Left) Schematic representation of the oxygen ratiometric PMMA-NPs; (middle): emission spectra of the sensor NPs at various concentrations of oxygen upon excitation at 381 nm excitation; (right): CLSM images of HepG2 cells loaded with the oxygen sensing NPs under normoxia conditions; the green fluorescence of C6 of ratiometric NPs was recorded using a 560 nm emission band-pass filter with a 405 nm excitation, while the red fluorescence of PtOEP using a 750 nm emission band-pass filter with a 543 nm excitation wavelength. Scale Bar: 20 μm. Reprinted with permission from Wang et al., Microchim Acta, 2012, 178, 147–152; Copyright © 2012, Springer-Verlag. (b) (Left): Schematic representation of R-UiO NMOF based on Pt(II)-porphyrin ligand as an O2-sensitive probe and a rhodamine-B isothiocyanate ligand as an O2-insensitive reference probe; (middle) emission spectra (λex = 514 nm) of R-UiO in HBSS buffer under various oxygen partial pressures; (right): CLSM images of CT26 cells under hypoxia (4 mmHg), normoxia (32 mmHg), and aerated conditions (160 mmHg) after incubation with R-UiO-2. Scale bar: 5 μm. Reprinted with permission from Xu et al., J. Am. Chem. Soc., 2016, 138, 2158–2161. Copyright © 2016, American Chemical Society. (c) (Left): Schematic illustration of the working principle of afterglow/fluorescence dual-emissive ratiometric O2 probe; (middle): afterglow decay curves of AGNPs and fluorescence spectra of AGNPs in different oxygen concentrations; (right): fluorescence and afterglow images of mice with the subcutaneous implantation of AGNPs in the mouse bearing no tumor and of mice with the intratumor injection of AGNPs in the mouse bearing the tumor, with the corresponding fluorescence and afterglow intensity. Reprinted with permission from Wen et al., Anal. Chem., 2023, 95, 4, 2478–2486. Copyright © 2023, American Chemical Society.
Fig. 5
Fig. 5. Examples of ROS sensing nano-platforms. (a) (Left): Schematic illustration of the dual-emission probe synthesis procedure and the working principle for ratiometric fluorescence detection of ˙OH; (middle): fluorescence spectra of the ratiometric probe solution upon the exposure to different concentrations of ˙OH at various H2O2 concentrations; (right): confocal fluorescence images of HeLa cells after being incubated with the dual-emission probe in the absence and presence of ˙OH. The images were collected at 410–520 nm (blue channel) and 580–680 nm (red channel) upon excitation at 405 nm. Scale bar: 20 μm. Reprinted with permission of Royal Society of Chemistry, from Liu et al., Analyst, 2016, 141, 7, 2296–2302; permission conveyed through Copyright Clearance Center, Inc. (b) (Left): Schematic illustration of the H2O2-sensitive on-off H2O2-AuNPs; (middle): H2O2 responsive fluorescence spectra of H2O2 sensitive-AuNPs; (right): in vitro confocal microscopic images of activated RAW264.7 cells incubated with the CNPs and H2O2 –AuNPs for 3 hours at pH 7.4. Scale bar: 20 μm. Reprinted from Deepagan et al., Macromol. Res., 2018, 26(7), 577–580. Copyright © 2018, The Polymer Society of Korea and Springer Science Business Media B.V., part of Springer Nature. (c) (Left): Schematic illustration of the fluorescent responding mechanism of dLys-AgNCs to Fenton Reagents; (middle): fluorescence spectra of the ratiometric NPs towards different H2O2 concentrations; (right): fluorescence confocal images of PC-3 cells alone (first raw), PC-3 cells treated with dLy-AgNC probe (second raw), PC-3 cells incubated with PMA (third raw) and NAC (forth raw) prior to treatment with dLys-AgNCs. Adopted from ref. Liu et al., Anal. Chem., 2016, 88, 21, 10631–10638. Copyright © 2016 American Chemical Society.
Fig. 6
Fig. 6. Examples of ion ratiometric sensing platforms. (a) (Left): Schematic illustration of the peptide-functionalized carbon dots (f-CDs) that operate as Ca2+ nanosensors; (middle): fluorescence emission spectra of f-CDs at various concentrations of Ca2+ (λex = 350 nm); the binding of calcium cations can quench the fluorescence emission of f-CDs; (right): cell viability assay on SH-SY5Y cells incubated at various concentrations of f-CDs for 24 and 72 hours. Reprinted with permission from Lin et al., Sens. Actuators, B, 2018, 273, 1654–1659. Copyright © 2018 Elsevier B.V. All rights reserved. (b) (Left): To the right: Schematic illustration of the K+ nanosensors; the upconverting nanoparticles (UCNPs) are coated with PBFI-loaded silica and an outer shell of K+ permeable film; (middle): fluorescence emission spectra of the nanosensors at various K+ concentrations (λex = 808 nm); (right): CLSM micrographs of HEK 293 cells labelled with K+ nanosensors, showing fluorescence emission at 400–500 nm and 500–600 nm. The potassium cation efflux, after the treatment with 5 μM nigericin, 5 μM bumetanide, and 10 μM ouabain, is verified by the fluorescence enhancement of the PBFI. Reprinted with permission of ref. (Liu et al., Sci. Adv., 6, eaax9757, 2020); figure licensed under a Creative Commons Attribution NonCommercial License 4.0 (CC BY-NC). (c) (Left): Schematic illustration of the Cl nanosensors; CdSe/ZnS quantum dots are capped with the chloride sensitive thiourea; (middle): fluorescence emission spectra of the Cl nanosensors at increasing concentration of chloride (λex = 425 nm); (right): fluorescence emission of T84 cells incubated with the nanosensors and treated with Lubiprostone, showing the efflux of chloride anions from cells. Reproduced with permission from ref. Wang et al., Nanotechnology, 2010, 21, 055101. Copyright © 2010 IOP Publishing. All rights reserved.
Fig. 7
Fig. 7. Examples of biomarker sensing nano-platforms. (a) (Left): Schematic illustration of the working mechanism of Fe3O4 MMP-9 activity sensing NPs; (middle): fluorescence spectra recorded after the nanoprobes were incubated with different concentrations of activated MMP-9; (right): confocal microscopy images of LS180 cells (top row) and human fibroblast control cells (bottom row) obtained after incubation with the nanoprobe for 6 h and then imaged through different channels according to the dye emissions (cell nuclei were stained with Hoechst, and the scale bar corresponds to 10 μm). Reprinted with permission from Ma et al., J. Am. Chem. Soc., 2018, 140, 1, 211–218. Copyright © 2018, American Chemical Society. (b) (left): The QDsSA@DNA nanoprobe for monitoring of telomerase activity in situ; (middle): fluorescence emission spectra of the designed QDsSA@DNA nanoprobe (100 nM) in response to telomerase extraction from different numbers of HeLa cells; (right): confocal fluorescence microscopy imaging of HeLa and L-O2 cells incubated with the QDsSA@DNA nanoprobe for 4 h. The concentration of the added QDsSA@DNA nanoprobe was 100 nM. Scale bar: 25 μm. Reprinted with permission from Ma et al., Anal. Bioanal. Chem., 414, 1891–1898 (2022). Copyright © 2022, Springer-Verlag GmbH Germany, part of Springer Nature. (c) (left): Schematic of the ratiometric fluorescent detection of miR-92a-3p based on fluorescent Au-NP and DSN-assisted signal amplification; (middle): fluorescence spectra of the biosensor under different concentrations of miR-92a-3p; (right) comparison of the exosomal miR-92a-3p concentrations of CRC patients and healthy controls detected by RT-qPCR and this method (n = 3, mean ± s day). C1–C6 represents CRC patients; H1–H6 represents healthy controls. Reprinted with permission from Sun et. al., Bioconjugate Chem., 2022, 33, 9, 1698–1706. Copyright © 2022, American Chemical Society.
Fig. 8
Fig. 8. Examples of hybrid materials/systems including fluorescent nano-microparticles for biomedical applications. (a) (left): Sketch showing the fabrication of electrospun polycaprolactone (PCL) fibers embedding ratiometric SiO2-based microparticle sensors and representative CLSM micrographs showing PCL nanofibers embedding pH sensors (deposition time = 30 s). FITC (green channel), RBITC (red channel), and overlay with bright-field (BF, gray channel) are shown. Scale bar: 5 μm; (middle): representative CLSM image showing cells co-cultured on pH-sensing fibers and analyzed by CLSM time-lapse imaging (x, y, z, t; t = 6 h) (nuclei are shown in blue, and cell membranes are shown in magenta for tumor cells). (Right): Results of the segmentation show the detection of the single pH sensors (red circles), AsPC-1 cells (green circles), and CAF cells (yellow circles), corresponding to the reconstruction of the cell fluxes through physically constrained statistical inference, with a relative colormap. Scale bar: 20 μm. Reprinted with permission from Onesto et al., ACS Nano, 2023, 17, 3313–3323; figure licensed under CC-BY 4.0 https://creativecommons.org/licenses/by/4.0. (b) (Left): Schematic illustration of the microencapsulation system for the generation of 3D spherical hydrogel embedding pH sensors, tumor and stromal cells; (middle): maximum intensity projection of 3D time-lapse CLSM acquisitions of alginate hydrogel, including FITC/RBITC pH sensors (yellow), tumor cells (magenta) and stromal cells (blue). Bright-field (BF, grey). Scale bar: 50 μm. (Right): 3D scatter plots of the pH sensors around a selected tumor and cancer cells at times 0 and 10 h, with relative pH colour-maps. Reprinted with permission from Rizzo et al., Biosensors and Bioelectronics, 2022, 212, 114401; figure licensed under CC-BY 4.0 https://creativecommons.org/licenses/by/4.0. Copyright © 2022, The Authors. Published by Elsevier B.V. (c) (Left): The cell mixture is dispensed into the targeted 3D static culture, and 3D dynamic culture within a chip supporting microperfusion (perfusion pathway illustrated by arrows); (middle): CLSM PLIM imaging of the embedded oxygen sensor beads and subsequent conversion to the corresponding local oxygen concentration is shown as colour-coded concentrations overlaid with green fluorescence from calcein AM staining of metabolically active cells in lateral (XY) and radial (RZ) projections. HepG2 cells at 20 × 106 cells per mL embedded in a hydrogel of 7.5% w/v GelMA in a medium; (right): oxygenation in a 3D tissue model with an array of 8 perfused microfluidic channels (inner dimensions of 140 × 140 μm2) and projected bottom view of sensor beads at all elevations overlaid on a projected confocal fluorescence micrograph of live-stained cells. Reproduced from Wesseler et al., Lab Chip, 2022, 22, 4167 with permission from the Royal Society of Chemistry.

References

    1. Vineis P. Wild C. P. Lancet. 2014;383:549–557. doi: 10.1016/S0140-6736(13)62224-2. - DOI - PubMed
    1. American Cancer Society, Cancer Facts & Figures, 2022
    1. Siegel R. L. Miller K. D. Wagle N. S. Jemal A. Cancer C. A. J. Clin. 2023;73:17–48. - PubMed
    1. Yabroff K. R. Wu X.-C. Negoita S. Stevens J. Coyle L. Zhao J. Mumphrey B. J. Jemal A. Ward K. C. JNCI, J. Natl. Cancer Inst. 2022;114:907–909. doi: 10.1093/jnci/djab122. - DOI - PMC - PubMed
    1. Schmidt G. Dinter D. Reiser M. F. Schoenberg S. O. Dtsch. Ärztebl. Int. 2010;107:383–389. - PMC - PubMed