. 2023 Dec;30(6):2736-2749.
doi: 10.1007/s12350-023-03358-5. Epub 2023 Aug 28.

Detection and correction of patient motion in dynamic 15O-water PET MPI

Affiliations

Detection and correction of patient motion in dynamic 15O-water PET MPI

Nana L Christensen et al. J Nucl Cardiol. 2023 Dec.

Abstract

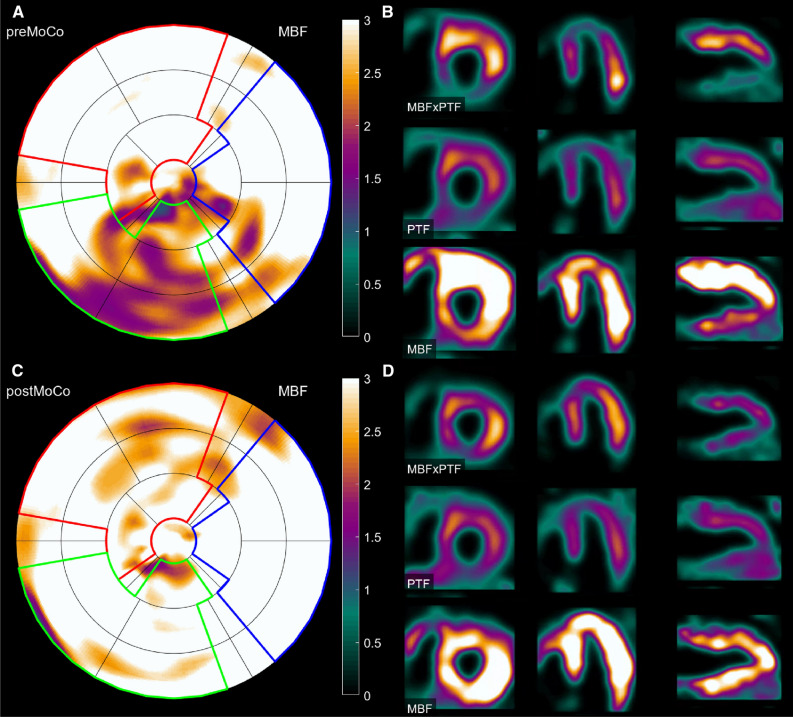
Background: Patient motion constitutes a limitation to 15O-water cardiac PET imaging. We examined the ability of image readers to detect and correct patient motion using simulated motion data and clinical patient scans.

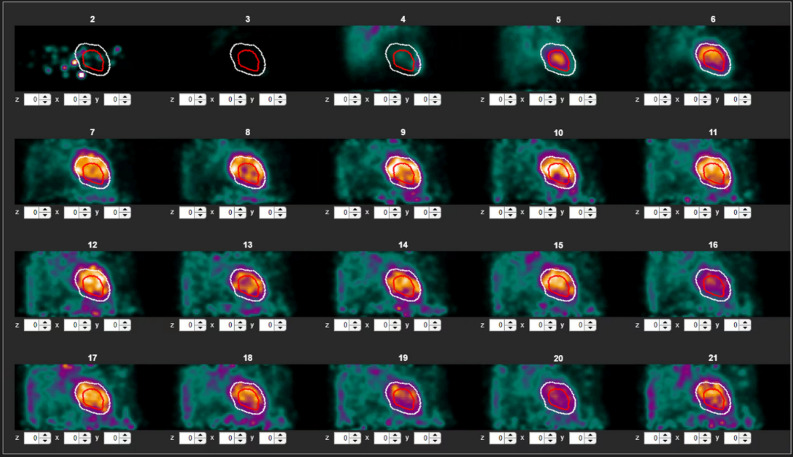
Methods: Simulated data consisting of 16 motions applied to 10 motion-free scans were motion corrected using two approaches, pre-analysis and post-analysis for motion identification. Both approaches employed a manual frame-by-frame correction method. In addition, a clinical cohort was analyzed for assessment of prevalence and effect of motion and motion correction.

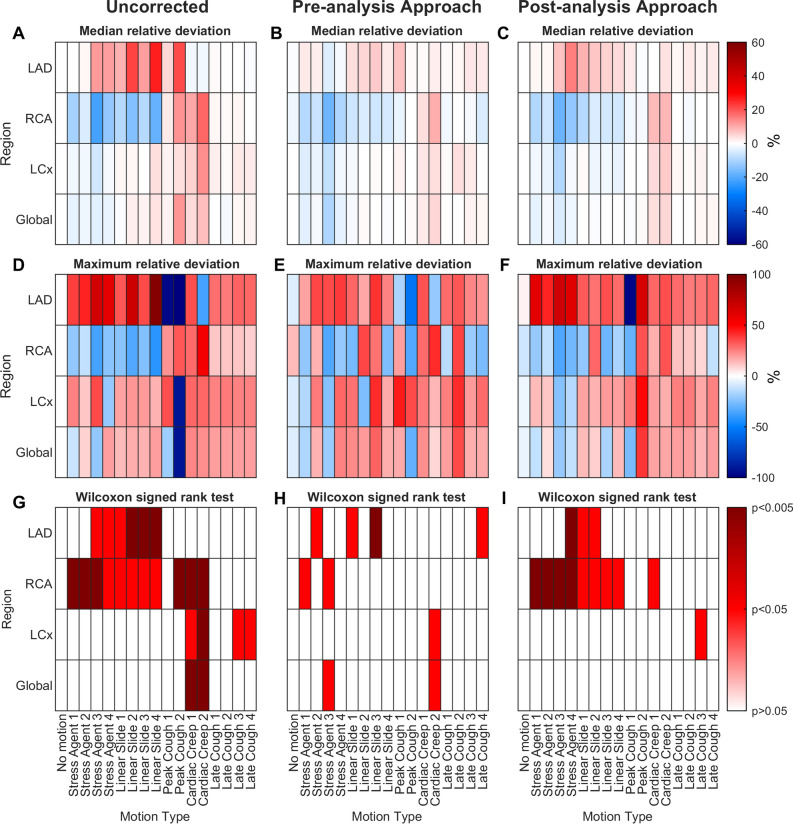
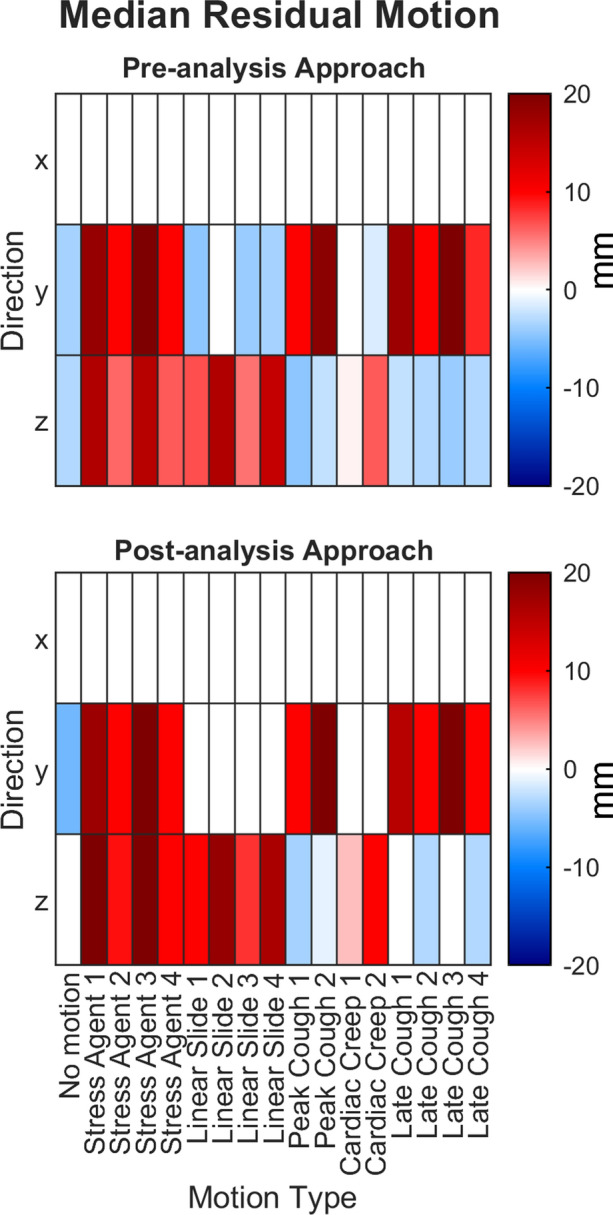
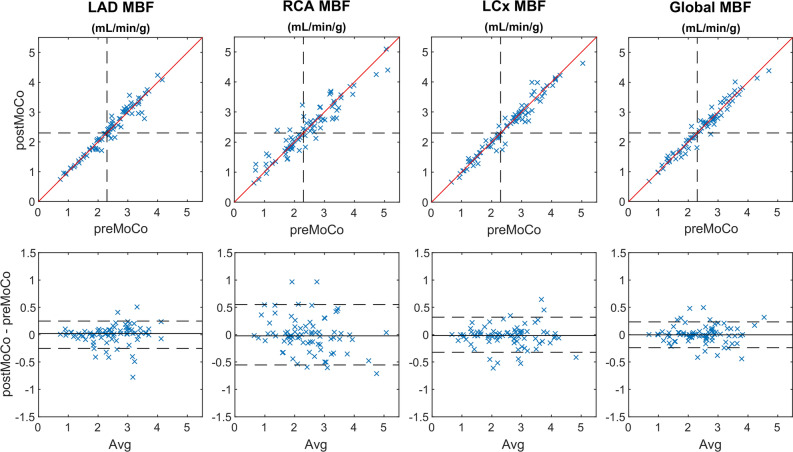
Results: Motion correction was performed on 94% (pre-analysis) and 64% (post-analysis) of the scans. Large motion artifacts were corrected in 91% (pre-analysis) and 74% (post-analysis) of scans. Artifacts in MBF were reduced in 56% (pre-analysis) and 58% (post-analysis) of the scans. The prevalence of motion in the clinical patient cohort (n = 762) was 10%. Motion correction altered exam interpretation in only 10 (1.3%) clinical patient exams.

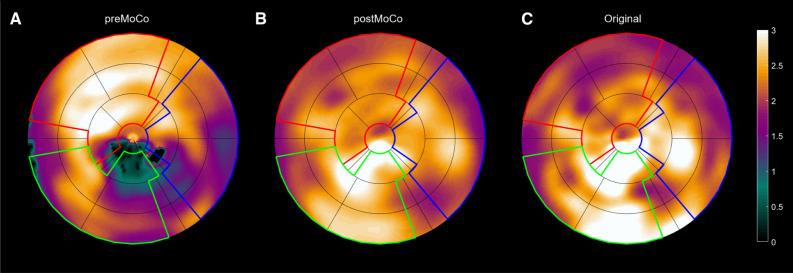
Conclusion: Frame-by-frame motion correction after visual inspection is useful in reducing motion artifacts in cardiac 15O-water PET. Reviewing the initial results (parametric images and polar maps) as part of the motion correction process, reduced erroneous corrections in motion-free scans. In a large clinical cohort, the impact of motion correction was limited to few patients.

Keywords: PET; image analysis; myocardial blood flow; perfusion agents.


Conflict of interest statement

N.L.C., J.N., S.M., M.A.M., L.C.G, and T.K. have nothing to disclose. M.L. and L.P.T. hold shares in MedTrace Pharma AS, Hørsholm, Denmark.

Figures

Figure 1
Figure 1
Frame-by-frame motion correction software. All 21 frames are displayed, showing an overlay of the left ventricular segmentation from the aQuant pre-correction analysis. Each frame can be manually shifted in the x-, y-, or z-direction
Figure 2
Figure 2
Heat maps of uncorrected (A, D, G) and motion corrected images using the pre-analysis (B, E, H) and post-analysis (C, F, I) approach. The X-axis represents each type of motion. The Y-axis represents the coronary territories (LAD, RCA, LCx, and global). Median relative deviation (%) in MBF from the original motion-free images in uncorrected (A) and motion-corrected (B) images. Maximum relative deviation (%) in MBF from the original motion-free images in uncorrected (D) and in motion-corrected images using the preanalysis approach (E) and post-analysis approach (F). Results of the Wilcoxon signed-rank test, showing level of significance (P > .05, P < .05 or P < .005) in MBF deviation from the original motion-free images in uncorrected (G) and in motion-corrected images using the pre-analysis approach (H) and post-analysis approach (I). Every cell in A, B, C, G, H and I contains results from all 10 patients. Every cell in D, E and F contains results from the one patient with the highest maximum deviation
Figure 3
Figure 3
Median residual motion calculated as the difference between the actual simulated motion and the motion corrected by the two motion correction approaches. Positive values indicate under-correction, while negative values indicate over-correction. The values represent the magnitude of the residual motion in millimeters
Figure 4
Figure 4
Polar plots from a patient scan comparing images pre-correction (A), post-correction (B), and original motion-free (C). The simulated linear slide motion (20 mm, 1 minute post-injection) increased MBF in the anterior part and reduced MBF in the inferior part with a large apical inferolateral defect (A). After motion correction, the artifact disappeared (B), aligning with the original motion-free image (C)
Figure 5
Figure 5
PET images representing a patient from the clinical cohort pre- (A, B) and post-motion (C, D) correction. In the polar plot in A, a motion artifact has caused a false positive defect (20.1 %) in the RCA territory. In the post-motion correction polar plot in C, the motion artifact is completely reduced (defect 0.0 %). Splash images of short axis, horizontal long axis, and vertical long axis in B demonstrate the effect of motion artifacts on the visual interpretation of the images. The inferior wall appears hypoperfused compared to the rest of the myocardium. The post-motion correction splash images in D, demonstrate a uniform tracer uptake, thereby eliminating any suspicions of defects in the inferior wall. MBF, myocardial blood flow (mL⋅min−1⋅g−1); PTF, perfusable tissue fraction (mL⋅mL−1)
Figure 6
Figure 6
Scatter plots and Bland–Altman plots of regional MBFstress as well as global MBFstress for precorrection vs motion-corrected images in the clinical patient cohort. Dashed lines in the scatter plots indicate the threshold of normal values (MBF ≥ 2.3 mL⋅min−1⋅g−1). Red lines represent lines of identity. Dashed lines in the Bland–Altman plots represent limits of agreement

References

    1. Knaapen P, Lubberink M. Cardiac positron emission tomography: Myocardial perfusion and metabolism in clinical practice. Clin Res Cardiol. 2008;97:791–796. doi: 10.1007/s00392-008-0662-9. - DOI - PubMed
    1. Danad I, Uusitalo V, Kero T, Saraste A, Raijmakers PG, Lammertsma AA, et al. Quantitative assessment of myocardial perfusion in the detection of significant coronary artery disease: Cutoff values and diagnostic accuracy of quantitative [(15)O]H2O PET imaging. J Am Coll Cardiol. 2014;64:1464–1475. doi: 10.1016/j.jacc.2014.05.069. - DOI - PubMed
    1. Harms HJ, Knaapen P, de Haan S, Halbmeijer R, Lammertsma AA, Lubberink M. Automatic generation of absolute myocardial blood flow images using [15O]H2O and a clinical PET/CT scanner. Eur J Nucl Med Mol Imaging. 2011;38:930–939. doi: 10.1007/s00259-011-1730-3. - DOI - PMC - PubMed
    1. Murthy VL, Bateman TM, Beanlands RS, Berman DS, Borges-Neto S, Chareonthaitawee P, et al. Clinical quantification of myocardial blood flow using PET: Joint position paper of the SNMMI Cardiovascular Council and the ASNC. J Nucl Cardiol. 2018;25:269–297. doi: 10.1007/s12350-017-1110-x. - DOI - PubMed
    1. Naum A, Laaksonen MS, Tuunanen H, Oikonen V, Teras M, Kemppainen J, et al. Motion detection and correction for dynamic (15)O-water myocardial perfusion PET studies. Eur J Nucl Med Mol Imaging. 2005;32:1378–1383. doi: 10.1007/s00259-005-1846-4. - DOI - PubMed

Publication types

LinkOut - more resources