

Assessment of Hospital-Onset SARS-CoV-2 Infection Rates and Testing Practices in the US, 2020-2022
- PMID: 37639273
- PMCID: PMC10463096
- DOI: 10.1001/jamanetworkopen.2023.29441
Assessment of Hospital-Onset SARS-CoV-2 Infection Rates and Testing Practices in the US, 2020-2022
Abstract
Importance: Characterizing the scale and factors associated with hospital-onset SARS-CoV-2 infections could help inform hospital and public health policies regarding prevention and surveillance needs for these infections.
Objective: To evaluate associations of hospital-onset SARS-CoV-2 infection rates with different periods of the COVID-19 pandemic, hospital characteristics, and testing practices.
Design, setting, and participants: This cohort study of US hospitals reporting SARS-CoV-2 testing data in the PINC AI Healthcare Database COVID-19 special release files was conducted from July 2020 through June 2022. Data were collected from hospitals that reported at least 1 SARS-CoV-2 reverse transcription-polymerase chain reaction or antigen test during hospitalizations discharged that month. For each hospital-month where the hospital reported sufficient data, all hospitalizations discharged in that month were included in the cohort. SARS-CoV-2 viral tests and results reported in the microbiology files for all hospitalizations in the study period by discharge month were identified. Data analysis was conducted from September 2022 to March 2023.
Exposure: Hospitalizations discharged in an included hospital-month.
Main outcomes and measures: Multivariable generalized estimating equation negative-binomial regression models were used to assess associations of monthly rates of hospital-onset SARS-CoV-2 infections per 1000 patient-days (defined as a first positive SARS-CoV-2 test during after hospitalization day 7) with the phase of the pandemic (defined as the predominant SARS-CoV-2 variant in circulation), admission testing rates, and hospital characteristics (hospital bed size, teaching status, urban vs rural designation, Census region, and patient distribution variables).
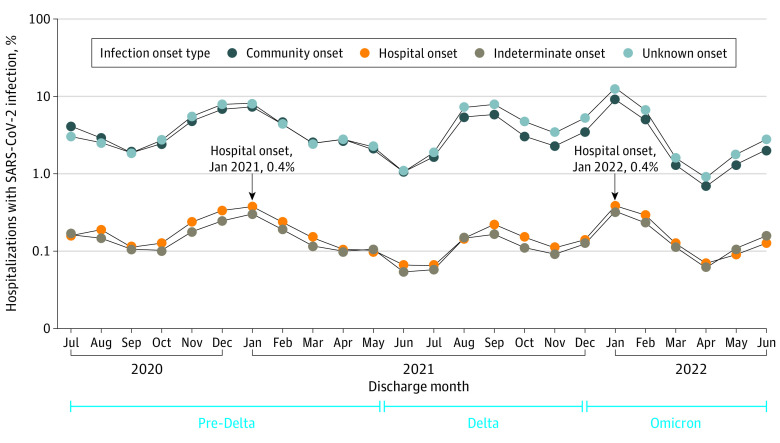
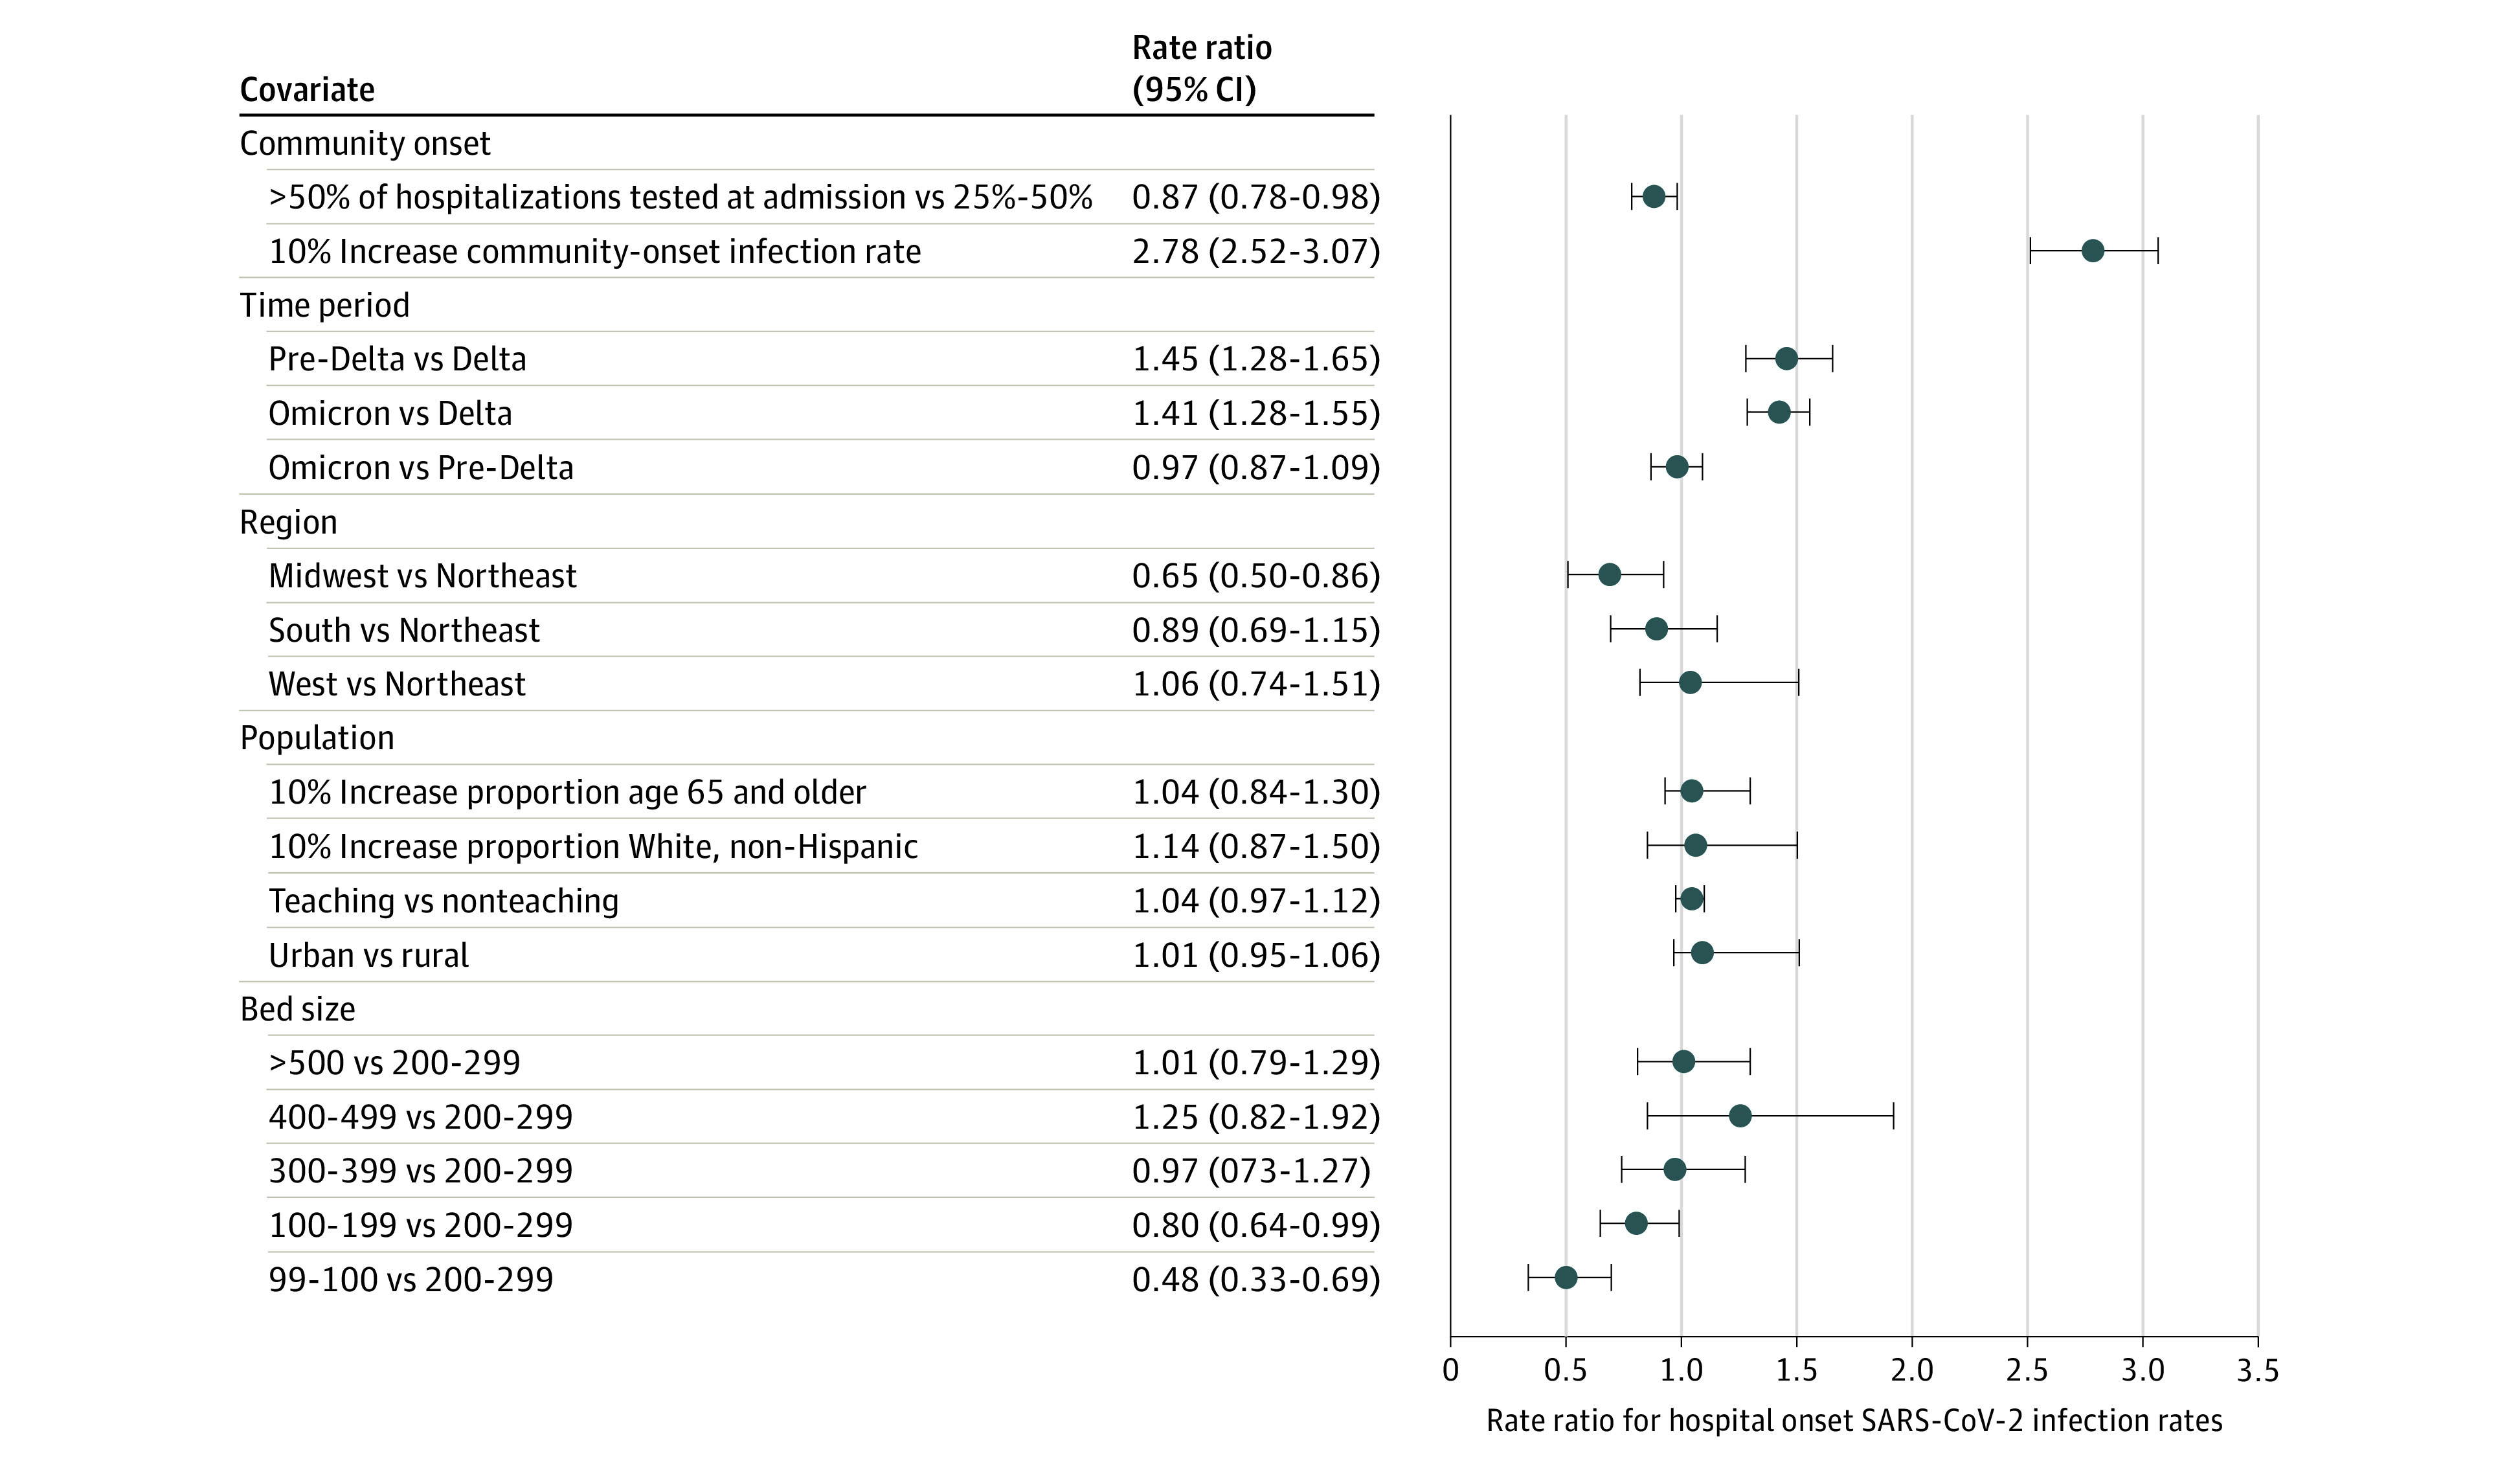
Results: A total of 5687 hospital-months from 288 distinct hospitals were included, which contributed 4 421 268 hospitalization records. Among 171 564 hospitalizations with a positive SARS-CoV-2 test, 7591 (4.4%) were found to be hospital onset and 6455 (3.8%) were indeterminate onset. The mean monthly hospital-onset infection rate per 1000 patient-days was 0.27 (95 CI, 0.26-0.29). Hospital-onset infections occurred in 2217 of 5687 hospital-months (39.0%). The monthly percentage of discharged patients tested for SARS-CoV-2 at admission varied; 1673 hospital-months (29.4%) had less than 25% of hospitalizations tested at admission; 2199 hospital-months (38.7%) had 25% to 50% of all hospitalizations tested, and 1815 hospital months (31.9%) had more than 50% of all hospitalizations tested at admission. Postadmission testing rates and community-onset infection rates increased with admission testing rates. In multivariable models restricted to hospital-months testing at least 25% of hospitalizations at admission, a 10% increase in community-onset SARS-CoV-2 infection rate was associated with a 178% increase in the hospital-onset infection rate (rate ratio, 2.78; 95% CI, 2.52-3.07). Additionally, the phase of the COVID-19 pandemic, the admission testing rate, Census region, and bed size were all significantly associated with hospital-onset SARS-CoV-2 infection rates.
Conclusions and relevance: In this cohort study of hospitals reporting SARS-CoV-2 infections, there was an increase of hospital-onset SARS-CoV-2 infections when community-onset infections were higher, indicating a need for ongoing and enhanced surveillance and prevention efforts to reduce in-hospital transmission of SARS-CoV-2 infections, particularly when community-incidence of SARS-CoV-2 infections is high.
Conflict of interest statement
Figures
References
-
- Lumley SF, Constantinides B, Sanderson N, et al. ; OUH Microbiology laboratory; OUH Infection Prevention and Control team . Epidemiological data and genome sequencing reveals that nosocomial transmission of SARS-CoV-2 is underestimated and mostly mediated by a small number of highly infectious individuals. J Infect. 2021;83(4):473-482. doi: 10.1016/j.jinf.2021.07.034 - DOI - PMC - PubMed
-
- Lambrou AS, Shirk P, Steele MK, et al. ; Strain Surveillance and Emerging Variants Bioinformatic Working Group; Strain Surveillance and Emerging Variants NS3 Working Group . Genomic surveillance for SARS-CoV-2 variants: predominance of the delta (B.1.617.2) and omicron (B.1.1.529) variants—United States, June 2021-January 2022. MMWR Morb Mortal Wkly Rep. 2022;71(6):206-211. doi: 10.15585/mmwr.mm7106a4 - DOI - PMC - PubMed
MeSH terms
Supplementary concepts
LinkOut - more resources
Full Text Sources
Medical
Miscellaneous
