. 2023 Dec 26;7(24):7525-7538.
doi: 10.1182/bloodadvances.2023010460.

GPRC5C drives branched-chain amino acid metabolism in leukemogenesis

Affiliations

GPRC5C drives branched-chain amino acid metabolism in leukemogenesis

Yu Wei Zhang et al. Blood Adv. .

Abstract

Leukemia stem cells (LSCs) share numerous features with healthy hematopoietic stem cells (HSCs). G-protein coupled receptor family C group 5 member C (GPRC5C) is a regulator of HSC dormancy. However, GPRC5C functionality in acute myeloid leukemia (AML) is yet to be determined. Within patient AML cohorts, high GPRC5C levels correlated with poorer survival. Ectopic Gprc5c expression increased AML aggression through the activation of NF-κB, which resulted in an altered metabolic state with increased levels of intracellular branched-chain amino acids (BCAAs). This onco-metabolic profile was reversed upon loss of Gprc5c, which also abrogated the leukemia-initiating potential. Targeting the BCAA transporter SLC7A5 with JPH203 inhibited oxidative phosphorylation and elicited strong antileukemia effects, specifically in mouse and patient AML samples while sparing healthy bone marrow cells. This antileukemia effect was strengthened in the presence of venetoclax and azacitidine. Our results indicate that the GPRC5C-NF-κB-SLC7A5-BCAAs axis is a therapeutic target that can compromise leukemia stem cell function in AML.


Conflict of interest statement

Conflict-of-interest disclosure: The authors declare no competing financial interests.

Figures

None
Graphical abstract
Figure 1.
Figure 1.
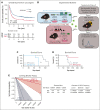
Gprc5c expression levels regulate the development of leukemia. (A) Overall survival according to GPRC5C expression in the Leucegene cohort. High expression levels of GPRC5C (GPRC5C high: ≥75th percentile, red curve) compared with low expression levels (GPRC5C low: <75th percentile, blue curve) are displayed by Kaplan-Meier curves. The P-value was obtained using the log-rank test for the comparison of survival curves. (B) Blue box: schematic representation of the experimental design to overexpress and assess the impact of increased Gprc5c levels in MLL-AF9. Red box: schematic representation of the experimental design to evaluate the effect of the loss of Gprc5c in MLL-AF9. (C) Survival curve depicting AML penetrance upon the gain of Gprc5c in MLL-AF9; n = 9. (D) Survival curve depicting AML penetrance upon loss of Gprc5c in MLL-AF9. Combination of 2 independent experiments; n = 5 to 7. (E) Limiting dilution assays for MLL-AF9-WT and MLL-AF9-Gprc5c-KO. Combination of 2 independent experiments. All represented by mean ± standard deviation. (C-D) Mantel-Cox test, ∗P < .05; ∗∗P < .01; ∗∗∗P < .001; ∗∗∗∗P <.0001. For all experiments, at least 2 independent experiments were performed. ns, not significant.
Figure 2.
Figure 2.
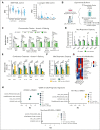
BCAA transporters in the progression of leukemia. (A) Left heat map: amino acids in the MLL-AF9 control and MLL-AF9-Gprc5c-OE cells. Log2 transformed the mean value of metabolite abundances per experiment and z-score centering per metabolite for comparison between experiments. Three independent experiments were performed with >2 replicates per experiment; n = 10. Right heat map: amino acids in MLL-AF9-WT and MLL-AF9-Gprc5c-KO. Log2-transformed mean value of metabolite abundances per experiment and z-score centering per metabolite for comparison between experiments. Two independent experiments were performed with >3 replicates per experiment; n = 7 to 11. (B) Venn diagram representing amino acids significantly upregulated in MLL-AF9-Gprc5c-OE (blue circle) or significantly downregulated in MLL-AF9-Gprc5c-KO (red circle). (C) Venn diagram representing amino acids imported by SLC7A5 or SLC43A1. (D) Schematic representation of the experimental design to rescue MLL-AF9-Gprc5c-KO cells by supplementation with BCAAs. Annexin V staining of BCAA-treated and control leukemia cells; n = 8; schematic representation of the experimental design to assess the impact of the loss of Slc7a5 or Slc43a1 in MLL-AF9. (E) Schematic representation of the experimental design to knockdown Slc7a5 and Slc43a1 in MLL-AF9 to determine impact on cell survival. (F) Quantitative (qPCR) validation of the knockdown of Slc7a5 or Slc43a1 in MLL-AF9 cells. Normalized to the housekeeping genes Oaz1/B2m and shRenilla; n = 4 to 8. (G) Heat map representing medium RNA expression from qPCR data (normalized to housekeeping gene-Oaz1/B2m and shRenilla); n = 9. (H) Annexin V staining of Slc7a5 or Slc43a1 knockdown in MLL-AF9 cells; n = 3 to 5. (I) Caspase-3 staining to determine the frequency of dead cells from Slc7a5 or Slc43a1 knockdown MLL-AF9 cells; n = 3. All represented by mean ± standard deviation. (A) Unpaired t test; (D,F-I) 2-way analysis of variance. ∗P < .05; ∗∗P < .01; ∗∗∗P < .001;∗∗∗∗ P <0.0001. For all experiments, at least 2 independent experiments were performed.
Figure 2.
Figure 2.
BCAA transporters in the progression of leukemia. (A) Left heat map: amino acids in the MLL-AF9 control and MLL-AF9-Gprc5c-OE cells. Log2 transformed the mean value of metabolite abundances per experiment and z-score centering per metabolite for comparison between experiments. Three independent experiments were performed with >2 replicates per experiment; n = 10. Right heat map: amino acids in MLL-AF9-WT and MLL-AF9-Gprc5c-KO. Log2-transformed mean value of metabolite abundances per experiment and z-score centering per metabolite for comparison between experiments. Two independent experiments were performed with >3 replicates per experiment; n = 7 to 11. (B) Venn diagram representing amino acids significantly upregulated in MLL-AF9-Gprc5c-OE (blue circle) or significantly downregulated in MLL-AF9-Gprc5c-KO (red circle). (C) Venn diagram representing amino acids imported by SLC7A5 or SLC43A1. (D) Schematic representation of the experimental design to rescue MLL-AF9-Gprc5c-KO cells by supplementation with BCAAs. Annexin V staining of BCAA-treated and control leukemia cells; n = 8; schematic representation of the experimental design to assess the impact of the loss of Slc7a5 or Slc43a1 in MLL-AF9. (E) Schematic representation of the experimental design to knockdown Slc7a5 and Slc43a1 in MLL-AF9 to determine impact on cell survival. (F) Quantitative (qPCR) validation of the knockdown of Slc7a5 or Slc43a1 in MLL-AF9 cells. Normalized to the housekeeping genes Oaz1/B2m and shRenilla; n = 4 to 8. (G) Heat map representing medium RNA expression from qPCR data (normalized to housekeeping gene-Oaz1/B2m and shRenilla); n = 9. (H) Annexin V staining of Slc7a5 or Slc43a1 knockdown in MLL-AF9 cells; n = 3 to 5. (I) Caspase-3 staining to determine the frequency of dead cells from Slc7a5 or Slc43a1 knockdown MLL-AF9 cells; n = 3. All represented by mean ± standard deviation. (A) Unpaired t test; (D,F-I) 2-way analysis of variance. ∗P < .05; ∗∗P < .01; ∗∗∗P < .001;∗∗∗∗ P <0.0001. For all experiments, at least 2 independent experiments were performed.
Figure 3.
Figure 3.
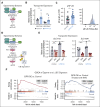
GPRC5C induces the expression of SLC7A5 and SLC43A1 via NF-κB signaling. (A) Experimental scheme to overexpress GPRC5C in KG1. (B) qPCR of SLC7A5 and SLC43A1 expression after GPRC5C-OE in KG1. Normalized to housekeeping gene GAPDH/ACTB and KG1-control; n = 5. (C) Mean fluorescence intensity measurement of pNF-κB in KG1-control and KG1- GPRC5C -OE cells with FACS plot representation; n = 10. (D) Experimental scheme of IKKi inhibition to prevent NF-κB activation in KG1-Control and KG1-GPRC5C-OE cells. (E) qPCR of SLC7A5 and SLC43A1 expression after GPRC5C -OE in KG1 with or without treatment with IKK inhibitor. Normalized to housekeeping gene GAPDH/ACTB and KG1-control; n = 5. (F) GSEA of the LSC signature from Eppert et al in KG1-control and KG1- GPRC5C-OE cells with or without treatment with IKK inhibitor (BMS-345541). GSEA was performed with BH-adjusted P values after the adaptive multilevel splitting Monte Carlo approach. All represented by mean ± standard deviation. Unpaired Student t test was performed unless otherwise indicated ∗P < .05; ∗∗P < .01; ∗∗∗P < .001; ∗∗∗∗ P < 0.0001. For all experiments, at least 2 independent experiments were performed. BH, Benjamini-Hochberg correction; DMSO, dimethyl sulfoxide; MFI, mean fluorescence intensity; IKKi, IκB kinase inhibitor.
Figure 4.
Figure 4.
JPH203 combined with Ven + Aza increased antileukemia efficacy in AML. (A) Dot plot showing reads per kilobase of transcript per million mapped reads of SLC7A5, SLC43A1, and SLC43A2 stratified based on GPRC5Chi(GPRC5C high: ≥75th percentile) and GPRC5Clow (GPRC5C low: <75th percentile), expression from the BEAT AML and the Leucegene AML cohorts. (B) Experimental scheme to assess treatment with JPH203 + Ven + Aza in leukemia cell lines and BM samples from patients with de novo AML. (C) Absolute number of live cells, as determined by annexin V staining in specimens of patients with AML treated with JPH203 for 24 hours. Normalized to the DMSO control of each AML specimen; n = 3 technical replicates per AML specimen. (D) Maximum respiration measured by the seahorse assay of patient cells with AML treated with JPH203 for 12 hours. Normalized to the DMSO control of each AML specimen; n = 2 to 5 technical replicates per AML specimen. (E) Absolute cell count of live cells as determined by annexin V staining in patient specimens with AML treated with Ven + Aza + JPH203 and measured at 24 hours. Normalized to the DMSO control of each AML specimen. CDI was calculated for each AML specimen. CDI value < 1 (synergistic), CDI  =  1 (additive), and CDI > 1 (antagonistic); n = 3 to 5 technical replicates per AML specimen. (F) Oxygen consumption levels measured by the seahorse assay of specimens of patients with AML treated with Ven + Aza + JPH203 for 12 hours. Normalized to the DMSO control of each AML specimen; n = 5 technical replicate per AML specimen. (G) Heat map of amino acids metabolites. Z-score centering of the mean value of metabolite abundance per specimen from patients with AML; n = 3 specimens from patients with AML. (H) GSEA of LSC/prognostic signatures under treatment conditions compared with the DMSO control. GSEA was performed with BH-adjusted P values after the adaptive multilevel splitting Monte Carlo approach. GAL_LSC_DOWN, GOOD_PROGNOSIS_AML, EPPERT_LSC_UP, and SOMERVAILLE_AML_DOWN. All represented by mean ± standard deviation. (A,G) Unpaired Student t test; (C-F) 2-way analysis of variance. ∗P < .05; ∗∗P < .01; ∗∗∗P < .001; ∗∗∗∗P < .0001. For all experiments, at least 2 independent experiments were performed.
Figure 5.
Figure 5.
Graphic abstract. Left panel - GPRC5C modulates AML aggression. Middle panel - GPRC5C signals through NF-κB to enhance the expression of SLC7A5 and SLC43A1. Right panel - Inhibition of SLC7A5 with JPH203 targets the respiratory capacity of leukemic cells, hindering their viability. This effect is strengthen by the addition of venetoclax and azacitidine.

References

    1. Thomas D, Majeti R. Biology and relevance of human acute myeloid leukemia stem cells. Blood. 2017;129(12):1577–1585. - PMC - PubMed
    1. Ng SWK, Mitchell A, Kennedy JA, et al. A 17-gene stemness score for rapid determination of risk in acute leukaemia. Nature. 2016;540(7633):433–437. - PubMed
    1. Lagadinou Eleni D, Sach A, Callahan K, et al. BCL-2 inhibition targets oxidative phosphorylation and selectively eradicates quiescent human leukemia stem cells. Cell Stem Cell. 2013;12(3):329–341. - PMC - PubMed
    1. Trumpp A, Wiestler OD. Mechanisms of Disease: cancer stem cells—targeting the evil twin. Nat Clin Pract Oncol. 2008;5(6):337–347. - PubMed
    1. Ito K, Bonora M, Ito K. Metabolism as master of hematopoietic stem cell fate. Int J Hematol. 2019;109(1):18–27. - PMC - PubMed

Publication types

MeSH terms

Substances