. 2023 Nov 1;34(11):1843-1862.
doi: 10.1681/ASN.0000000000000217. Epub 2023 Aug 28.

Unified Mouse and Human Kidney Single-Cell Expression Atlas Reveal Commonalities and Differences in Disease States

Affiliations

Unified Mouse and Human Kidney Single-Cell Expression Atlas Reveal Commonalities and Differences in Disease States

Jianfu Zhou et al. J Am Soc Nephrol. .

Abstract

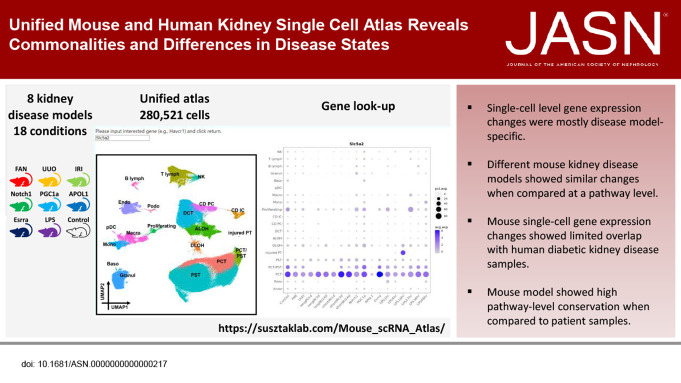
Significance statement: Mouse models have been widely used to understand kidney disease pathomechanisms and play an important role in drug discovery. However, these models have not been systematically analyzed and compared. The authors characterized 18 different mouse kidney disease models at both bulk and single-cell gene expression levels and compared single-cell gene expression data from diabetic kidney disease (DKD) mice and from patients with DKD. Although single cell-level gene expression changes were mostly model-specific, different disease models showed similar changes when compared at a pathway level. The authors also found that changes in fractions of cell types are major drivers of bulk gene expression differences. Although the authors found only a small overlap of single cell-level gene expression changes between the mouse DKD model and patients, they observed consistent pathway-level changes.

Background: Mouse models have been widely used to understand kidney disease pathomechanisms and play an important role in drug discovery. However, these models have not been systematically analyzed and compared.

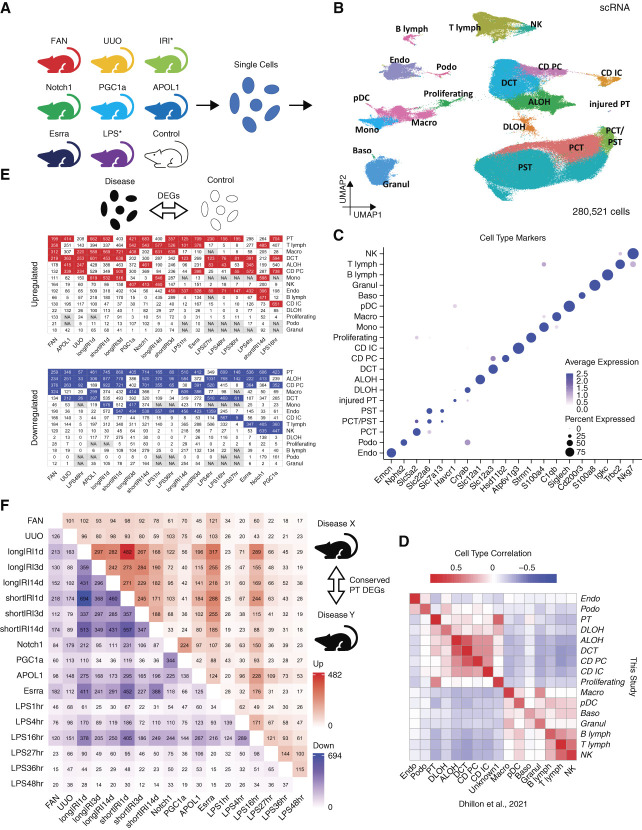
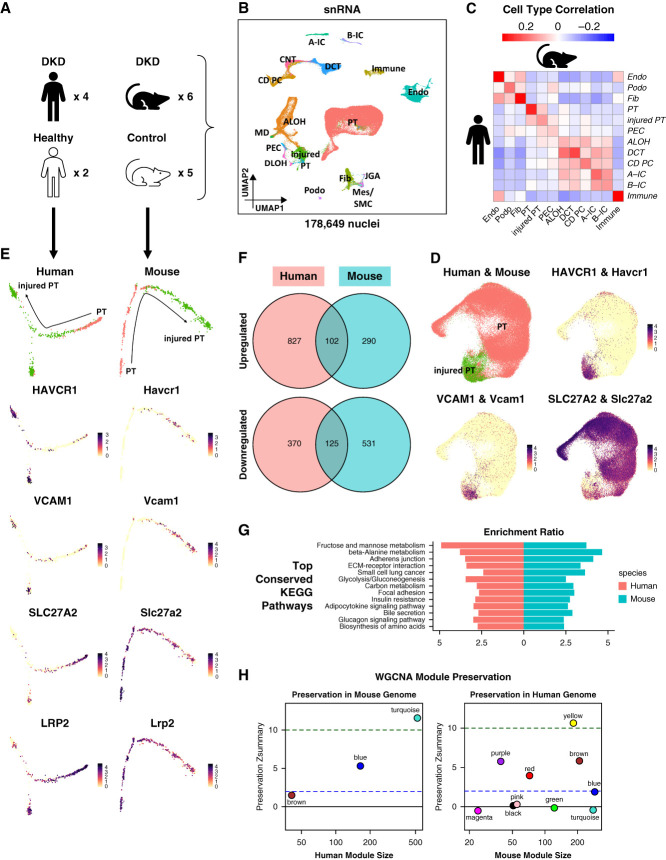
Methods: We analyzed single-cell RNA sequencing data (36 samples) and bulk gene expression data (42 samples) from 18 commonly used mouse kidney disease models. We compared single-nucleus RNA sequencing data from a mouse diabetic kidney disease model with data from patients with diabetic kidney disease and healthy controls.

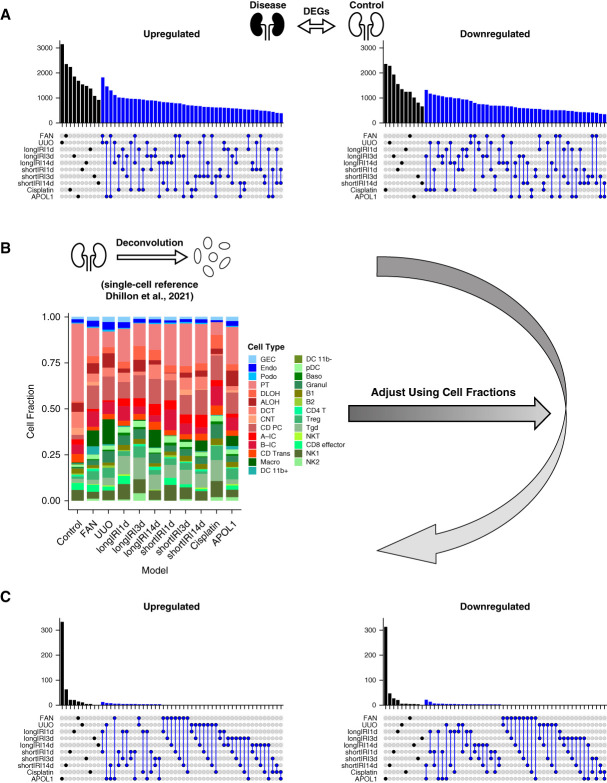
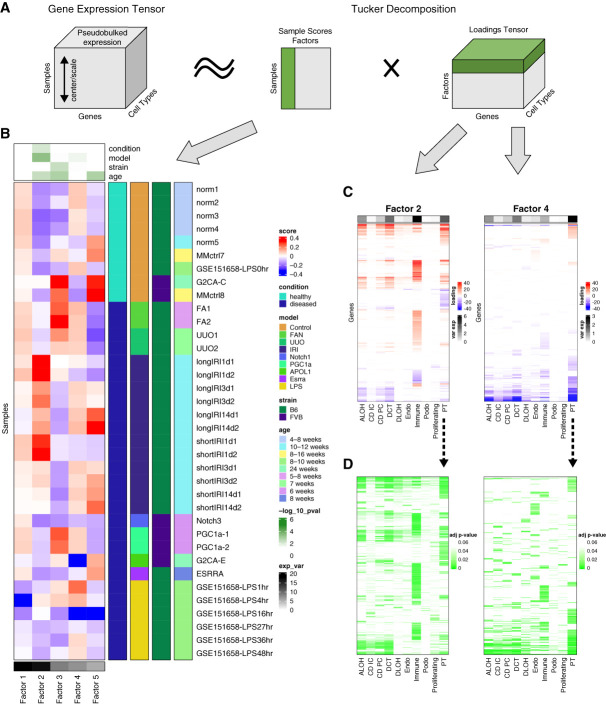
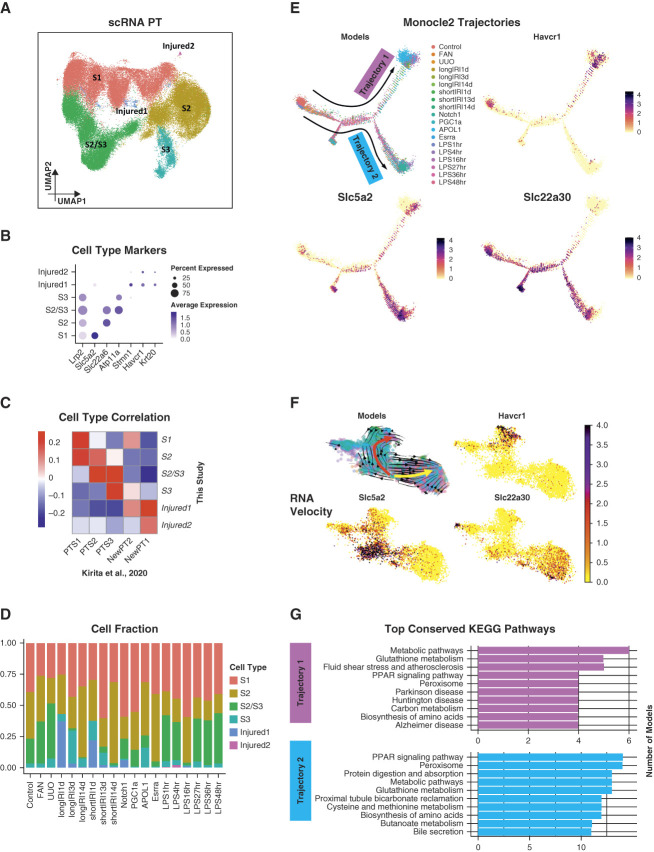
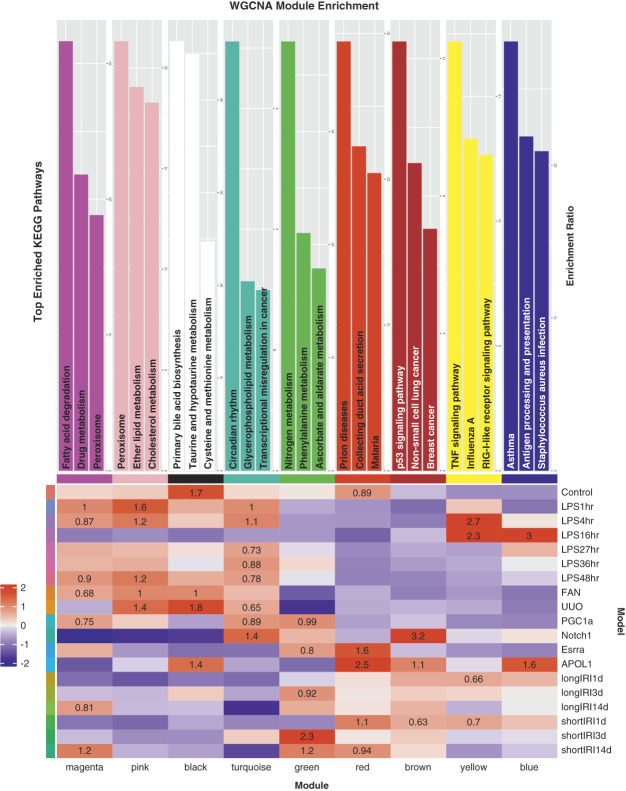
Results: We generated a uniformly processed mouse single-cell atlas containing information for nearly 300,000 cells, identifying all major kidney cell types and states. Our analysis revealed that changes in fractions of cell types are major drivers of differences in bulk gene expression. Although gene expression changes at the single-cell level were mostly model-specific, different disease models showed similar changes when compared at a pathway level. Tensor decomposition analysis highlighted the important changes in proximal tubule cells in disease states. Specifically, we identified important alterations in expression of metabolic and inflammation-associated pathways. The mouse diabetic kidney disease model and patients with diabetic kidney disease shared only a small number of conserved cell type-specific differentially expressed genes, but we observed pathway-level activation patterns conserved between mouse and human diabetic kidney disease samples.

Conclusions: This study provides a comprehensive mouse kidney single-cell atlas and defines gene expression commonalities and differences in disease states in mice. The results highlight the key role of cell heterogeneity in driving changes in bulk gene expression and the limited overlap of single-cell gene expression changes between animal models and patients, but they also reveal consistent pathway-level changes.


Conflict of interest statement

M.S. Balzer reports consultancy: Boehringer-Ingelheim; ownership interest: Arcturus Therapeutics, AstraZeneca, Bayer, BioNTech, CureVac, Linde, Moderna, Pfizer; honoraria: Boehringer-Ingelheim; and advisory or leadership role: Boehringer-Ingelheim, Journal of the American Society of Nephrology. K. Susztak reports consultancy: AstraZeneca, GSK, Novo Nordisk, Pfizer; ownership interest: Jnana; research funding: AstraZeneca, Bayer; Boehringer Ingelheim; Calico, Gilead; GSK, Jnana, Kyowa Kirin Genentech, Maze, Novartis, Novo Nordisk, ONO Pharma, Regeneron; Variant Bio; Honoraria: AstraZeneca, Bayer, Jnana, Maze, Pfizer; and advisory or leadership role: Editorial board; Cell Metabolism, eBioMedicine, Jnana, Journal of American Society of Nephrology, Journal of Clinical Investigation, Kidney International, Med, Pfizer. All remaining authors have nothing to disclose.

Because Katalin Susztak is an editor of the Journal of the American Society of Nephrology, she was not involved in the peer review process for this manuscript. A guest editor oversaw the peer review and decision-making process for this manuscript.

Figures

None
Graphical abstract
Figure 1
Figure 1
Single-cell RNA-seq atlas of mouse kidney disease models. (A) Mouse kidney models used to generate the scRNA-seq atlas: APOL1, Apol1 transgenic; Control, wild-type control; Esrra, Esrra knockout; FAN, folic acid nephropathy; IRI, ischemia reperfusion injury; LPS, endotoxin (LPS) injection; Notch1, Notch1 transgenic; PGC1a, Pgc1a transgenic; UUO, unilateral ureteral obstruction. Note, IRI contains long and short IRI samples collected 1, 3, and 14 days after the ischemia; LPS contains samples obtained at 1, 4, 16, 27, 36, and 48 hours after the LPS injection. (B) UMAP of 280,521 mouse kidney single cells. Nineteen cell types were identified: ALOH, ascending loop of Henle; B lymph, B lymphocyte; Baso, basophile; CD IC, collecting duct intercalated cell; CD PC, collecting duct principal cell; DCT, distal convoluted tubule; DLOH, descending loop of Henle; Endo, endothelial cell; Granul, granulocyte; injured PT, injured proximal tubule; Macro, macrophage; Mono, monocyte; NK, natural killer cell; PCT, proximal convoluted tubule; pDC, plasmacytoid dendritic cell; Podo, podocyte; Proliferating, proliferating cell; PST, proximal straight tubule; T lymph, T lymphocyte. (C) Dot plot of cell type–specific marker genes (dot size denotes percentage of cells expressing the marker, and color scale represents average gene expression values). (D) Heatmap showing Pearson correlation coefficients of averaged cell type gene expression between mouse kidney scRNA-seq atlas generated in this study and a published mouse scRNA-seq dataset with control and FAN kidney samples. (E) Numbers of upregulated (top) and downregulated (bottom) cell type–specific DEGs (disease versus control). NA (i.e., not applicable) means not enough cells in either disease or control groups for DEG identification. Within each mouse model, the four cell types having the most upregulated and downregulated DEGs are highlighted in red and blue, respectively. (F) Heatmap showing the numbers of upregulated (upper triangle) and downregulated (lower triangle) cell type–specific DEGs (against the control) conserved between any two studied mouse kidney disease models in PT cells. Figure 1 can be viewed in color online at www.jasn.org.
Figure 2
Figure 2
Cell fraction changes account for most bulk kidney gene expression differences in mouse disease models. (A) Upset plots showing the numbers of upregulated (left) and downregulated (right) DEGs (against the control) of each mouse kidney disease model in the bulk RNA-seq data. The black bar represents the DEG count for a single model, while the blue bar shows the number of DEGs conserved between two models. (B) Bar plot showing the average cell fraction of each mouse kidney model in the bulk RNA-seq data predicted by CIBERSORTx deconvolution with a published mouse kidney scRNA-seq dataset as the reference. (C) Upset plots showing the numbers of upregulated (left) and downregulated (right) DEGs (against the control) of each mouse kidney disease model in the bulk RNA-seq data after adjusting for cell fractions. The black bar represents the DEG count for a single model, while the blue bar shows the number of DEGs conserved between two models. Figure 2 can be viewed in color online at www.jasn.org.
Figure 3
Figure 3
Tensor decomposition identifies PT as key disease kidney driving cell type across animal models. (A) A schematic diagram illustrating the tensor decomposition using scITD adapted from the Kharchenko Lab. First, a pseudobulked tensor is created from cell populations of multiple samples (left). Then, tucker decomposition extracted the most informative factors, each comprising a vector of sample scores (middle) and a loadings matrix (right). Sample scores and loadings for one factor are highlighted in green. (B) Sample score heatmap for the decomposition of the mouse kidney scRNA-seq data. At the top, the P-values for associations between the factor scores and mouse kidney condition, model, strain, and age information are shown. The P-values were calculated using univariate linear model F-tests. Rows are grouped by mouse conditions and models, shown as annotations on the right side. Name, strain, and age of each mouse sample were also shown as annotations on the right side. Columns are ordered by explained variance for each factor, shown as a bottom annotation. (C) Loading matrices for factors 2 and 4 limited to significant genes. The top annotation shows the percentage of overall explained variance for each cell type of the factor. Rows are hierarchically clustered. (D) The same matrices for factors 2 and 4 as those in (C) except that each entry shows the association significance P-value of each gene in each cell type of the factor. Figure 3 can be viewed in color online at www.jasn.org.
Figure 4
Figure 4
Conserved pathway activities in PT cells across different mouse disease models. (A) UMAP of 70,501 PT cells from the mouse scRNA-seq data. Among the resultant cell clusters, we identified the three key PT segments: S1 (featured by the expression of Slc5a2), S2 (featured by the expression of Slc22a6), S3 (featured by the expression of Atp11a), and a cluster of S2 and S3 cells (featured by the coexpression of Slc22a6 and Atp11a). The remaining clusters were injured PT cells (i.e., Injured1 and Injured2), featured by the coexpression of Havcr1 and Krt20 and lower expression of canonical PT markers (e.g., Lrp2). (B) Dot plot of cell type–specific marker genes (dot size denotes percentage of cells expressing the marker, and color scale represents average gene expression values). (C) Heatmap showing Pearson correlation coefficients of averaged PT cell subtype gene expression between mouse kidney scRNA-seq atlas generated in this study and a published mouse snRNA-seq dataset with control and IRI kidney samples. (D) Bar plot showing the PT subtype cell fractions in each mouse kidney model of the scRNA-seq data. (E) Trajectory analysis of PT cells. The trajectories were calculated using Monocle 2. All four panels show the same trajectories. The top left panel indicates the location of the cells along the trajectories for mouse kidney models. The remaining panels show the expression of PT cell subtype marker genes along the trajectories. (F) RNA velocity analysis of PT cells. The RNA velocity was predicted using scVelo. The top left panel identifies two main trajectories, indicated by the red and yellow arrows, respectively. It also shows the cell location along the trajectories for mouse kidney models, using the same color scheme as (E). The remaining panels illustrate the expression of PT cell subtype marker genes along the trajectories. (G) Bar plots showing the top conserved KEGG pathways among the mouse kidney models in each identified Monocle 2 trajectory. Figure 4 can be viewed in color online at www.jasn.org.
Figure 5
Figure 5
Weighted gene coexpression network analysis of PT cells. The heatmap (bottom) demonstrates high WGCNA module association and conservation among the mouse kidney models. The bar plots (top) show the top KEGG pathways enriched in each identified WGCNA module. Figure 5 can be viewed in color online at www.jasn.org.
Figure 6
Figure 6
Human and mouse DKD snRNA-seq atlas. (A) Human and mouse samples used to generate the human and mouse DKD snRNA-seq atlas. (B) UMAP of 54,945 human and 123,704 mouse kidney single nuclei. This was generated by integrating human and mouse snRNA-seq data. Eighteen cell types were identified: A-IC, alpha intercalated cell; ALOH, ascending loop of Henle; B-IC, beta intercalated cell; CD PC, collecting duct principal cell; CNT, connecting tubule; DCT, distal convoluted tubule; DLOH, descending loop of Henle; Endo, endothelial cell; Fib, fibroblast; Immune, immune cell; injured PT, injured proximal tubule; JGA, juxtaglomerular apparatus; MD, macular densa; Mes, mesangial cell; PEC, parietal epithelial cell; Podo, podocyte; PT, proximal tubule; SMC, smooth muscle cell. (C) Heatmap showing Pearson correlation coefficients of averaged cell type gene expression between human and mouse kidney snRNA-seq data. Each row represents a cell type in the human data, and each column represents a cell type in the mouse data. (D) Integration of 19,319 human and 70,125 mouse PT and injured PT nuclei. The top left panel shows the resultant UMAP. The remaining panels are feature plots showing the expression of PT and injured PT marker genes. (E) Trajectory analysis of human and mouse PT nuclei. The trajectories were calculated using Monocle 2. Panels on the left column were generated using the human data, while panels on the right column were generated using the mouse data. Panels on the top row indicate the location of PT and injured PT nuclei along the trajectories, while the remaining panels illustrate the expression of PT and injured PT marker genes along the trajectories. (F) Venn diagrams showing the numbers of upregulated (top) and downregulated (bottom) genes along the trajectories that were conserved between the human and mouse data. (G) Bar plot showing the top conserved KEGG pathways between the human and mouse data along the trajectories. (H) Preservation Zsummary statistics of human WGCNA modules in the mouse data (left) and mouse WGCNA modules in the human data (right). Each point represents a module. Point color reflects the module color. Points are labeled by their respective colors. Blue and green lines depict the rough thresholds for weak (Z=2) and strong (Z=10) evidence of module preservation. Figure 6 can be viewed in color online at www.jasn.org.

References

    1. Levin A, Tonelli M, Bonventre J, Coresh J, Donner JA, Fogo AB. Global kidney health 2017 and beyond: a roadmap for closing gaps in care, research, and policy. Lancet. 2017;390(10105):1888–1917. doi:10.1016/S0140-6736(17)30788-2 - DOI - PubMed
    1. National Kidney Foundation Research Roundtable Work Group on behalf of the National Kidney Foundation. Research priorities for kidney-related research-an agenda to advance kidney care: a position statement from the National kidney foundation. Am J Kidney Dis. 2022;79(2):141–152. doi:10.1053/j.ajkd.2021.08.018 - DOI - PubMed
    1. Dhillon P, Park J, Hurtado Del Pozo C, Li L, Doke T, Huang S. The nuclear receptor ESRRA protects from kidney disease by coupling metabolism and differentiation. Cell Metab. 2021;33(2):379–394.e8. doi:10.1016/j.cmet.2020.11.011 - DOI - PMC - PubMed
    1. Doke T, Abedini A, Aldridge DL, Yang YW, Park J, Hernandez CM. Single-cell analysis identifies the interaction of altered renal tubules with basophils orchestrating kidney fibrosis. Nat Immunol. 2022;23(6):947–959. doi:10.1038/s41590-022-01200-7 - DOI - PMC - PubMed
    1. Balzer MS, Doke T, Yang YW, Aldridge DL, Hu H, Mai H. Single-cell analysis highlights differences in druggable pathways underlying adaptive or fibrotic kidney regeneration. Nat Commun. 2022;13(1):4018. doi:10.1038/s41467-022-31772-9 - DOI - PMC - PubMed

LinkOut - more resources