. 2023 Aug 28;19(8):e1010903.
doi: 10.1371/journal.pgen.1010903. eCollection 2023 Aug.

Genetic enhancers of partial PLK1 inhibition reveal hypersensitivity to kinetochore perturbations

Affiliations

Genetic enhancers of partial PLK1 inhibition reveal hypersensitivity to kinetochore perturbations

Karine Normandin et al. PLoS Genet. .

Abstract

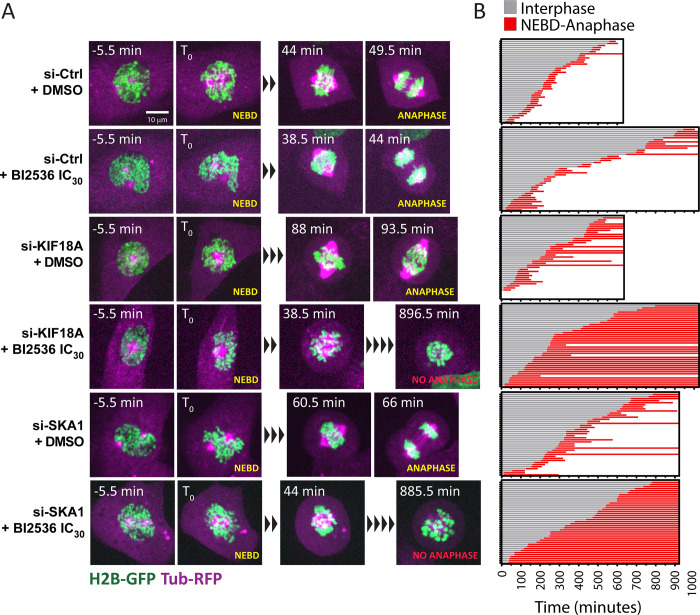
Polo-like kinase 1 (PLK1) is a serine/threonine kinase required for mitosis and cytokinesis. As cancer cells are often hypersensitive to partial PLK1 inactivation, chemical inhibitors of PLK1 have been developed and tested in clinical trials. However, these small molecule inhibitors alone are not completely effective. PLK1 promotes numerous molecular and cellular events in the cell division cycle and it is unclear which of these events most crucially depend on PLK1 activity. We used a CRISPR-based genome-wide screening strategy to identify genes whose inactivation enhances cell proliferation defects upon partial chemical inhibition of PLK1. Genes identified encode proteins that are functionally linked to PLK1 in multiple ways, most notably factors that promote centromere and kinetochore function. Loss of the kinesin KIF18A or the outer kinetochore protein SKA1 in PLK1-compromised cells resulted in mitotic defects, activation of the spindle assembly checkpoint and nuclear reassembly defects. We also show that PLK1-dependent CENP-A loading at centromeres is extremely sensitive to partial PLK1 inhibition. Our results suggest that partial inhibition of PLK1 compromises the integrity and function of the centromere/kinetochore complex, rendering cells hypersensitive to different kinetochore perturbations. We propose that KIF18A is a promising target for combinatorial therapies with PLK1 inhibitors.


Conflict of interest statement

The authors have declared that no competing interests exist.

Figures

Fig 1
Fig 1. A chemogenomic screen identifies enhancers and suppressors of partial PLK1 inhibition.
A. Screen design. A NALM-6 clonal cell line allowing doxycycline-inducible Cas9 expression was transduced with the EKO sgRNA library. After blasticidin selection for the presence of sgRNA constructs, doxycycline was added and cells were allowed to proliferate for 8 days with or without the compounds as indicated. Cells were then harvested and submitted to Next Generation Sequencing (NGS) to quantify the relative amounts of each sgRNA constructs in the different cell populations. B. Pairwise comparisons of gene RANKS scores obtained in the 3 screens with the different PLK1 inhibitors. Negative scores indicate enhancers and positive scores indicate suppressors. Names of selected hit genes of interest are labeled. C. Results distribution showing average RANKS score and combined P-value across the 3 screens for each gene. Names of selected hit genes of interest are labeled. D. Protein interaction network of genes identified as enhancers and suppressors of partial PLK1 inhibition in the screens. Interactions (lines) are those reported in BioGRID or IntACT. Only genes with False Discovery Rates (FDR) < 0.001 were included. Colors indicate selected representative enriched GO terms. FDR-corrected P-values for selected GO terms are: 6.0 X 10⁻²² for Chromosomes, Centromeric region; 2.6 X 10⁻¹⁷ for Kinetochore; 9.0 X 10⁻⁶ for Microtubule-organizing center; 7.4 X 10⁻⁸ for Cell cycle process; 5.0 X 10⁻⁵ for Regulation of cell cycle (these last 2 terms were grouped into Cell cycle in the figure). E. Distribution of RANKS scores for KIF18A and SKA1 in 399 screens with 303 bioactive compounds. The top 3 screens with the most extreme scores are indicated. Note that they were conducted with the 3 PLK1 inhibitors tested. Coordinate values used to generate graphs in panels B-C and E are available in S2 Table and S1 Data, respectively.
Fig 2
Fig 2. Inactivation of KIF18A or SKA1 slows down proliferation of PLK1-compromised cells.
A. NALM-6 cells were selected for transduction with the indicated sgRNA expression constructs and cultures were analyzed for proliferation using Alamar Blue after 96 hours in the presence of different concentrations of BI2536. Results from one representative experiment are shown. Data points show averages of triplicates. Error bars: SD. B. BI2536 IC30 values for inhibition of proliferation obtained in experiments as in A. Averages of five independent experiments are shown ±SD. C. hTERT RPE-1 cells were transfected twice with the indicated siRNAs and cultures were analyzed for proliferation using Alamar Blue after 96 hours in the presence of different concentrations of BI2536. Results from one representative experiment are shown. Data points show averages of triplicates. Error bars: SD. D. BI2536 IC30 values for inhibition of proliferation obtained in experiments as in C. Averages of four independent experiments are shown ±SD. *** p < 0.001, ** p < 0.01 in Student’s unpaired T test. Coordinate values used to generate graphs are available in S2 Data.
Fig 3
Fig 3. Inactivation of KIF18A or SKA1 sensitizes PLK1-compromised cells to a SAC-dependent mitotic arrest.
A. Targeting KIF18A or SKA1 by CRISPR sensitizes NALM-6 cells to the BI2536-induced mitotic arrest. The mitotic index was measured after immunofluorescence for pHH3. A representative experiment is shown. Data points are averages of triplicates ±SD. B. IC30 values for BI2536 from 3 independent experiments as in A. Averages ±SD are shown. C. Silencing KIF18A or SKA1 by siRNA sensitizes hTERT RPE-1 cells to the BI2536-induced, SAC-dependent mitotic arrest. Inhibition of MPS1 with reversine strongly abrogates the mitotic arrest. The mitotic index was measured after immunofluorescence for pHH3. Data points are averages of triplicates ±SD from a representative experiment. D. IC30 values for BI2536 from 4 independent experiments as in C. Averages ±SD are shown. *** p < 0.001, ** p < 0.01, * p < 0.05 in Student’s unpaired T test. Coordinate values used to generate graphs are available in S3 Data.
Fig 4
Fig 4. Inactivation of KIF18A or SKA1 sensitizes PLK1-compromised cells to a metaphase arrest.
A. Time-lapse images of RPE-1 cells expressing H2B-GFP and α-Tub-mRFP and treated as indicated. BI2536 was added at the IC30 concentration (5 nM). The time of Nuclear Envelope BreakDown (NEBD) was set as time zero. Representative cells are shown at selected time points of interest. B. Mitotic history profiles of individual cells treated and imaged as indicated in A. Grey lines indicate the time before mitotic entry. Red lines indicate the time between NEBD and anaphase. Between 36 and 40 cells were analyzed for each condition. Coordinate values used to generate graphs are available in S4 Data.
Fig 5
Fig 5. Inactivation of KIF18A or SKA1 causes spatial mitotic defects before anaphase that are not grossly enhanced by partial inhibition of PLK1.
A. RPE-1 cells expressing H2B-GFP and α-Tub-mRFP (magenta) were treated as indicated, fixed and stained for centromeres (ACA, white) and DNA (DAPI, blue). BI2536 was added at the IC30 concentration (5 nM). Representative cells are shown, with their measured spindle lengths and centromere dispersion ratios (r). B-C. Quantification of centromere dispersion ratios (B) and mitotic spindle lengths (C) of cells treated as indicated and analyzed as in A. Fifty cells were analyzed per condition. Averages ±SD are shown. *** p < 0.001, ** p < 0.01, * p < 0.05 in Student’s unpaired T test. ns: non-significant. Coordinate values used to generate graphs are available in S5 Data.
Fig 6
Fig 6. Inactivation of KIF18A enhances nuclear reassembly defects after mitosis in PLK1-compromised cells.
A. Time-lapse images of RPE-1 cells expressing H2B-GFP and α-Tub-mRFP and treated as indicated. BI2536 was added at the IC30 concentration (5 nM). The top cell treated with BI2536 and a non-target siRNA reassembled the nucleus normally. The bottom cell treated with BI2536 and siRNA against KIF18A assembled micronuclei (arrowheads) after mitosis. The time prior to anaphase onset was set as time zero. B. RPE-1 cells expressing H2B-GFP and α-Tub-mRFP and treated as indicated were fixed and stained for Lamin A (white) and DAPI (blue). Note the structural nuclear defects occurring when KIF18A or SKA1 is depleted in the presence of BI2536 at the IC30. C-D. Quantification of solidity (C) and circularity (D) of the nucleus in cells treated as indicated. Averages ±SD are shown. *** p < 0.001, ** p < 0.01, * p < 0.05 in Student’s unpaired T test. ns: non-significant. Coordinate values used to generate graphs are available in S6 Data.
Fig 7
Fig 7. CENP-A loading on centromeres is extremely sensitive to partial PLK1 inhibition.
A. Immunofluorescence in RPE-1 cells treated for 72 h with the indicated concentrations of BI2536. CENP-A levels were measured in the DAPI-stained areas (inside yellow dotted lines). B. Quantifications as illustrated in A. Each data point is from a single cell. Blue and grey points are from two independent experiments (100 cells were analyzed per condition per experiment). Averages ±SD are shown. *** p < 0.001, ** p < 0.01 in Student’s unpaired T test. ns: non-significant. C. Western blots showing CENP-A levels in a crude chromatin fraction (C, pellet) vs the soluble fraction (S). The crude chromatin fraction was resuspended in 1/10 volume relative to the total lysate. Histone H3 (HH3) and α-Tubulin were monitored as chromatin and soluble markers, respectively. Concentrations of BI2536 used were measured in a cell proliferation inhibition assay (see Materials & Methods; IC10: 2.7 nM, IC30: 5.0 nM, IC50: 7.2 nM. IC90: 19.2 nM). Coordinate values used to generate graphs are available in S7 Data.

References

    1. Morgan DO. The Cell Cycle: Principles of Control. London: New Science Press; 2007. 297 p.
    1. Bock C, Datlinger P, Chardon F, Coelho MA, Dong MB, Lawson KA, et al.. High-content CRISPR screening. Nature Reviews Methods Primers. 2022;2(1):8. doi: 10.1038/s43586-022-00098-7 - DOI - PMC - PubMed
    1. Archambault V, Glover DM. Polo-like kinases: conservation and divergence in their functions and regulation. Nat Rev Mol Cell Biol. 2009;10(4):265–75. doi: 10.1038/nrm2653 - DOI - PubMed
    1. Zitouni S, Nabais C, Jana SC, Guerrero A, Bettencourt-Dias M. Polo-like kinases: structural variations lead to multiple functions. Nat Rev Mol Cell Biol. 2014;15(7):433–52. doi: 10.1038/nrm3819 - DOI - PubMed
    1. Sunkel CE, Glover DM. polo, a mitotic mutant of Drosophila displaying abnormal spindle poles. J Cell Sci. 1988;89 (Pt 1):25–38. - PubMed

Publication types

Substances

Grants and funding